Remote Sensing as a Tool for Land Degradation Neutrality Monitoring [Georgia]
- Creación:
- Actualización:
- Compilador: Hanns Kirchmeir
- Editores: Natia Kobakhidze, Christian Goenner
- Revisor: Rima Mekdaschi Studer
technologies_5488 - Georgia
Visualizar secciones
Expandir todo Colapsar todos1. Información general
1.2 Detalles de contacto de las personas de referencia e instituciones involucradas en la evaluación y la documentación de la Tecnología
co-compiler:
co-compiler:
Nombre del proyecto que financió la documentación/ evaluación de la Tecnología (si fuera relevante)
Integrated Biodiversity Management, South Caucasus (IBiS)Nombre de la(s) institución(es) que facilitaron la documentación/ evaluación de la Tecnología (si fuera relevante)
Deutsche Gesellschaft für Internationale Zusammenarbeit (GIZ)1.3 Condiciones referidas al uso de datos documentados mediante WOCAT
El compilador y la/s persona(s) de referencia claves aceptan las condiciones acerca del uso de los datos documentados mediante WOCAT:
Sí
1.4 Declaración de la sostenibilidad de la Tecnología descrita
¿La Tecnología aquí descrita resulta problemática en relación a la degradación de la tierra, de tal forma que no puede considerársela una tecnología sostenible para el manejo de la tierra?
No
1.5 Referencia al (los) Cuestionario(s) de Enfoques MST (documentados usando WOCAT)
Land Degradation Neutrality Transformative Projects and Programmes (LDN-TPP) … [Georgia]
In the framework of the project ‘Generating Economic and Environmental Benefits from Sustainable Land Management for Vulnerable Rural Communities of Georgia’, Land Degradation Neutrality Transformative Projects and Programmes (LDN-TPP) were developed to implement the LDN targets at municipal level. The approach defines the process to break down global and international …
- Compilador: Daniel Zollner
Integrated Pasture Management Planning in Mountainous Regions [Georgia]
The unsustainable use of pastures and forest areas has led to soil erosion, degradation, desertification and loss of biodiversity in the high mountain areas of the South Caucasus. The development of pasture passports is part of a broader approach to a strategic pasture management plan for Tusheti. This showcase includes …
- Compilador: Hanns Kirchmeir
2. Descripción de la Tecnología MST
2.1 Breve descripción de la Tecnología
Definición de la Tecnología:
Land degradation contributes to biodiversity loss and the impoverishment of rural livelihoods in Tusheti. Above all, however, land degradation are triggered by climate change as traditional land use practise might not be adapted to new climate conditions which can cause or speed up degradation processes significantly. On the other hand, degraded land often leads to low biomass volumes and this reduces the ecosystem capability to stabilise local climate conditions. The concept of Land Degradation Neutrality (LDN) and the method of using remote sensing for monitoring land degradation are tools to identify the need for local planning processes. This showcase describes the LDN monitoring concept, national targets and the technology to assess indicators, mechanism and incentives for LDN.
2.2 Descripción detallada de la Tecnología
Descripción:
Purpose
The continuing global degradation of land resources threatens food security and the functioning of ecosystem services by reducing or losing their biological or economic productivity. Unsustainable land-use practices such as deforestation, overgrazing and inappropriate agricultural management systems trigger the loss and degradation of valuable land resources in Georgia. These effects are visible in all countries of the South Caucasus. About 35% of the agricultural land in Georgia is severely degraded, 60% is of low to middle production quality.
Land Degradation Neutrality (LDN)
LDN is a new international concept to combat the ongoing degradation of valuable soil resources. The LDN concept was developed by the UNCCD to encourage countries to take measures to avoid, reduce or reverse land degradation, with the vision of achieving a zero-net loss of productive land. To combat land degradation in Georgia, in 2017, the national LDN Working Group set voluntary national targets to address specific aspects of LDN, and submitted them to the UNCCD Secretariat.
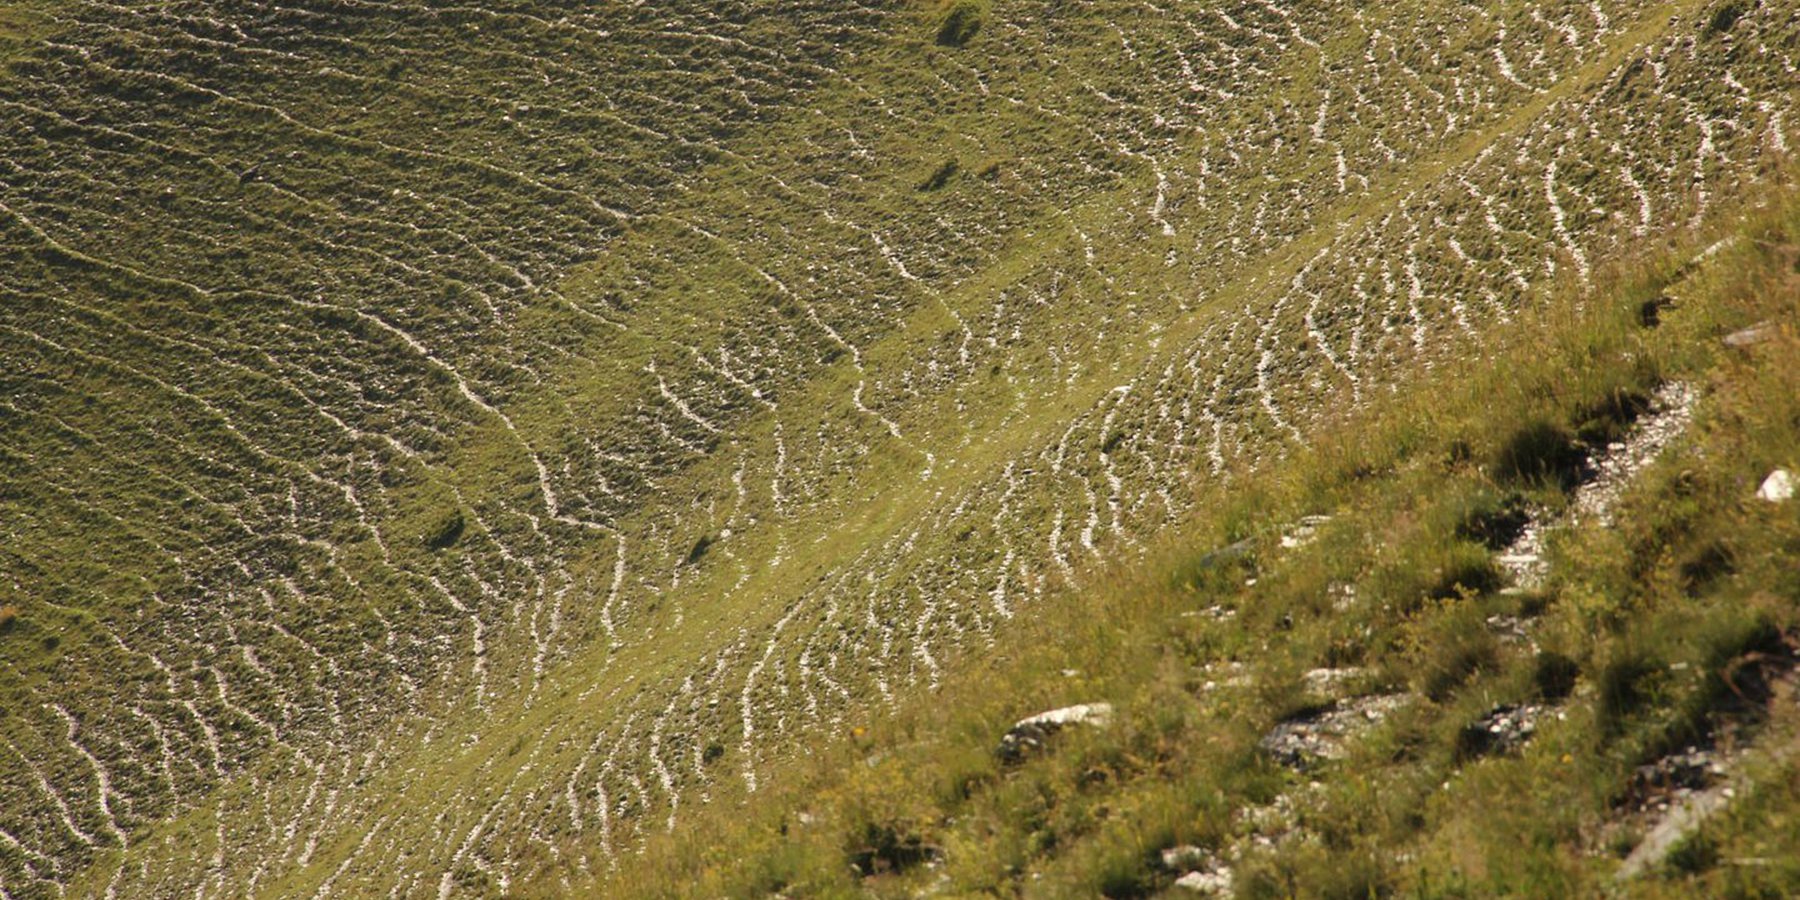
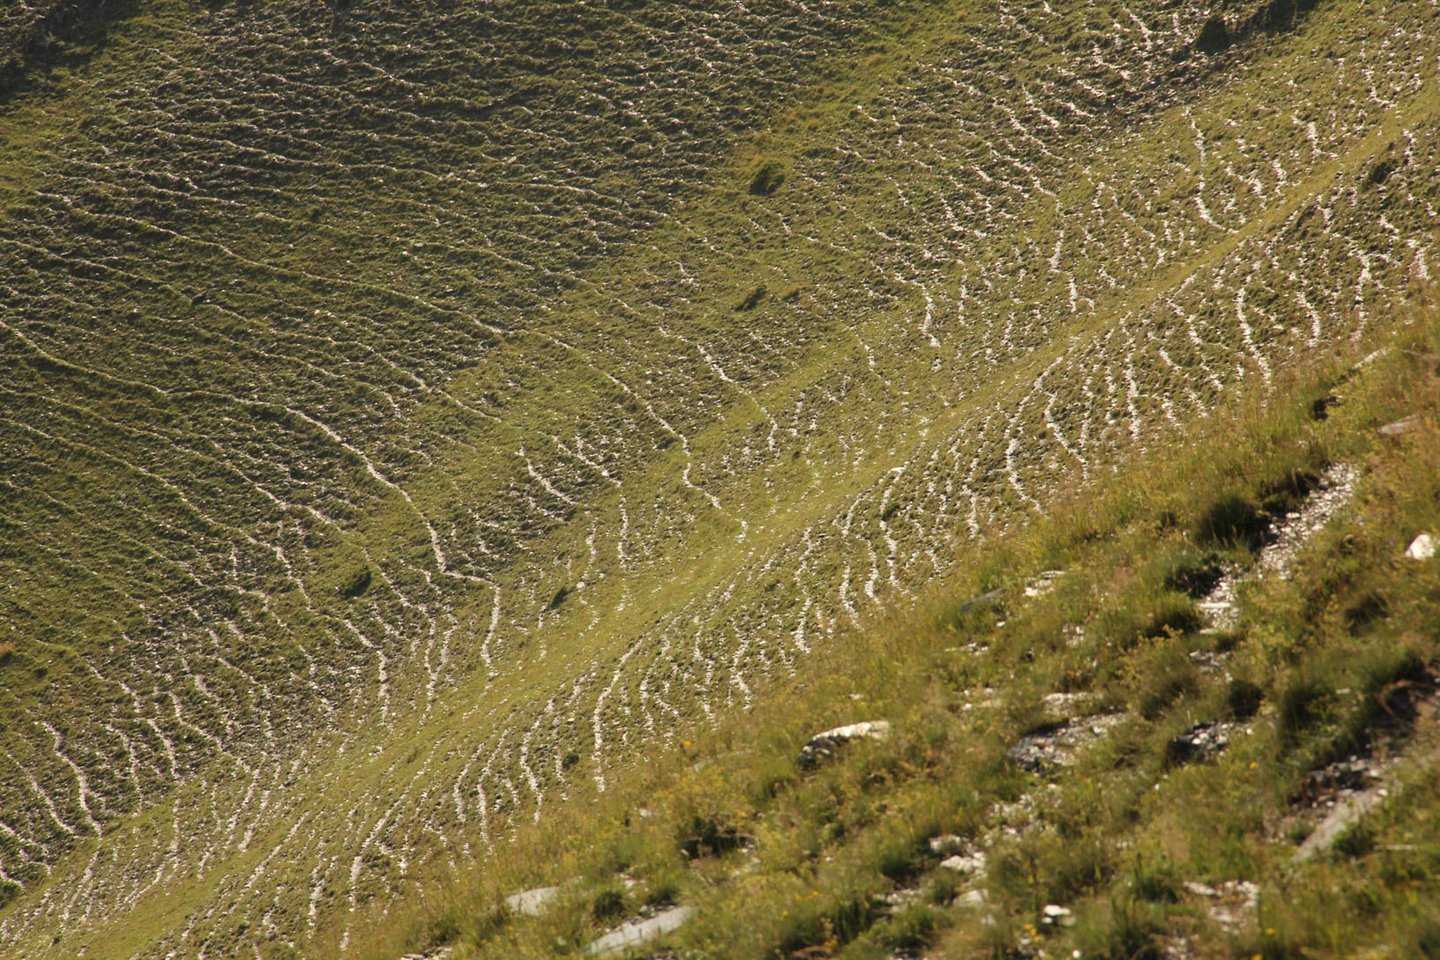
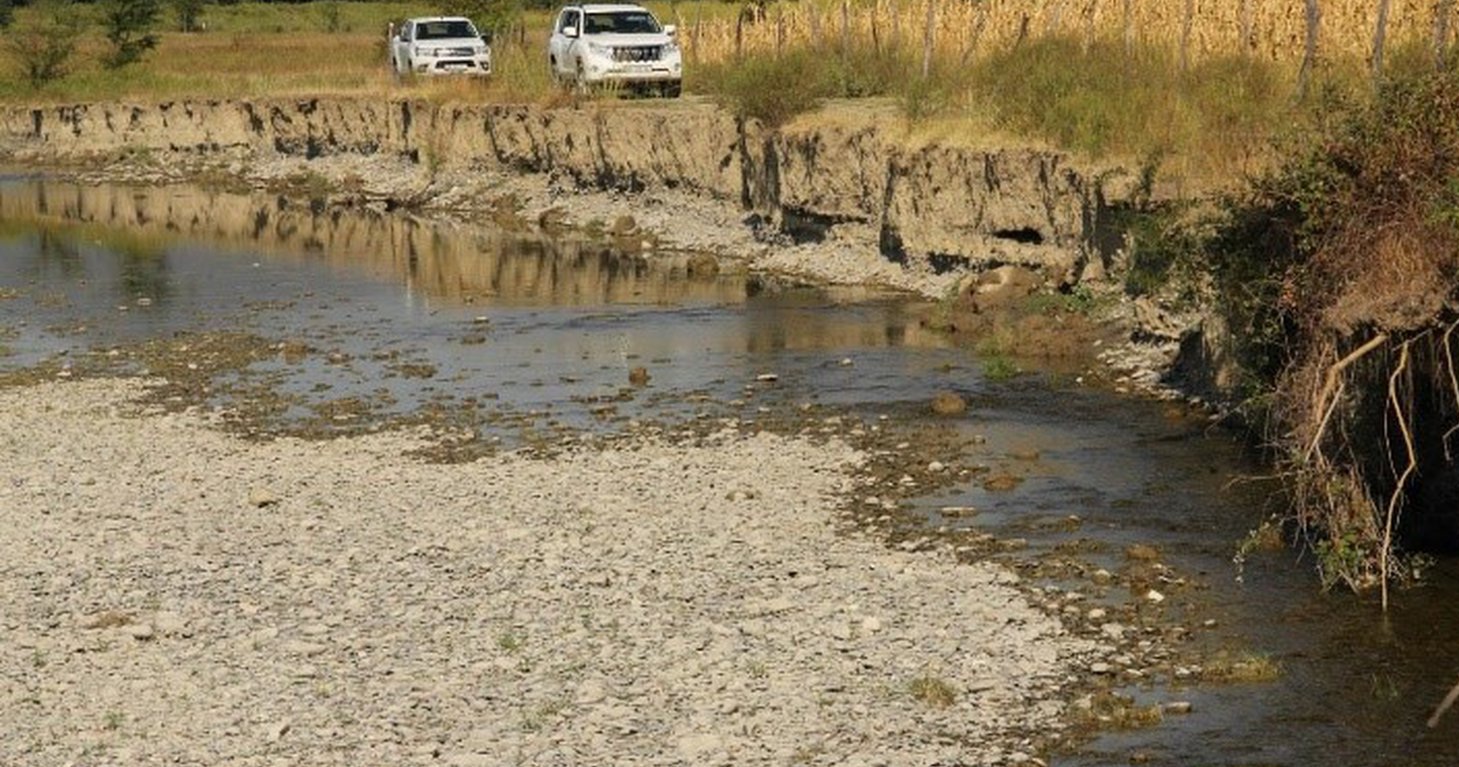
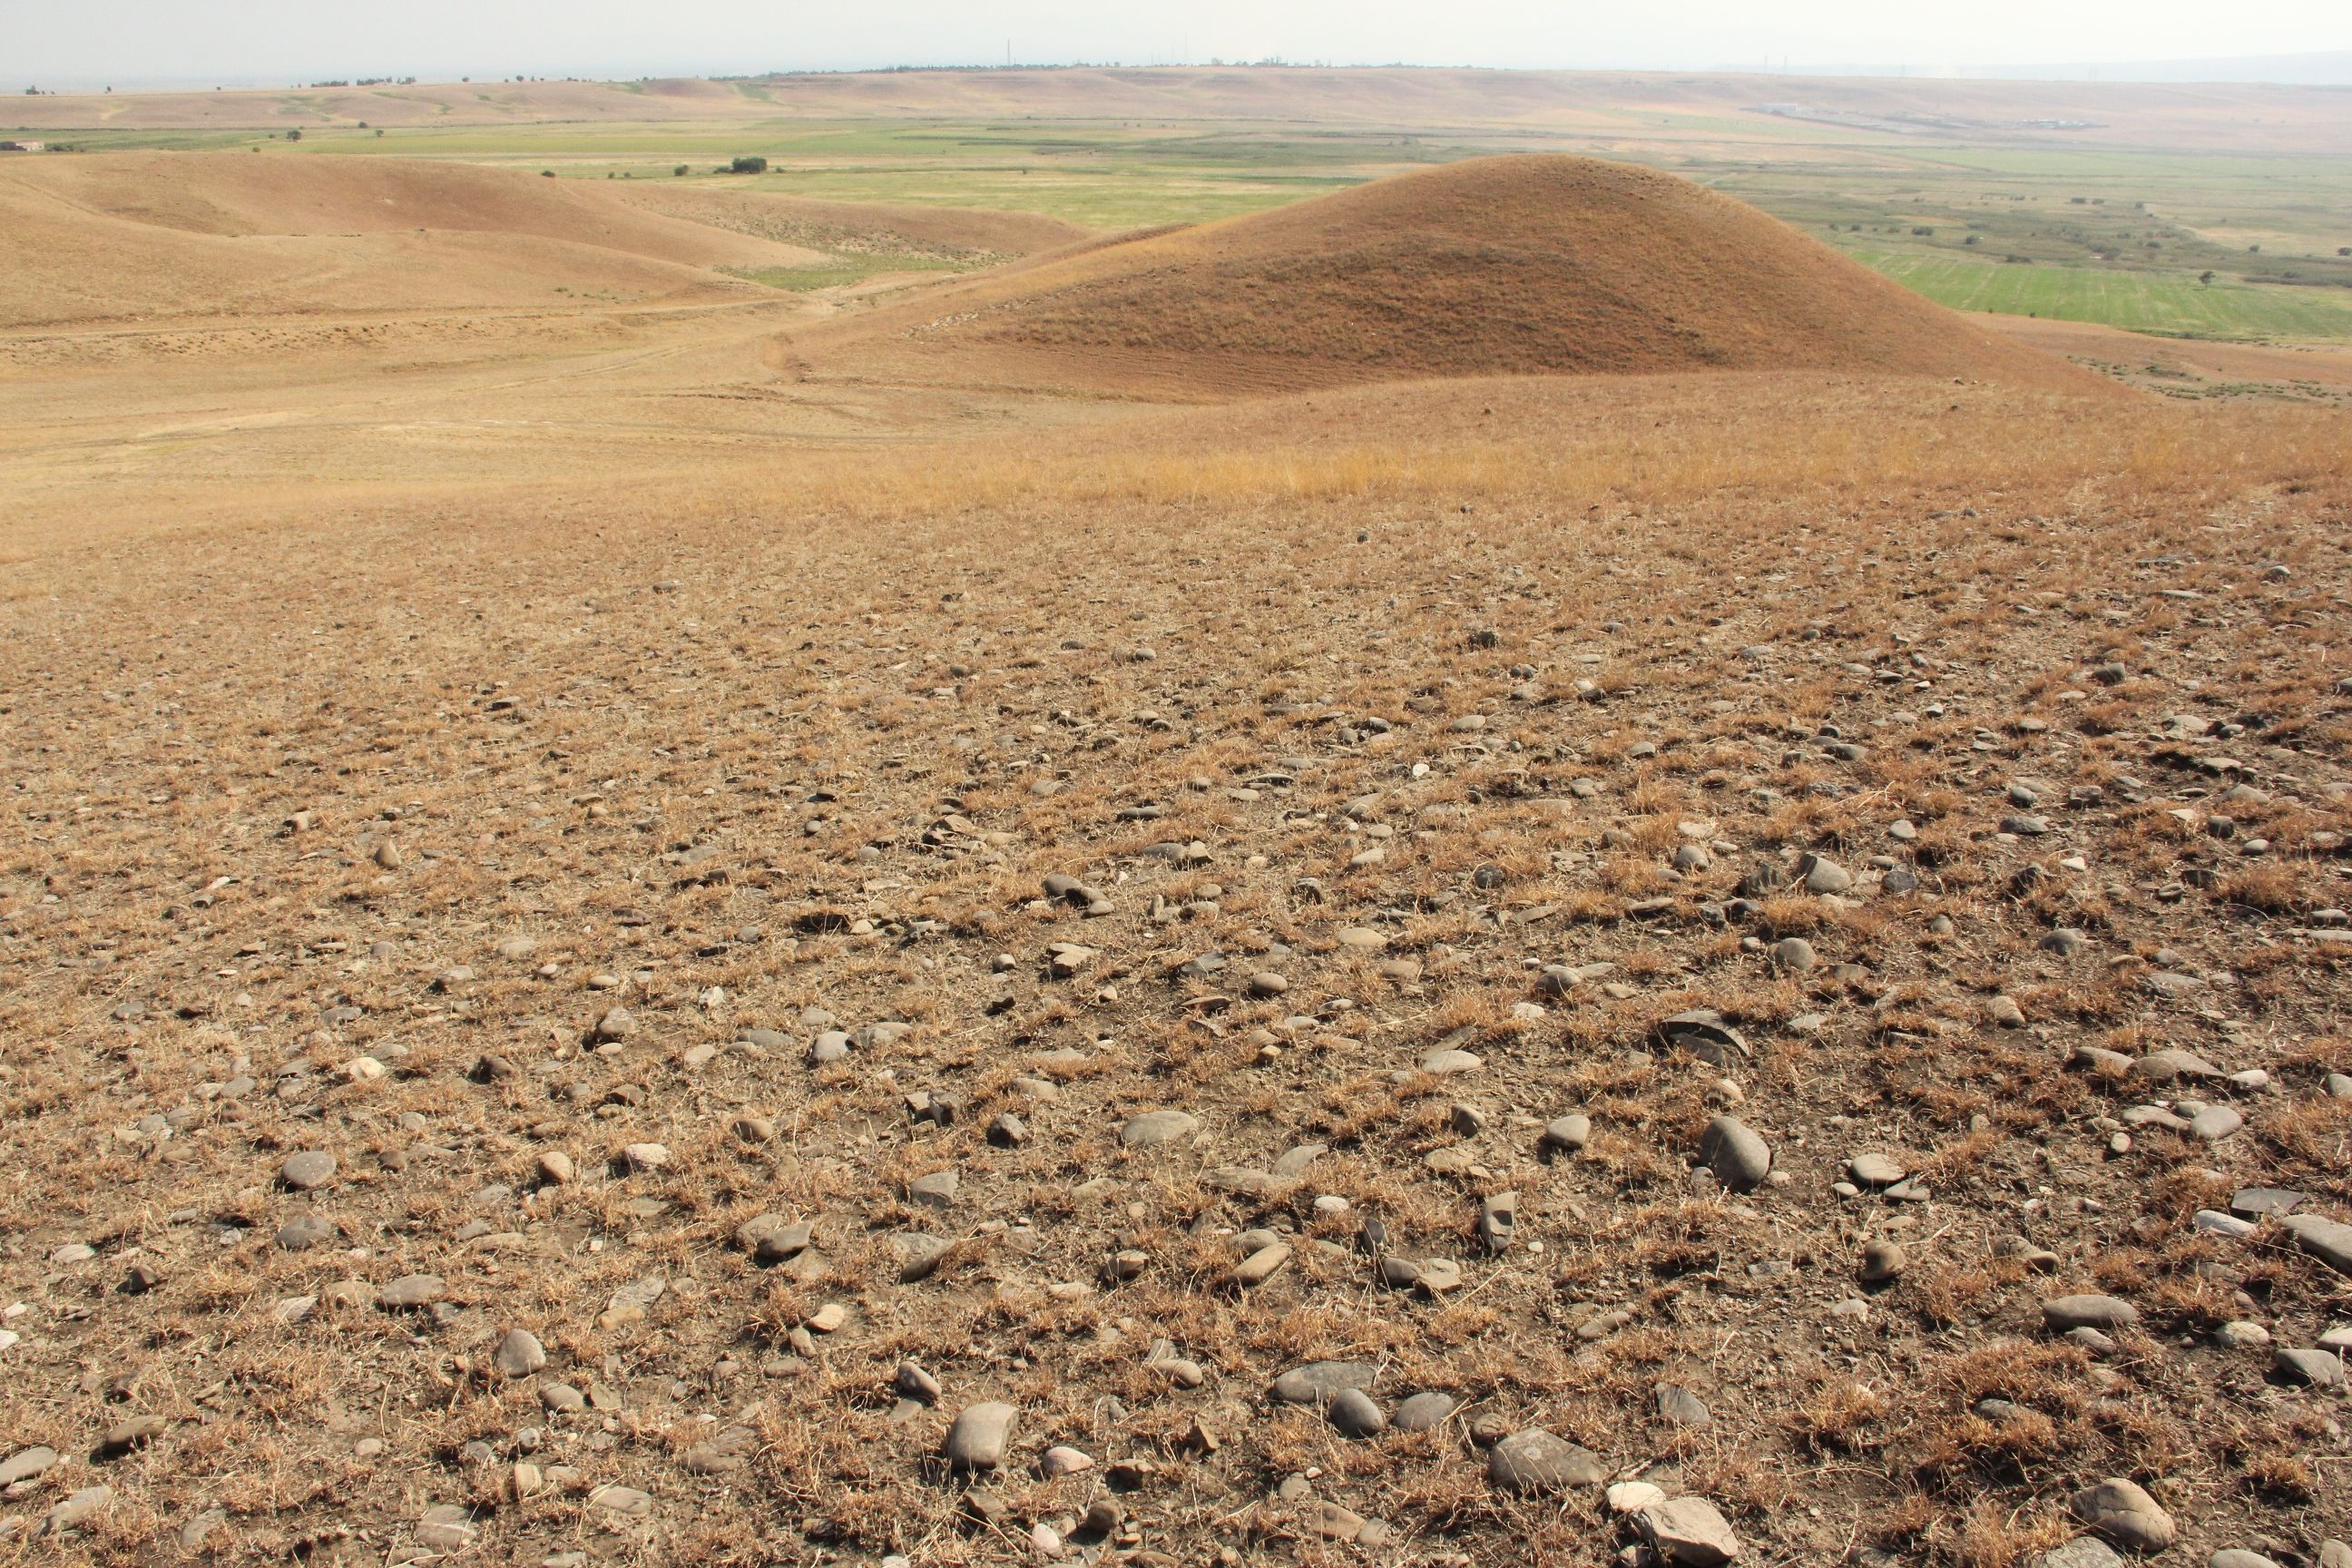
To effectively set up counter measures to combat land degradation it is important to have detailed spatial information on land cover and land cover changes as well as on trends in degradation (like size of areas effected by erosion). Therefore a remote sensing toolset was developed and tested in the pilot are of Tusheti protected landscapes in the High Caucasus in Georgia. This region shows increasing soil erosion problems by uneven distribution of grazing activities and was selected for developing erosion control measures within the Integrated Biodiversity Management in the South Caucasus Program (IBiS) funded by the Deutsche Gesellschaft für internationale Zusammenarbeit (GIZ).
Sensitivity Model
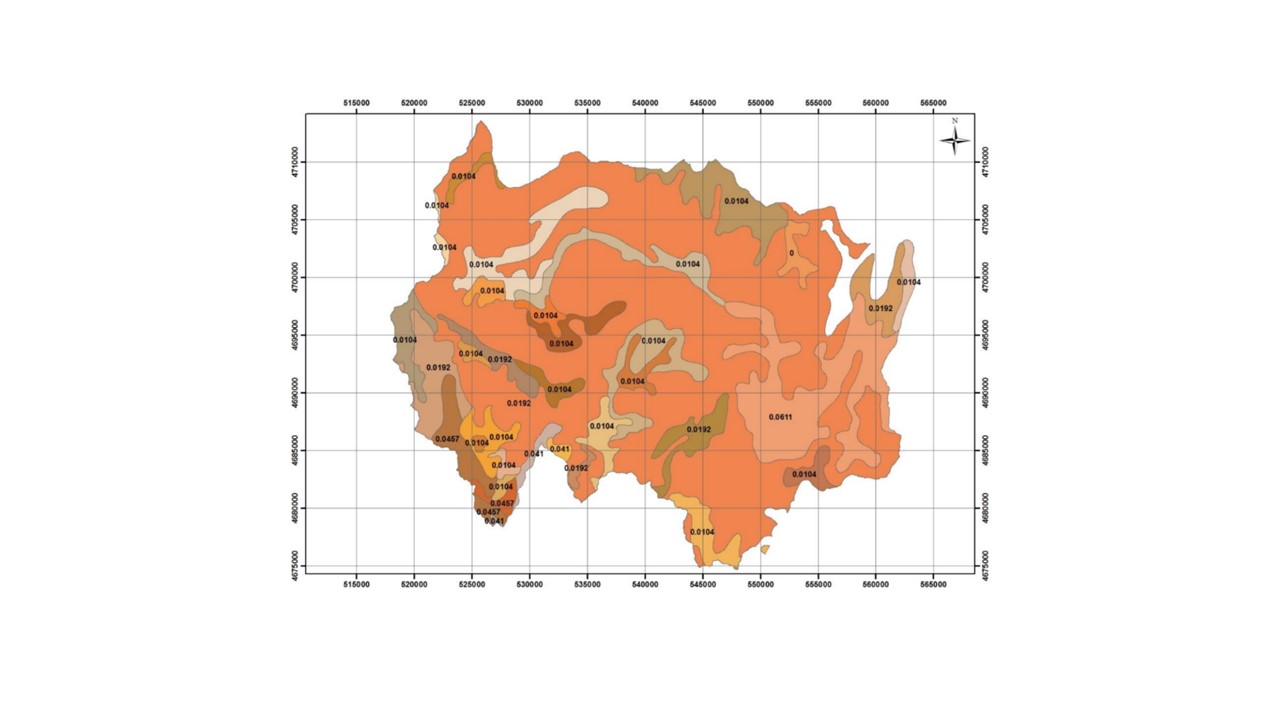
The Integrated Biodiversity Management in the South Caucasus (IBiS) project in cooperation with national experts in Georgia, developed and applied a remote sensing toolset called "Erosion Sensitivity Model". This remote sensing toolset helps to assess the current state and the general erosion risk. The sensitivity model is based on the RUSLE – Revised Universal Soil Loss Equation. The tool allows the calculation of erosion caused by rainfall and surface run-off. The RUSLE equation incorporates a combination of different input factors such as precipitation (R), soil type (K), slope (LS), vegetation cover (C) and protection measures (P). In this way, the estimated average soil loss in tonnes per acre per year (A) can be calculated as follows: A = R * K * LS * C * P.
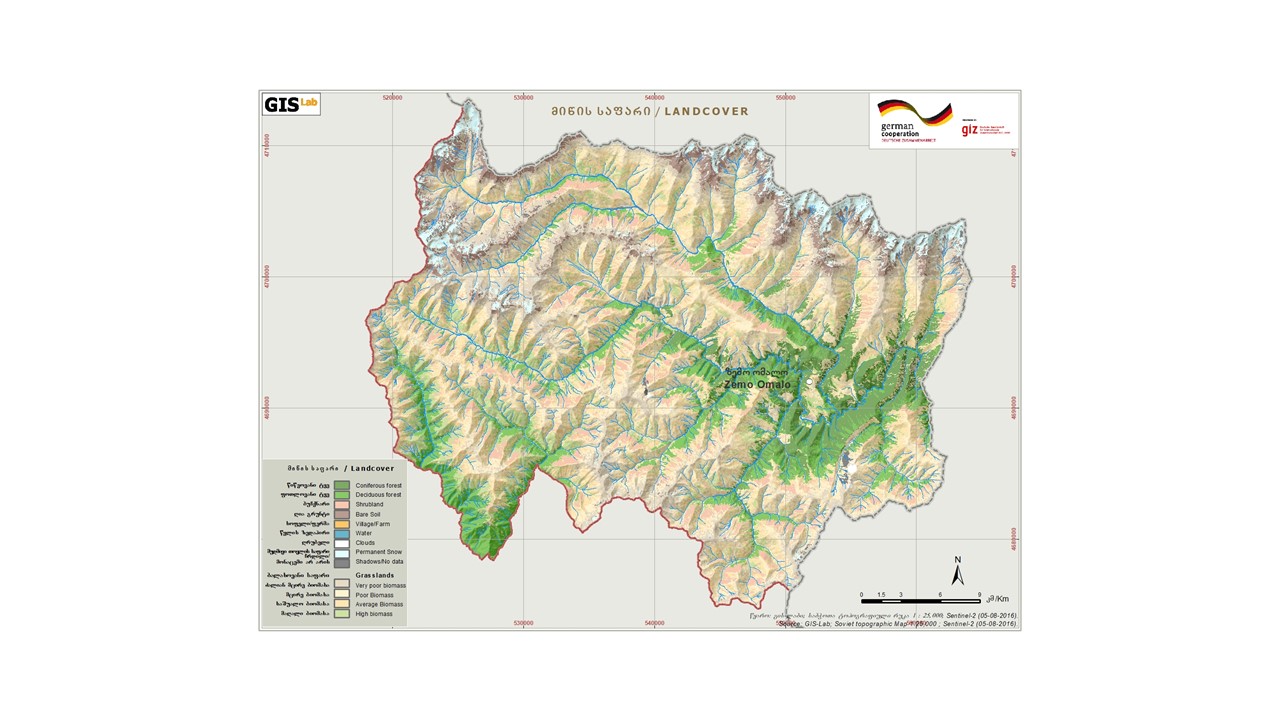
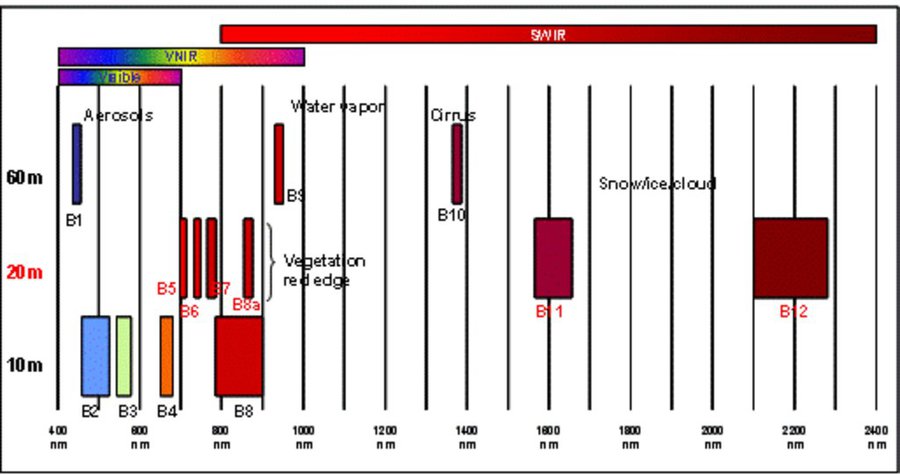
The rainfall factor (R) results from a quotient from the monthly and annual mean value of precipitation. The data come from the data platform “CHELSA – Climatologies at high resolution for the earth’s land surface areas”. For the soil type factor (K), a soil map of 1:200,000 was taken. Then, depending on the soil type, different contents of sand, silt, loam and clay were used to calculate the K factor. The slope length and steepness factor (LS) is calculated from a digital elevation model (DEM) with a raster resolution of 10x10m. The DEM is derived from the topographic map 1:25,000. The global elevation model derived from SRTM data (Shuttle Radar Topography Mission) has a resolution of 30x30 m and is available worldwide free of charge. The land cover factor (C) describes the vegetation cover that protects the soil from erosion. The vegetation cover slows down the speed of the raindrops and reduces the erosive effect of the rain. It slows down surface water runoff and stabilises the soil through root systems. The main indicators, land cover and productivity, can be assessed by remote sensing. The data from satellites need to be classified and calibrated by field data (ground truthing). The technology for the assessment of these indicators with Sentinel 2 satellite images was developed and applied in 2016 to 2018 in the Tusheti region (Akhmeta municipality) in the framework of the GIZ-IBiS project. Based on spectral information from airborne or satellite images, the density of the vegetation was calculated and mapped. There are well developed vegetation indices and classification systems to derive different land cover types and vegetation densities (mainly described by the Leaf Area Index LAI or biomass indices). The LAI is the area of the leaf surface (in square meters) per square meter ground surface. Since the real surface area of the leaves is hardly measurable, the amount of biomass is a proxy for the LAI. The P-factor is rarely considered in large-scale modelling of soil erosion risk as it is difficult to estimate it with very high accuracy. Therefore, to refine the model, a more detailed DEM (digital elevation model) is required (e.g., from satellite images). Based on the input factors, a soil erosion risk map was calculated for the whole territory of the Tusheti Protected Areas (113,660 ha). Based on the different spectral bands of the Sentinel 2 satellite image, a land cover map was calculated using the Support Vector Machine (SVM) technology and spectral image information.
The results have been integrated in the development of pasture management plans ("pasture passports"). This maps and documents are indicating areas of high erosion risk that need to be excluded from grazing and the maximum number of livestock has been calculated based on the biomass maps and will be integrated into the lease contracts.
The repetition of the remote sensing after some years (e.g. 5 years) will help to evaluate, if the measures in the pasture management have been successful to stop the degradation processes.
2.3 Fotografías de la Tecnología
Galería de medios
2.5 País/ región/ lugares donde la Tecnología fue aplicada y que se hallan comprendidos por esta evaluación
País:
Georgia
Región/ Estado/ Provincia:
Tusheti region, Akhmeta municipality
Especifique la difusión de la Tecnología:
- distribuida parejamente sobre un área
Si la Tecnología se halla difundida homogéneamente a lo largo de un área, especifique el área que cubre (en km2):
1000,0
¿El/los sitio(s) de la Tecnología se ubica(n) en un área de protección permanente?
Sí
Si fuera el caso, especifique :
The area is in the Tusheti Protected Areas (Tusheti Strict Nature Reserve, Tusheti National Park, Tusheti Protected Landscape).
Comentarios:
The whole territory was analysed by remote sensing and field records for calibration were collected on sample plots from different places in Tusheti.
Map
×2.6 Fecha de la implementación
Indique año de implementación:
2016
2.7 Introducción de la Tecnología
Especifique cómo se introdujo la Tecnología:
- mediante proyectos/ intervenciones externas
3. Clasificación de la Tecnología MST
3.1 Propósito(s) principal(es) de la Tecnología MST
- mejorar la producción
- reducir, prevenir, restaurar la degradación del suelo
- preservar/ mejorar biodiversidad
- provide information to make a spatial-territorial planning
3.2 Tipo(s) actuales de uso de la tierra donde se aplica la Tecnología
Mezcla de tipos de uso de tierras dentro de la misma unidad de tierras: :
Sí
Especifique el uso combinado de tierras (cultivos/ pastoreo/ árboles):
- Agropastoralismo (incluyendo cultivo-ganado integrados)

Tierras cultivadas
- Cosecha anual
Cosechas anuales - Especifique cultivos:
- cereales - cebada
- cultivos de raíces/ tubérculos - patatas
Número de temporadas de cultivo por año:
- 1
¿Se practica el intercultivo?
No
¿Se practica la rotación de cultivos?
No

Tierra de pastoreo
Pastoreo extenso:
- Pastoralismo trashumante
Tipo de animal:
- cattle - dairy and beef (e.g. zebu)
- ovejas
¿Se practica el manejo integrado de cultivos - ganado?
No
3.3 ¿Cambió el uso de tierras debido a la implementación de la Tecnología?
¿Cambió el uso de tierras debido a la implementación de la Tecnología?
- No (Continúe con la pregunta 3.4)
3.4 Provisión de agua
otra (ej. post-inundación):
- rainfed and mixed rained-irrigation
3.5 Grupo MST al que pertenece la Tecnología
- pastoralismo y manejo de tierras de pastoreo
- cobertura de suelo/ vegetal mejorada
3.6 Medidas MST que componen la Tecnología

medidas de manejo
- M2: Cambio de gestión/ nivel de intensidad

otras medidas
Especifique:
It is a monitoring technology to evaluate land management activities.
Comentarios:
On some pilot plots technologies to control erosion and stop land degradation have been tested. This includes fencing, rotational pasture management, mulching and installing check dams to stop gully erosion.
3.7 Principales tipos de degradación del suelo encarados con la Tecnología

erosión de suelos por agua
- Wt: pérdida de capa arable/ erosión de la superficie
- Wg: erosión en cárcavas

deterioro físico del suelo
- Pc: compactación

degradación biológica
- Bc: reducción de la cobertura vegetal del suelo
- Bq: reducción de la cantidad/ biomasa
Comentarios:
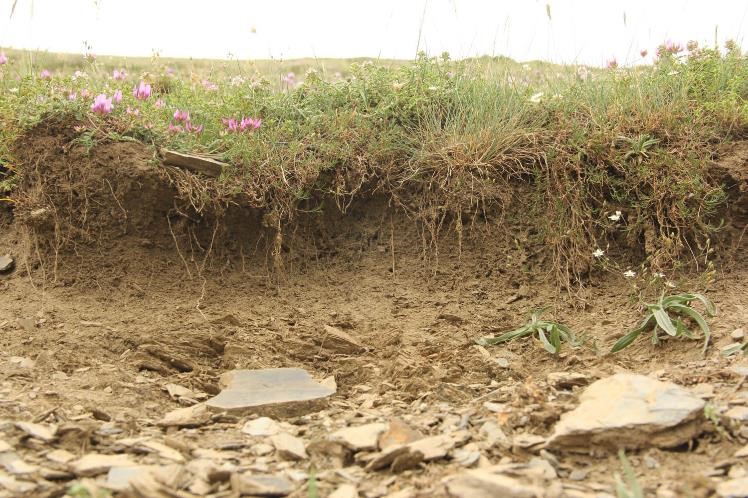
The main drivers of land degradation in the pilot area are overgrazing and trampling, off-road driving as well as infrastructure development (especially inappropriate road construction in steep slopes).
3.8 Prevención, reducción o restauración de la degradación del suelo
Especifique la meta de la Tecnología con relación a la degradación de la tierra:
- prevenir la degradación del suelo
- reducir la degradación del suelo
Comentarios:
The monitoring tools presented here help to monitor the development of land degradation and to evaluate measures and development trends.
4. Especificaciones técnicas, actividades de implementación, insumos y costos
4.1 Dibujo técnico de la Tecnología
Especificaciones técnicas (relacionadas al dibujo técnico):
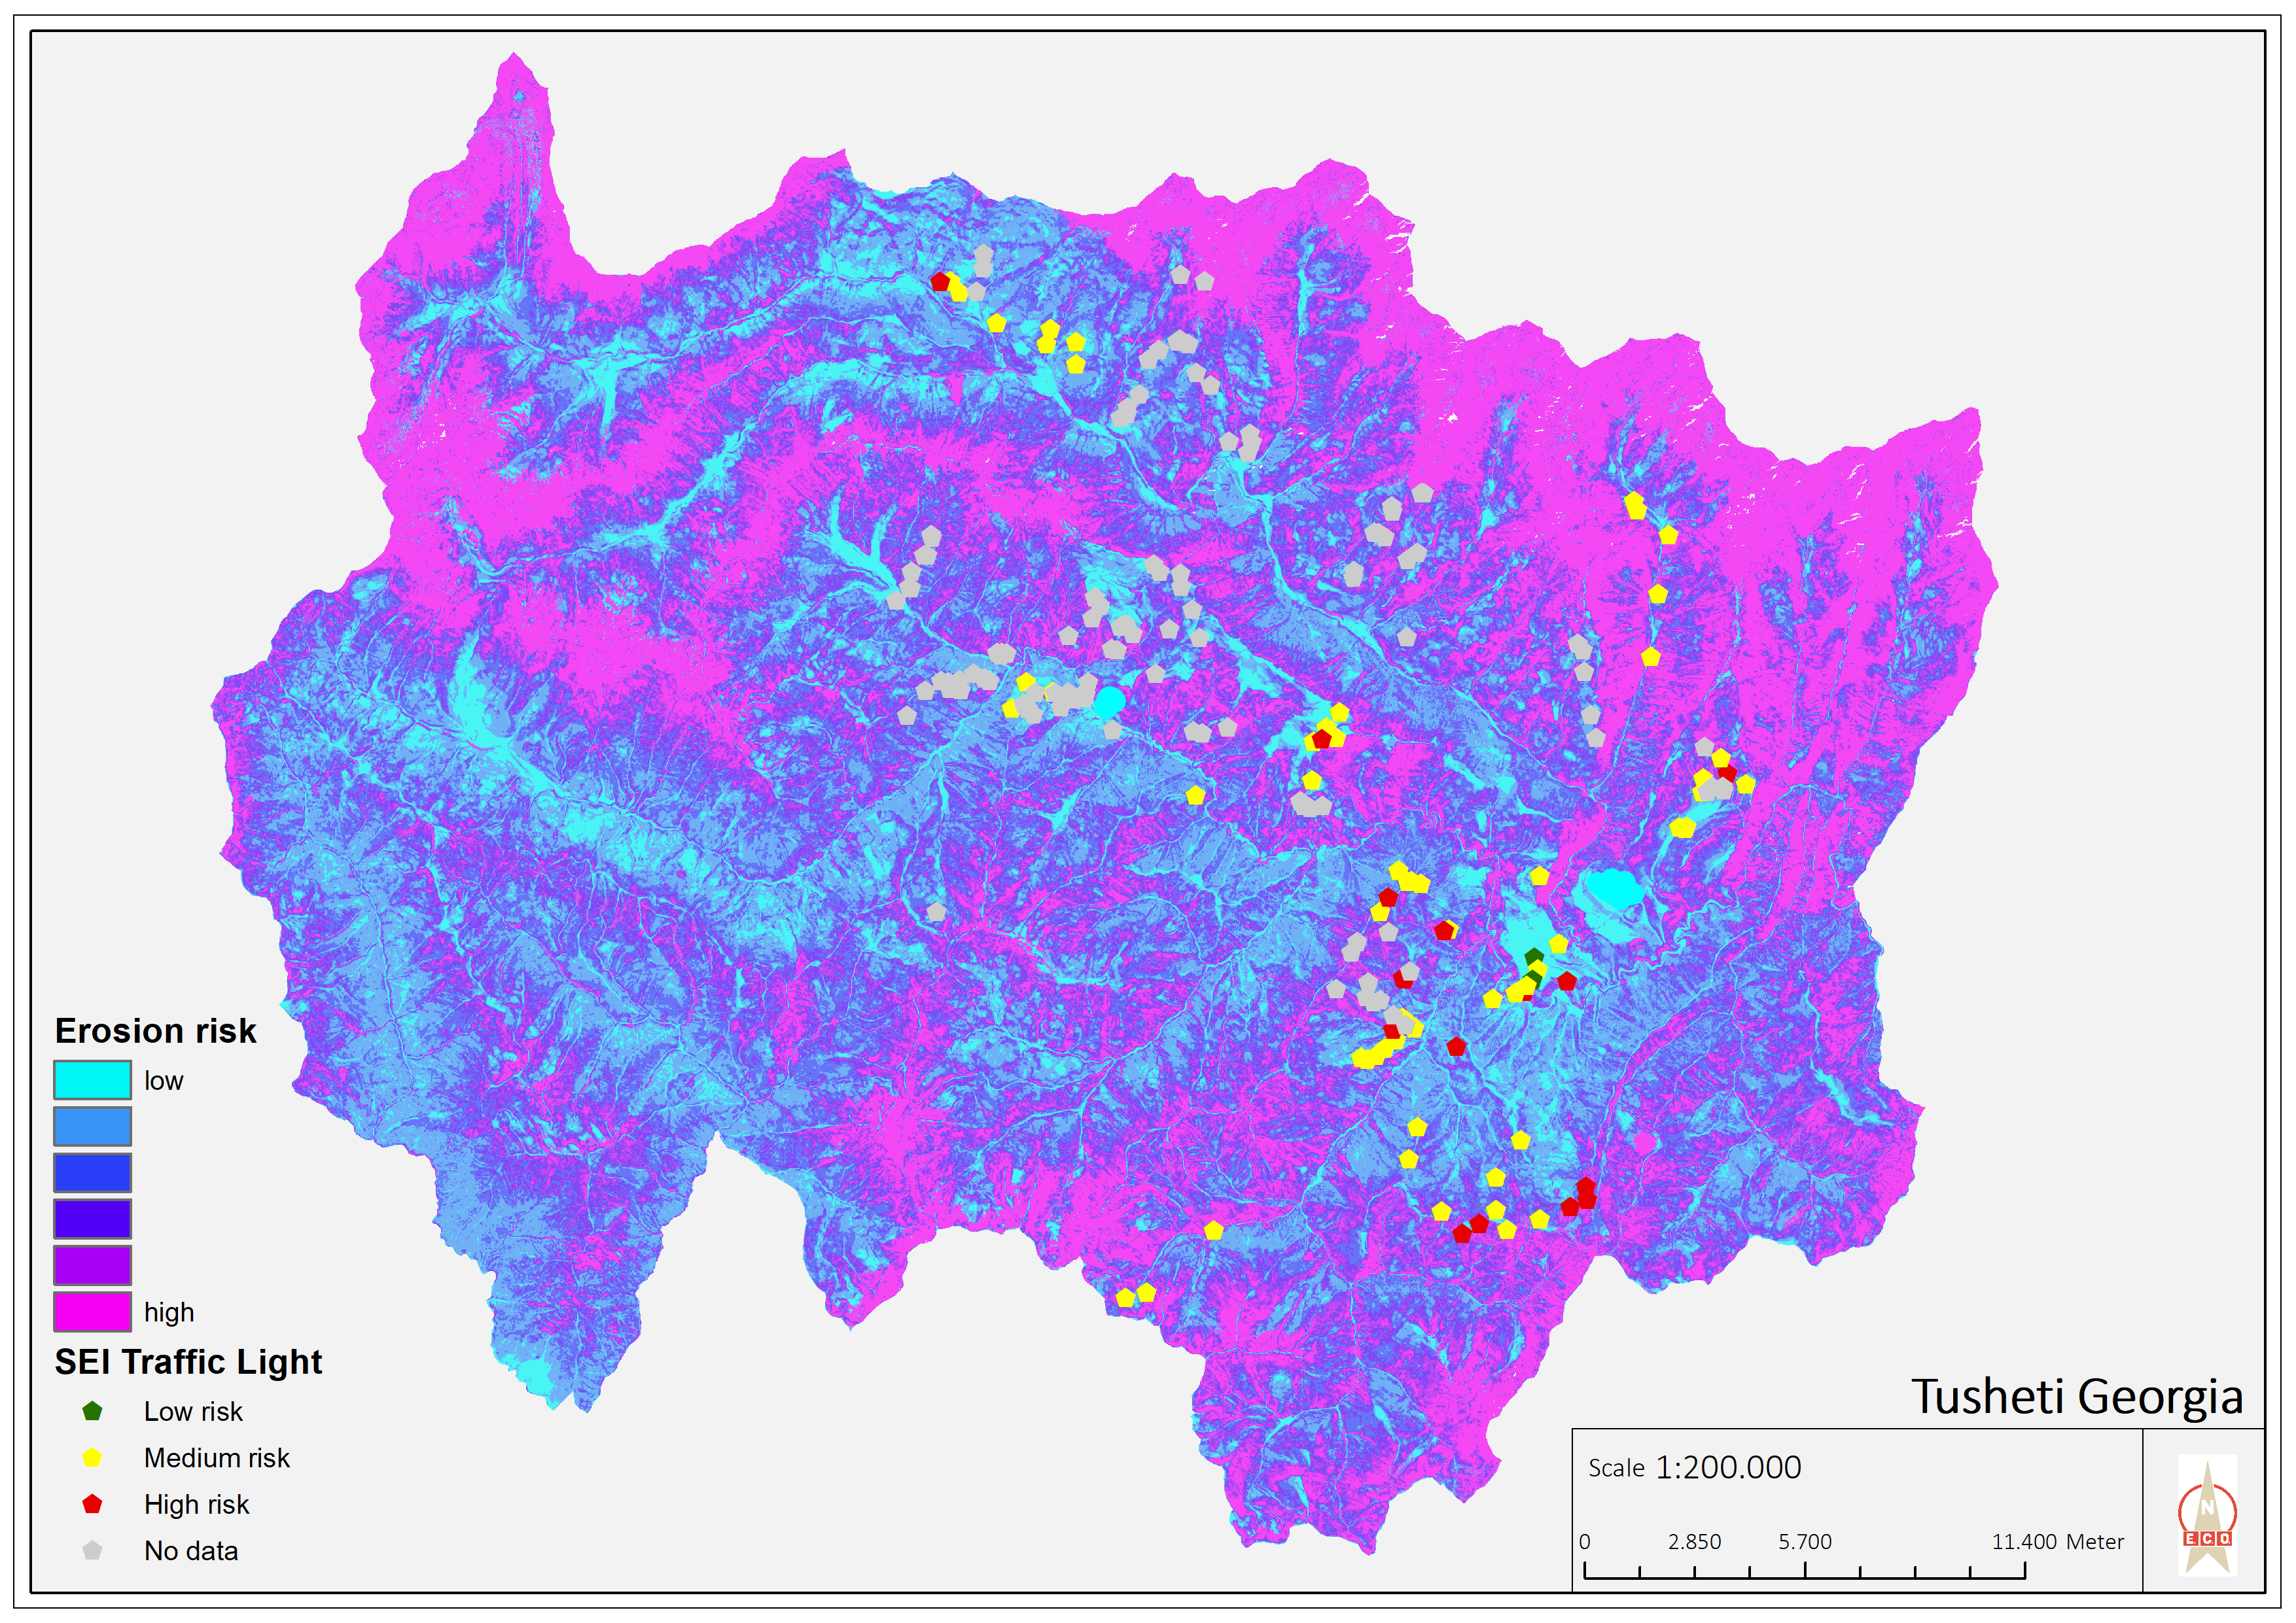
Map of erosion hot spots (pink colour) and the location of field sample plots for evaluation and ground truthing.
Autor:
Hanns Kirchmeir
Fecha:
11/09/2019
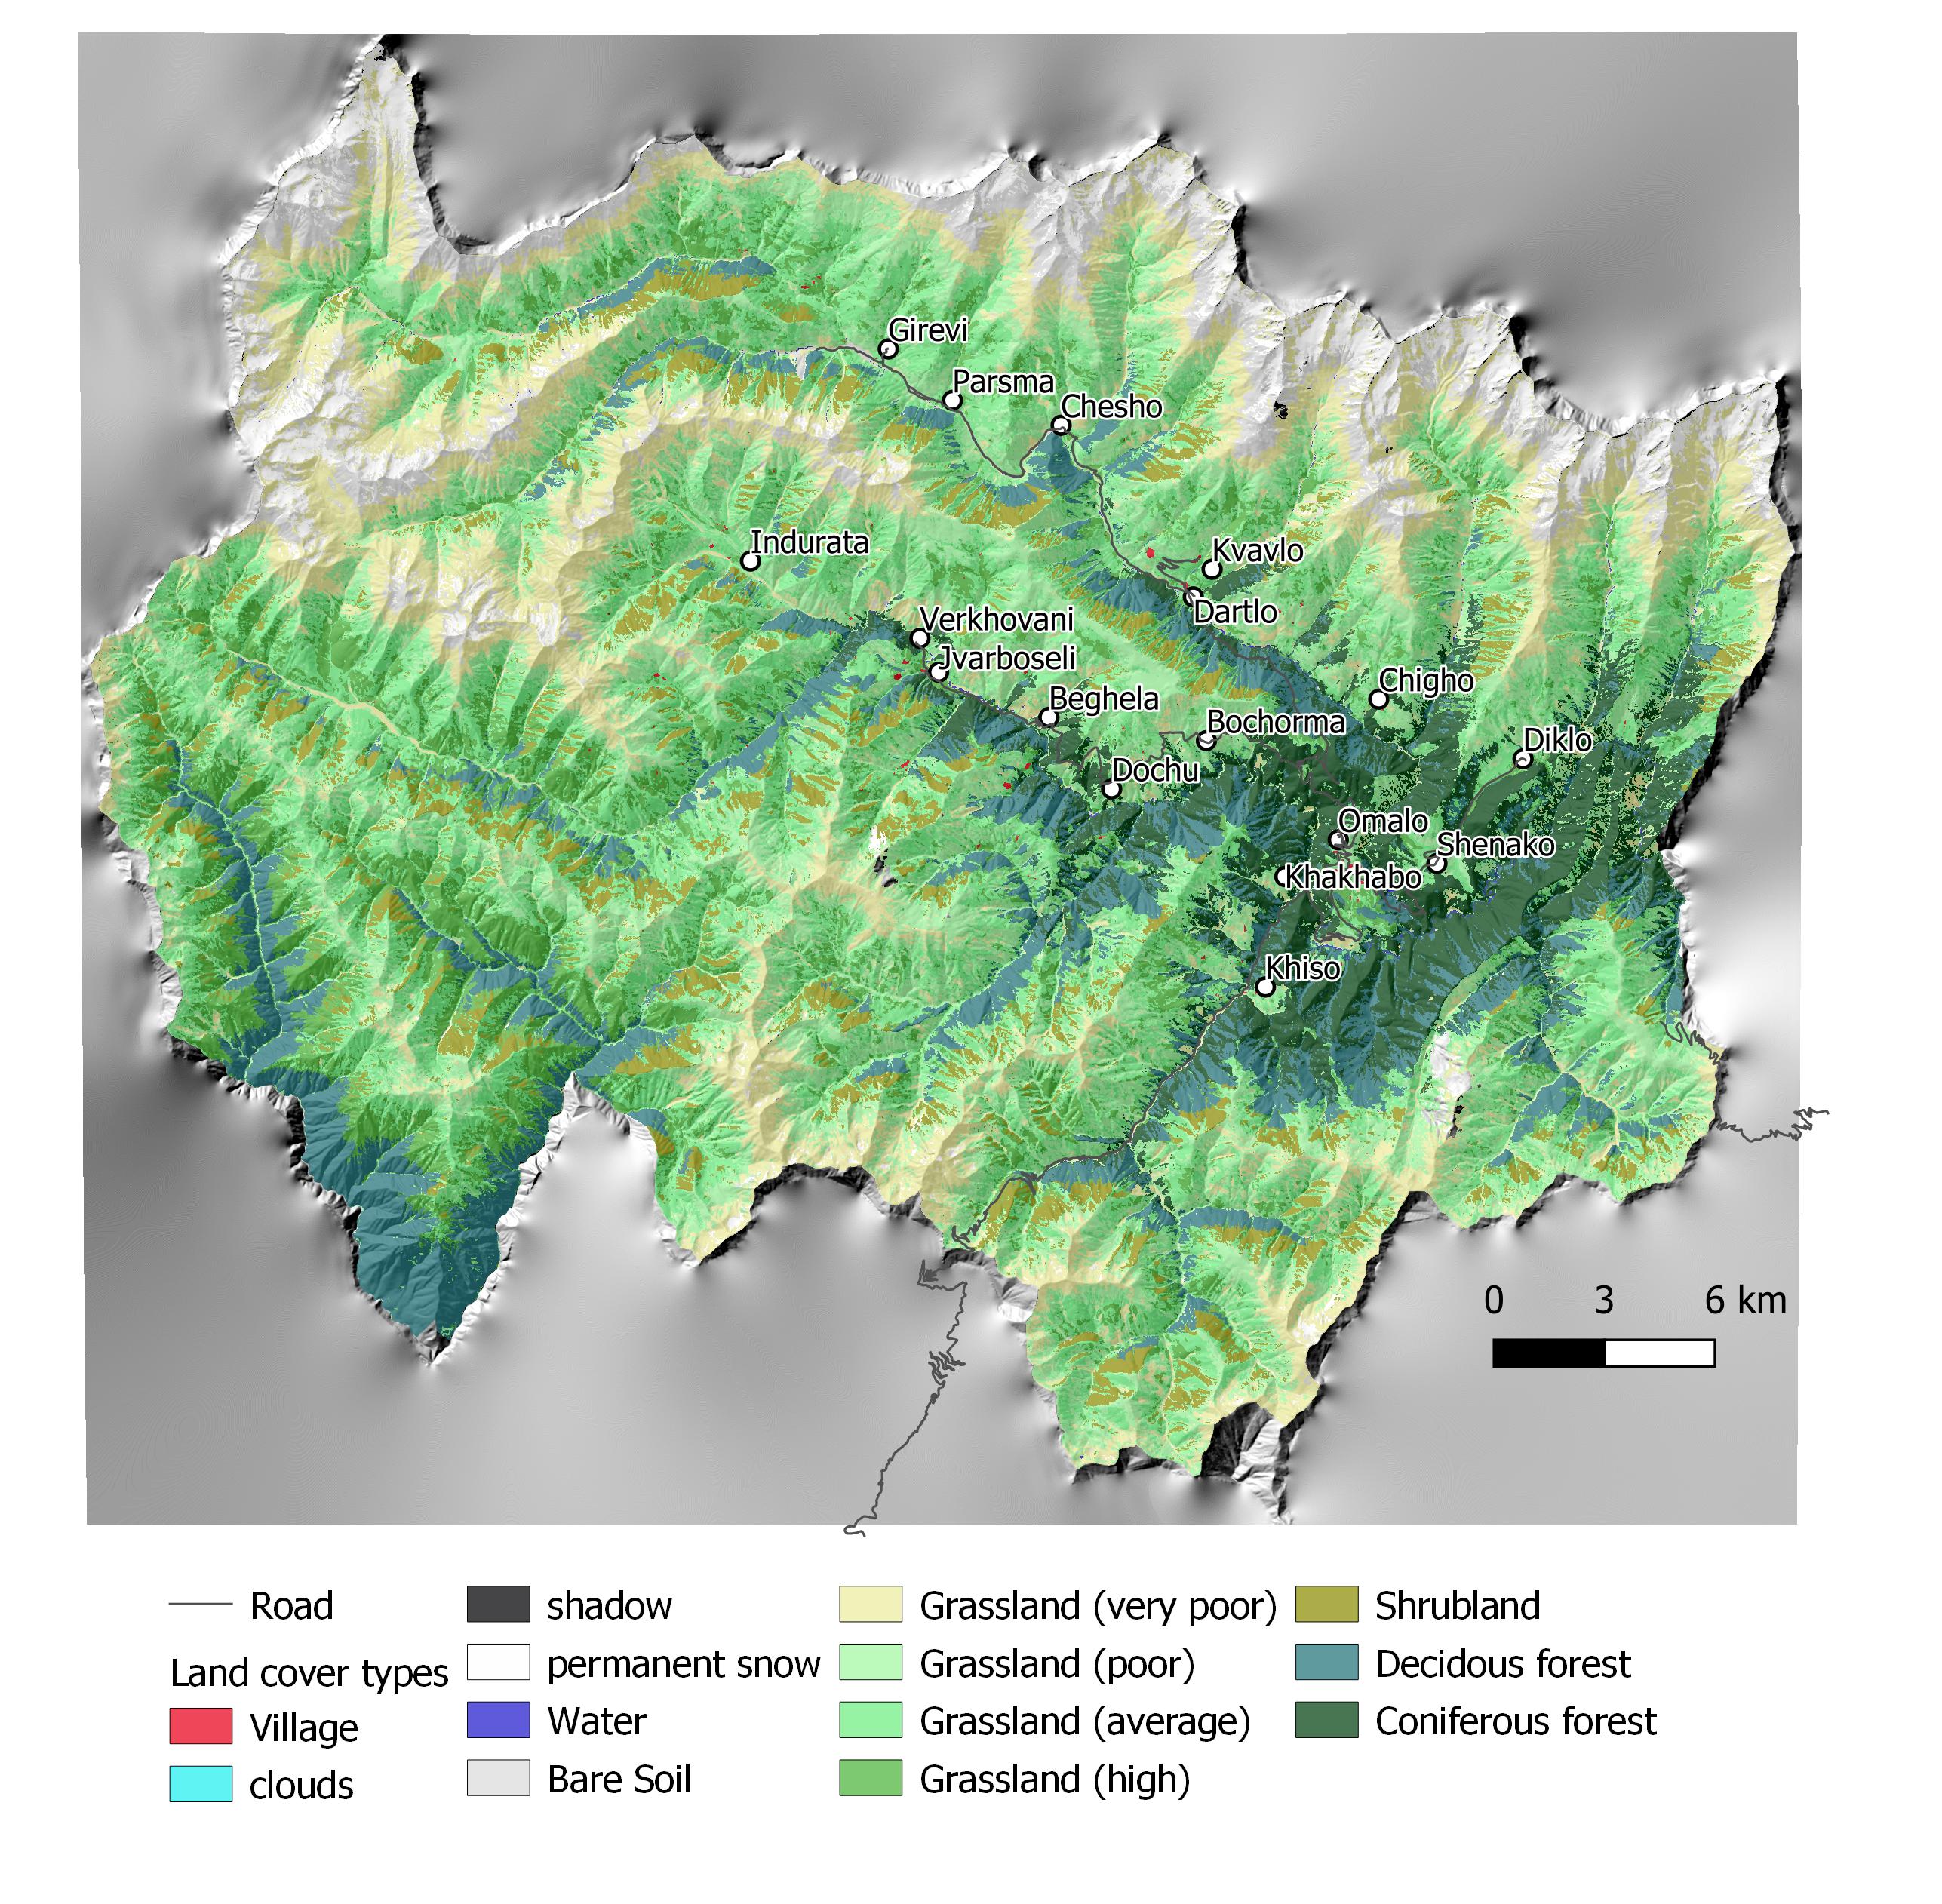
Especificaciones técnicas (relacionadas al dibujo técnico):
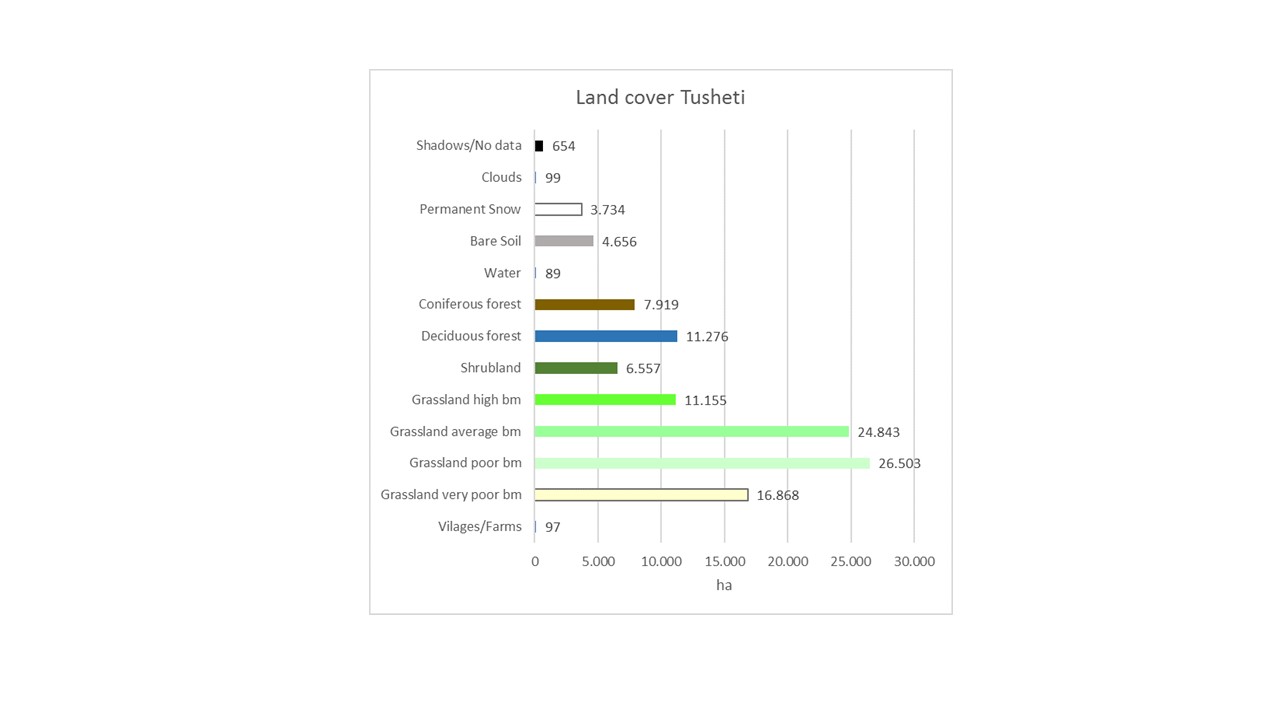
Map of land cover classification derived from satellite images. The different grassland types are classified by their biomass as an indicator of productivity and current state. Repeating the satellite image classification with the same parameters after 5 or 10 years can give a clear picture of changes in the land cover.
Autor:
Hanns Kirchmeir
Fecha:
11/09/2019
4.2 Información general sobre el cálculo de insumos y costos
Especifique cómo se calcularon los costos e insumos:
- por área de Tecnología
Indique tamaño y unidad de área:
1000 km2
Especifique la moneda usada para calcular costos:
- USD
Indique el costo promedio del salario de trabajo contratado por día:
100
4.3 Actividades de establecimiento
| Actividad | Momento (estación) | |
|---|---|---|
| 1. | National level. Baseline: Field assessment for remote sensing calibration (1x/20 years) | 2017 |
| 2. | Sentinel satellite image classification (multi temporal data from 2017) | 2017 |
| 3. | Statistical data from GEOSTAT Agricultural census | 2014-2016 |
| 4. | Analysis of soil carbon content from existing profiles | 2003 - 2006 |
| 5. | Conduct ongoing monitoring | 5 years intervals |
| 6. | Update sentinel satellite image classification | 1x year |
| 7. | Update statistical data from GEOSTAT Agricultural census | 4x/year |
| 8. | Resampling of soil carbon content near existing profiles | 1x/5 years |
| 9. | Municipal level. Spatial planning: Assessment of current stage of land degradation, anticipated gains and losses | 1x/10 years |
| 10. | Revision of spatial planning on Municipal level. | 1x / 5 years |
4.4 Costos e insumos necesarios para el establecimiento
| Especifique insumo | Unidad | Cantidad | Costos por unidad | Costos totales por insumo | % de los costos cubiertos por los usuarios de las tierras | |
|---|---|---|---|---|---|---|
| Mano de obra | Remote Sensing analysis by Sentinel Satellite data | person days | 50,0 | 200,0 | 10000,0 | |
| Mano de obra | Collecting field data for satellite image callibration | person days | 40,0 | 200,0 | 8000,0 | |
| Mano de obra | Soil sampling (for carbon content) | person days | 20,0 | 200,0 | 4000,0 | |
| Mano de obra | Including results in spatial planning | person days | 10,0 | 200,0 | 2000,0 | |
| Costos totales para establecer la Tecnología | 24000,0 | |||||
| Costos totales para establecer la Tecnología en USD | 24000,0 | |||||
Comentarios:
This covers the implementation of the baseline. Calibrating the model for erosion risk and land cover classification is an big investment but can be extended to larger areas than 1000 km² with similar resources.
4.5 Actividades de establecimiento/ recurrentes
| Actividad | Momento/ frequencia | |
|---|---|---|
| 1. | Repeating the application of the calibrated remote sensing model for monitoring repitition | with 5 years interval |
| 2. | Repetition of soil samples for assessing soil carbon content | with 5 years interval |
| 3. | Analysing the results and integrate them in spatial planning and policy making | with 5 years interval |
4.6 Costos e insumos necesarios para actividades de mantenimiento/ recurrentes (por año)
| Especifique insumo | Unidad | Cantidad | Costos por unidad | Costos totales por insumo | % de los costos cubiertos por los usuarios de las tierras | |
|---|---|---|---|---|---|---|
| Mano de obra | Applying the calibrated remote sensing model for monitoring repetition | person days | 20,0 | 200,0 | 4000,0 | |
| Mano de obra | Repetition of soil samples for assessing soil carbon content | person days | 10,0 | 200,0 | 2000,0 | |
| Mano de obra | Analysing results and integrating in spatial planning | person days | 10,0 | 200,0 | 2000,0 | |
| Indique los costos totales para mantenecer la Tecnología | 8000,0 | |||||
| Costos totales para mantener la Tecnología en USD | 8000,0 | |||||
Comentarios:
For the repetition of the remote sensing no new calibration of the GIS-model is needed. Only the field samples for soil carbon need to be repeated.
4.7 Factores más determinantes que afectan los costos:
Describa los factores más determinantes que afectan los costos:
Field sample collection;
Remote sensing experts.
5. Entorno natural y humano
5.1 Clima
Lluvia anual
- < 250 mm
- 251-500 mm
- 501-750 mm
- 751-1,000 mm
- 1,001-1,500 mm
- 1,501-2,000 mm
- 2,001-3,000 mm
- 3,001-4,000 mm
- > 4,000 mm
Especifique el promedio anual de lluvia (si lo conoce), en mm:
800,00
Especificaciones/ comentarios sobre la cantidad de lluvia:
The climate is generally suitable for agriculture with an annual precipitation of up to 800 mm, with hot and humid springs, rainfall peaks in May and June with hot and dry summers.
Zona agroclimática
- Sub-húmeda
- semi-árida
5.2 Topografía
Pendientes en promedio:
- plana (0-2 %)
- ligera (3-5%)
- moderada (6-10%)
- ondulada (11-15%)
- accidentada (16-30%)
- empinada (31-60%)
- muy empinada (>60%)
Formaciones telúricas:
- meseta/ planicies
- cordilleras
- laderas montañosas
- laderas de cerro
- pies de monte
- fondo del valle
Zona altitudinal:
- 0-100 m s.n.m.
- 101-500 m s.n.m.
- 501-1,000 m s.n.m
- 1,001-1,500 m s.n.m
- 1,501-2,000 m s.n.m
- 2,001-2,500 m s.n.m
- 2,501-3,000 m s.n.m
- 3,001-4,000 m s.n.m
- > 4,000 m s.n.m
Indique si la Tecnología se aplica específicamente en:
- no relevante
Comentarios y especificaciones adicionales sobre topografía :
The remote sensing approach was applied for the total landscape of Tusheti, including a great variety of land-forms, altitudes ranging from 1600-4000 m a.s.l.
5.3 Suelos
Profundidad promedio del suelo:
- muy superficial (0-20 cm)
- superficial (21-50 cm)
- moderadamente profunda (51-80 cm)
- profunda (81-120 cm)
- muy profunda (>120 cm)
Textura del suelo (capa arable):
- mediana (limosa)
Textura del suelo (> 20 cm debajo de la superficie):
- mediana (limosa)
Materia orgánica de capa arable:
- media (1-3%)
5.4 Disponibilidad y calidad de agua
Agua subterránea:
en superficie
Disponibilidad de aguas superficiales:
mediana
Calidad de agua (sin tratar):
agua potable de mala calidad (requiere tratamiento)
La calidad de agua se refiere a:
agua subterránea y superficial
¿La salinidad del agua es un problema?
No
¿Se está llevando a cabo la inundación del área? :
No
5.5 Biodiversidad
Diversidad de especies:
- mediana
Diversidad de hábitats:
- elevada
5.6 Las características de los usuarios de la tierra que aplican la Tecnología
Sedentario o nómada:
- Semi-nómada
Orientación del mercado del sistema de producción:
- mixta (subsistencia/ comercial)
Ingresos no agrarios:
- menos del 10% de todos los ingresos
Nivel relativo de riqueza:
- pobre
Individuos o grupos:
- individual/ doméstico
Nivel de mecanización:
- trabajo manual
- tracción animal
Género:
- mujeres
- hombres
Edad de los usuarios de la tierra:
- personas de mediana edad
Indique otras características relevantes de los usuarios de las tierras:
The technology is applied by the Government.
5.7 Área promedio de la tierra usada por usuarios de tierra que aplican la Tecnología
- < 0.5 ha
- 0.5-1 ha
- 1-2 ha
- 2-5 ha
- 5-15 ha
- 15-50 ha
- 50-100 ha
- 100-500 ha
- 500-1,000 ha
- 1,000-10,000 ha
- > 10,000 ha
¿Esto se considera de pequeña, mediana o gran escala (refiriéndose al contexto local)?
- escala mediana
Comentarios:
The pasture units are fom 200 to 600 hectares and are based on the old Soviet grazing scheme.
5.8 Tenencia de tierra, uso de tierra y derechos de uso de agua
Tenencia de tierra:
- estado
Derechos de uso de tierra:
- comunitarios (organizado)
- arrendamiento
Derechos de uso de agua:
- acceso abierto (no organizado)
¿Los derechos del uso de la tierra se basan en un sistema legal tradicional?
No
5.9 Acceso a servicios e infraestructura
salud:
- pobre
- moderado
- bueno
educación:
- pobre
- moderado
- bueno
asistencia técnica:
- pobre
- moderado
- bueno
empleo (ej. fuera de la granja):
- pobre
- moderado
- bueno
mercados:
- pobre
- moderado
- bueno
energía:
- pobre
- moderado
- bueno
caminos y transporte:
- pobre
- moderado
- bueno
agua potable y saneamiento:
- pobre
- moderado
- bueno
servicios financieros:
- pobre
- moderado
- bueno
6. Impactos y comentarios para concluir
6.1 Impactos in situ demostrados por la Tecnología
Impactos ecológicos
Suelo
cubierta del suelo
Comentarios/ especifique:
Within the timeframe until 2030, specific process indicators to assess the progress will be done.
Otros impactos ecológicos
Changes in the quality of forests
Comentarios/ especifique:
tree height, stand density
Changes of the quality of pastures
Comentarios/ especifique:
biomass production
Changes in the quality of arable land
Comentarios/ especifique:
yield
Especifique la evaluación de los impactos en el sitio (mediciones):
The monitoring technology was applied for the first time to draw a baseline. Based on the results, activities have been planned and pilot measures have been implemented (exclusion from grazing, reforestation, regulation of grazing intensity). Future replications of the monitoring will show changes and evaluate success of measures. The technologies to control erosion are described separately in the WOCAT database (Community-based Erosion Control [Azerbaijan]; Pasture-weed control by thistle cutting [Georgia]; High-altitude afforestation for erosion control [Armenia]; Slope erosion control using wooden pile walls [Armenia])
6.2 Impactos fuera del sitio demostrados por la Tecnología
Especifique la evaluación de los impactos fuera del emplazamiento (medidas):
The technology is only about the monitoring (see above).
6.3 Exposición y sensibilidad de la Tecnología al cambio climático gradual y a extremos relacionados al clima/ desastres (desde la percepción de los usuarios de tierras)
Cambio climático gradual
Cambio climático gradual
| Estación | Incremento o reducción | ¿Cómo es que la tecnología soporta esto? | |
|---|---|---|---|
| lluvia estacional | verano | disminuyó | muy bien |
Comentarios:
Technology is sensitive, it shows the climate change, the impact of the global change locally. The technology itself is not affected by climatic changes.
6.4 Análisis costo-beneficio
¿Cómo se comparan los beneficios con los costos de establecimiento (desde la perspectiva de los usuarios de tierra)?
Ingresos a corto plazo:
neutral/ balanceado
Ingresos a largo plazo:
positivo
¿Cómo se comparan los beneficios con los costos de mantenimiento/ recurrentes (desde la perspectiva de los usuarios de tierra)?
Ingresos a corto plazo:
neutral/ balanceado
Ingresos a largo plazo:
ligeramente positivo
Comentarios:
The monitoring technology was applied for the first time to draw a baseline. Based on the results, activities have been planned and pilot measures have been implemented (exclusion from grazing, reforestation, regulation of grazing intensity). Future replications of the monitoring will show changes and evaluate success of measures. The technologies to control erosion are described separately in the WOCAT database (Community-based Erosion Control [Azerbaijan]; Pasture-weed control by thistle cutting [Georgia]; High-altitude afforestation for erosion control [Armenia]; Slope erosion control using wooden pile walls [Armenia]).
The costs of the remote sensing approach have not been invested by the land owners but by GIZ and the Ministry. Therefore there are no direct negative impact caused by the investment. The maintenance will be covered by public authorities as well. The positive impact for the land users are the clearly delineated pasture unit giving the exact area of grassland and the accessible amount of fodder biomass. By this, the lease-rate can be found according to the productivity and the number of livestock can be adapted to the carrying capacity of the land within the lease contract.
6.5 Adopción de la Tecnología
- casos individuales / experimentales
Si tiene la información disponible, cuantifique (número de hogares y/o área cubierta):
The technology is desigend to be applied by national or regional addministrations and not by land owners themselves.
6.6 Adaptación
¿La tecnología fue modificada recientemente para adaptarse a las condiciones cambiantes?
No
6.7 Fuerzas/ ventajas/ oportunidades de la Tecnología
| Fuerzas/ ventajas/ oportunidades desde la perspectiva del usuario de la tierra |
|---|
| The monitoring technology can help to find erosion and degradation hot spots and based on this spatial information counter measures can be applied to save the productivity of land. As the income from agricultural activities and livestock breeding is of high priority in this pilot region, the protection of the productivity of land is of high importance to the local land users. |
| Fuerzas/ ventajas/ oportunidades desde la perspectiva del compilador o de otra persona de referencia clave |
|---|
| The presented remote sensing technologies are a cost efficient and objective way to monitor land degradation and land use changes on large areas on long time periods. Based on this spatial data, land use regulations can be integrated in spatial planning and other legal and practical frameworks (e.g. pasture lease contracts) to counter act the degradation processes. The success of the measures and the development of degradation and rehabilitation can be monitored by the same toolset. |
6.8 Debilidades/ desventajas/ riesgos de la Tecnología y formas de sobreponerse a ellos
| Debilidades/ desventajas/ riesgos desde la perspectiva del usuario de la tierra | ¿Cómo sobreponerse a ellas? |
|---|---|
| The technology is complex and cannot be applied by the land user her-/himself and is sometimes hard to understand. Therefore they might mistrust in the results and are not eager to accept regulations and measures to stop degradation. | Transparent documentation of the technology and regular field visits to evaluate together with the land owners and users the remote sensing results in the field. |
| Debilidades/ desventajas/ riesgos desde la perspectiva del compilador o de otra persona de referencia clave | ¿Cómo sobreponerse a ellas? |
|---|---|
| The institutional setup on the national level for the regular application of the remote sensing technology and the storage and management of the monitoring data is not established yet. GIS, remote sensing and soil experts are of limited availability. | Institutional capacity building and academic training courses provided at the Georgian universities can help to overcome these limitations. |
| Field data for calibration of satellite images (biomass volumes, classified land cover types, soil types, land management types) with exact information on the spatial location are rare and costly to be created. | Such data and information should be organised and gathered on national level across different sectors (agriculture, forestry, spatial planing, nature conservation ...). This would help to reduce significantly the costs and remote sensing could be applied on much larger areas. |
7. Referencias y vínculos
7.1 Métodos/ fuentes de información
- visitas de campo, encuestas de campo
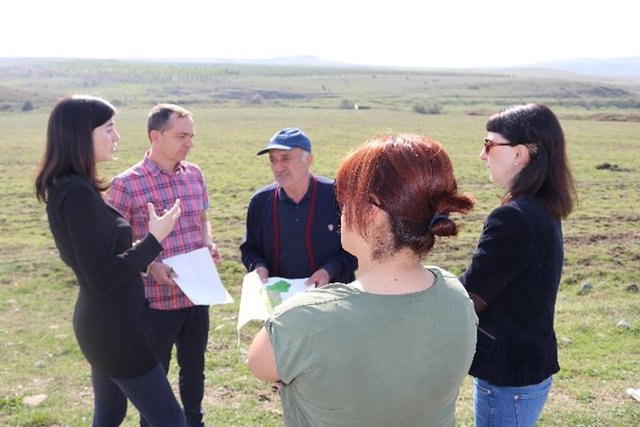
Three field visits with national and international experts as well as representatives of administrations and local stakeholders.
- entrevistas con usuarios de tierras
Meeting with cooperation partners, key village stakeholders from three pilot municipalities.
- entrevistas con especialistas/ expertos en MST
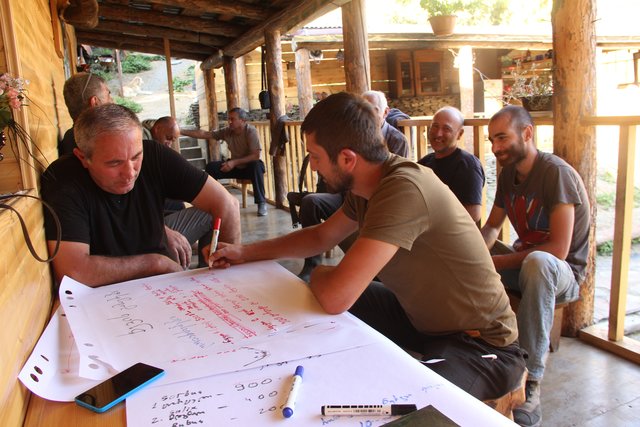
Three mission meetings with 35 experts.
- compilación de informes y otra documentación existente
Pilot project on land degradation neutrality in Georgia Final Report. 20.10.2017.
GISLab 2016: Development of Land Cover and Erosion Risk Map based on remote sensing for Tusheti Protected Areas. Study within the frame of GIZ-IBIS.
7.2 Vínculos a las publicaciones disponibles
Título, autor, año, ISBN:
Land Degradation Neutrality 25.10.2017
¿Dónde se halla disponible? ¿Costo?
https://e-c-o.at/files/publications/downloads/D00813_ECO_policy_brief_LDN_Georgia_171025.pdf
7.3 Vínculos a la información relevante disponible en línea
Título/ descripción:
Tools for satellite image analysis
URL:
http://step.esa.int/main/snap-2-0-out-now/
Título/ descripción:
UNCCD Good Practice Guidance on SDG Indicator 15.31. (Sims et al. 2017)
URL:
https://www.unccd.int/sites/default/files/relevant-links/2017-10/Good%20Practice%20Guidance_SDG%20Indicator%2015.3.1_Version%201.0.pdf
7.4 Comentarios generales
UNCCD Good Practice Guidance on SDG Indicator 15.31. (Sims et al. 2017) gives a detailed technical overview on methods and approaches to calculate LDN indicators by means of remote sensing data.
Vínculos y módulos
Expandir todo Colapsar todosVínculos
Land Degradation Neutrality Transformative Projects and Programmes (LDN-TPP) … [Georgia]
In the framework of the project ‘Generating Economic and Environmental Benefits from Sustainable Land Management for Vulnerable Rural Communities of Georgia’, Land Degradation Neutrality Transformative Projects and Programmes (LDN-TPP) were developed to implement the LDN targets at municipal level. The approach defines the process to break down global and international …
- Compilador: Daniel Zollner
Integrated Pasture Management Planning in Mountainous Regions [Georgia]
The unsustainable use of pastures and forest areas has led to soil erosion, degradation, desertification and loss of biodiversity in the high mountain areas of the South Caucasus. The development of pasture passports is part of a broader approach to a strategic pasture management plan for Tusheti. This showcase includes …
- Compilador: Hanns Kirchmeir
Módulos
No se hallaron módulos