Remote Sensing as a Tool for Land Degradation Neutrality Monitoring [Geórgia]
- Criação:
- Atualização:
- Compilador/a: Hanns Kirchmeir
- Editores: Natia Kobakhidze, Christian Goenner
- Revisor: Rima Mekdaschi Studer
technologies_5488 - Geórgia
Veja as seções
Expandir tudo Recolher tudo1. Informação geral
1.2 Detalhes do contato das pessoas capacitadas e instituições envolvidas na avaliação e documentação da tecnologia
co-compiler:
co-compiler:
Nome do projeto que facilitou a documentação/avaliação da Tecnologia (se relevante)
Integrated Biodiversity Management, South Caucasus (IBiS)Nome da(s) instituição(ões) que facilitou(ram) a documentação/ avaliação da Tecnologia (se relevante)
Deutsche Gesellschaft für Internationale Zusammenarbeit (GIZ)1.3 Condições em relação ao uso da informação documentada através de WOCAT
O compilador e a(s) pessoa(s) capacitada(s) aceitam as condições relativas ao uso de dados documentados através do WOCAT:
Sim
1.4 Declaração de sustentabilidade da tecnologia descrita
A tecnologia descrita aqui é problemática em relação a degradação da terra de forma que não pode ser declarada uma tecnologia de gestão sustentável de terra?
Não
1.5 Referência ao(s) questionário(s) sobre abordagens GST (documentado(s) usando WOCAT)
Land Degradation Neutrality Transformative Projects and Programmes (LDN-TPP) … [Geórgia]
In the framework of the project ‘Generating Economic and Environmental Benefits from Sustainable Land Management for Vulnerable Rural Communities of Georgia’, Land Degradation Neutrality Transformative Projects and Programmes (LDN-TPP) were developed to implement the LDN targets at municipal level. The approach defines the process to break down global and international …
- Compilador/a: Daniel Zollner
Integrated Pasture Management Planning in Mountainous Regions [Geórgia]
The unsustainable use of pastures and forest areas has led to soil erosion, degradation, desertification and loss of biodiversity in the high mountain areas of the South Caucasus. The development of pasture passports is part of a broader approach to a strategic pasture management plan for Tusheti. This showcase includes …
- Compilador/a: Hanns Kirchmeir
2. Descrição da tecnologia de GST
2.1 Descrição curta da tecnologia
Definição da tecnologia:
Land degradation contributes to biodiversity loss and the impoverishment of rural livelihoods in Tusheti. Above all, however, land degradation are triggered by climate change as traditional land use practise might not be adapted to new climate conditions which can cause or speed up degradation processes significantly. On the other hand, degraded land often leads to low biomass volumes and this reduces the ecosystem capability to stabilise local climate conditions. The concept of Land Degradation Neutrality (LDN) and the method of using remote sensing for monitoring land degradation are tools to identify the need for local planning processes. This showcase describes the LDN monitoring concept, national targets and the technology to assess indicators, mechanism and incentives for LDN.
2.2 Descrição detalhada da tecnologia
Descrição:
Purpose
The continuing global degradation of land resources threatens food security and the functioning of ecosystem services by reducing or losing their biological or economic productivity. Unsustainable land-use practices such as deforestation, overgrazing and inappropriate agricultural management systems trigger the loss and degradation of valuable land resources in Georgia. These effects are visible in all countries of the South Caucasus. About 35% of the agricultural land in Georgia is severely degraded, 60% is of low to middle production quality.
Land Degradation Neutrality (LDN)
LDN is a new international concept to combat the ongoing degradation of valuable soil resources. The LDN concept was developed by the UNCCD to encourage countries to take measures to avoid, reduce or reverse land degradation, with the vision of achieving a zero-net loss of productive land. To combat land degradation in Georgia, in 2017, the national LDN Working Group set voluntary national targets to address specific aspects of LDN, and submitted them to the UNCCD Secretariat.
To effectively set up counter measures to combat land degradation it is important to have detailed spatial information on land cover and land cover changes as well as on trends in degradation (like size of areas effected by erosion). Therefore a remote sensing toolset was developed and tested in the pilot are of Tusheti protected landscapes in the High Caucasus in Georgia. This region shows increasing soil erosion problems by uneven distribution of grazing activities and was selected for developing erosion control measures within the Integrated Biodiversity Management in the South Caucasus Program (IBiS) funded by the Deutsche Gesellschaft für internationale Zusammenarbeit (GIZ).
Sensitivity Model
The Integrated Biodiversity Management in the South Caucasus (IBiS) project in cooperation with national experts in Georgia, developed and applied a remote sensing toolset called "Erosion Sensitivity Model". This remote sensing toolset helps to assess the current state and the general erosion risk. The sensitivity model is based on the RUSLE – Revised Universal Soil Loss Equation. The tool allows the calculation of erosion caused by rainfall and surface run-off. The RUSLE equation incorporates a combination of different input factors such as precipitation (R), soil type (K), slope (LS), vegetation cover (C) and protection measures (P). In this way, the estimated average soil loss in tonnes per acre per year (A) can be calculated as follows: A = R * K * LS * C * P.
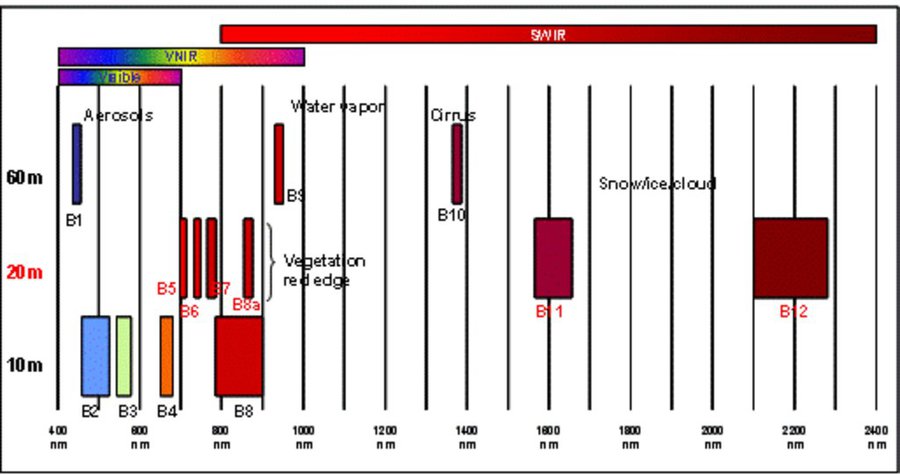
The rainfall factor (R) results from a quotient from the monthly and annual mean value of precipitation. The data come from the data platform “CHELSA – Climatologies at high resolution for the earth’s land surface areas”. For the soil type factor (K), a soil map of 1:200,000 was taken. Then, depending on the soil type, different contents of sand, silt, loam and clay were used to calculate the K factor. The slope length and steepness factor (LS) is calculated from a digital elevation model (DEM) with a raster resolution of 10x10m. The DEM is derived from the topographic map 1:25,000. The global elevation model derived from SRTM data (Shuttle Radar Topography Mission) has a resolution of 30x30 m and is available worldwide free of charge. The land cover factor (C) describes the vegetation cover that protects the soil from erosion. The vegetation cover slows down the speed of the raindrops and reduces the erosive effect of the rain. It slows down surface water runoff and stabilises the soil through root systems. The main indicators, land cover and productivity, can be assessed by remote sensing. The data from satellites need to be classified and calibrated by field data (ground truthing). The technology for the assessment of these indicators with Sentinel 2 satellite images was developed and applied in 2016 to 2018 in the Tusheti region (Akhmeta municipality) in the framework of the GIZ-IBiS project. Based on spectral information from airborne or satellite images, the density of the vegetation was calculated and mapped. There are well developed vegetation indices and classification systems to derive different land cover types and vegetation densities (mainly described by the Leaf Area Index LAI or biomass indices). The LAI is the area of the leaf surface (in square meters) per square meter ground surface. Since the real surface area of the leaves is hardly measurable, the amount of biomass is a proxy for the LAI. The P-factor is rarely considered in large-scale modelling of soil erosion risk as it is difficult to estimate it with very high accuracy. Therefore, to refine the model, a more detailed DEM (digital elevation model) is required (e.g., from satellite images). Based on the input factors, a soil erosion risk map was calculated for the whole territory of the Tusheti Protected Areas (113,660 ha). Based on the different spectral bands of the Sentinel 2 satellite image, a land cover map was calculated using the Support Vector Machine (SVM) technology and spectral image information.
The results have been integrated in the development of pasture management plans ("pasture passports"). This maps and documents are indicating areas of high erosion risk that need to be excluded from grazing and the maximum number of livestock has been calculated based on the biomass maps and will be integrated into the lease contracts.
The repetition of the remote sensing after some years (e.g. 5 years) will help to evaluate, if the measures in the pasture management have been successful to stop the degradation processes.
2.3 Fotos da tecnologia
Galeria de Mídias
2.5 País/região/locais onde a tecnologia foi aplicada e que estão cobertos nesta avaliação
País:
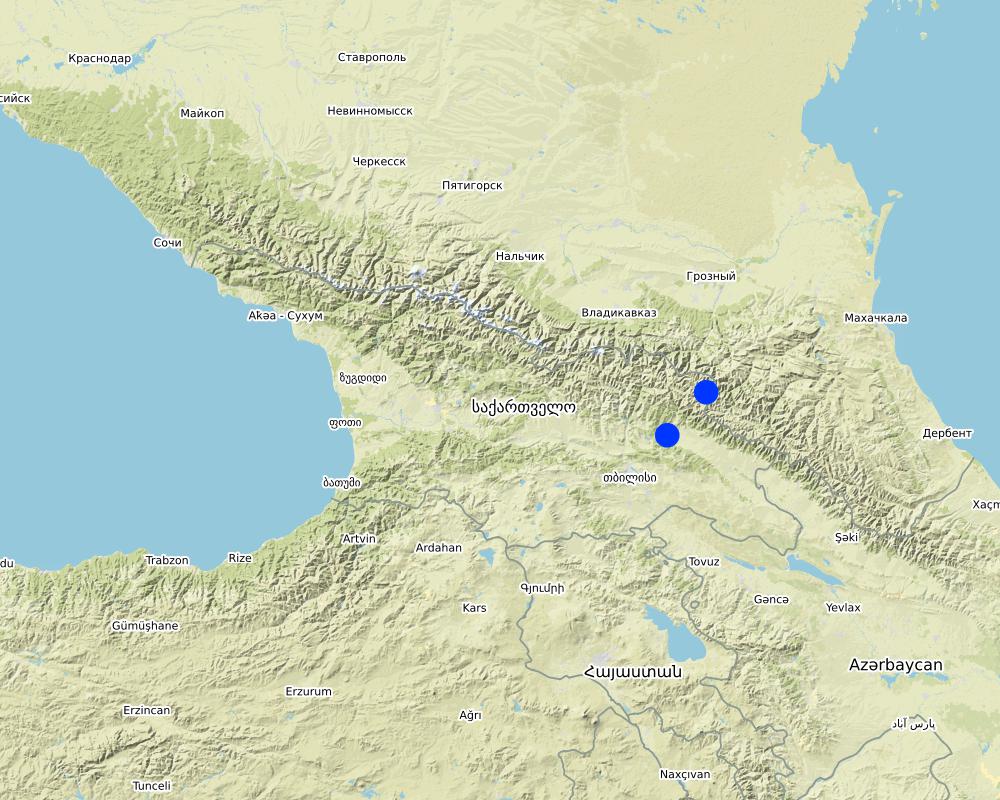
Geórgia
Região/Estado/Província:
Tusheti region, Akhmeta municipality
Especifique a difusão da tecnologia:
- Uniformemente difundida numa área
Se a Tecnologia estiver uniformemente distribuída por uma área, especifique a área coberta (em km2):
1000,0
O(s) local(is) tecnológico(s) está(ão) localizado(s) em uma área permanentemente protegida?
Sim
Caso afirmativo, especifique:
The area is in the Tusheti Protected Areas (Tusheti Strict Nature Reserve, Tusheti National Park, Tusheti Protected Landscape).
Comentários:
The whole territory was analysed by remote sensing and field records for calibration were collected on sample plots from different places in Tusheti.
Map
×2.6 Data da implementação
Indique o ano de implementação:
2016
2.7 Introdução da tecnologia
Especifique como a tecnologia foi introduzida:
- através de projetos/intervenções externas
3. Classificação da tecnologia de GST
3.1 Principal/principais finalidade(s) da tecnologia
- Melhora a produção
- Reduz, previne, recupera a degradação do solo
- Preservar/melhorar a biodiversidade
- provide information to make a spatial-territorial planning
3.2 Tipo(s) atualizado(s) de uso da terra onde a tecnologia foi aplicada
Uso do solo misturado dentro da mesma unidade de terra:
Sim
Especificar o uso misto da terra (culturas/ pastoreio/ árvores):
- Agropecuária (incl. agricultura e pecuária)

Terra de cultivo
- Cultura anual
Cultivo anual - Especificar culturas:
- cereais - cevada
- culturas de raiz/tubérculos- batatas
Número de estações de cultivo por ano:
- 1
O cultivo entre culturas é praticado?
Não
O rodízio de culturas é praticado?
Não

Pastagem
Pastagem extensiva:
- Pastoreio transumante
Tipo de animal:
- gado - leite e carne bovina (por exemplo, zebu)
- ovelhas
É praticado o manejo integrado de culturas e pecuária?
Não
3.3 O uso do solo mudou devido à implementação da Tecnologia?
O uso do solo mudou devido à implementação da Tecnologia?
- Não (Continuar com a pergunta 3.4)
3.4 Abastecimento de água
Outros (p. ex. pós-inundação):
- rainfed and mixed rained-irrigation
3.5 Grupo de GST ao qual pertence a tecnologia
- Gestão de pastoralismo e pastagem
- Solo/cobertura vegetal melhorada
3.6 Medidas de GST contendo a tecnologia

Medidas de gestão
- M2: Mudança de gestão/nível de intensidade

Outras medidas
Especifique:
It is a monitoring technology to evaluate land management activities.
Comentários:
On some pilot plots technologies to control erosion and stop land degradation have been tested. This includes fencing, rotational pasture management, mulching and installing check dams to stop gully erosion.
3.7 Principais tipos de degradação da terra abordados pela tecnologia

Erosão do solo pela água
- Wt: Perda do solo superficial/erosão de superfície
- Wg: Erosão por ravinas/ravinamento

Deteriorização física do solo
- Pc: Compactação

Degradação biológica
- Bc: redução da cobertura vegetal
- Bq: quantidade/ declínio da biomassa
Comentários:
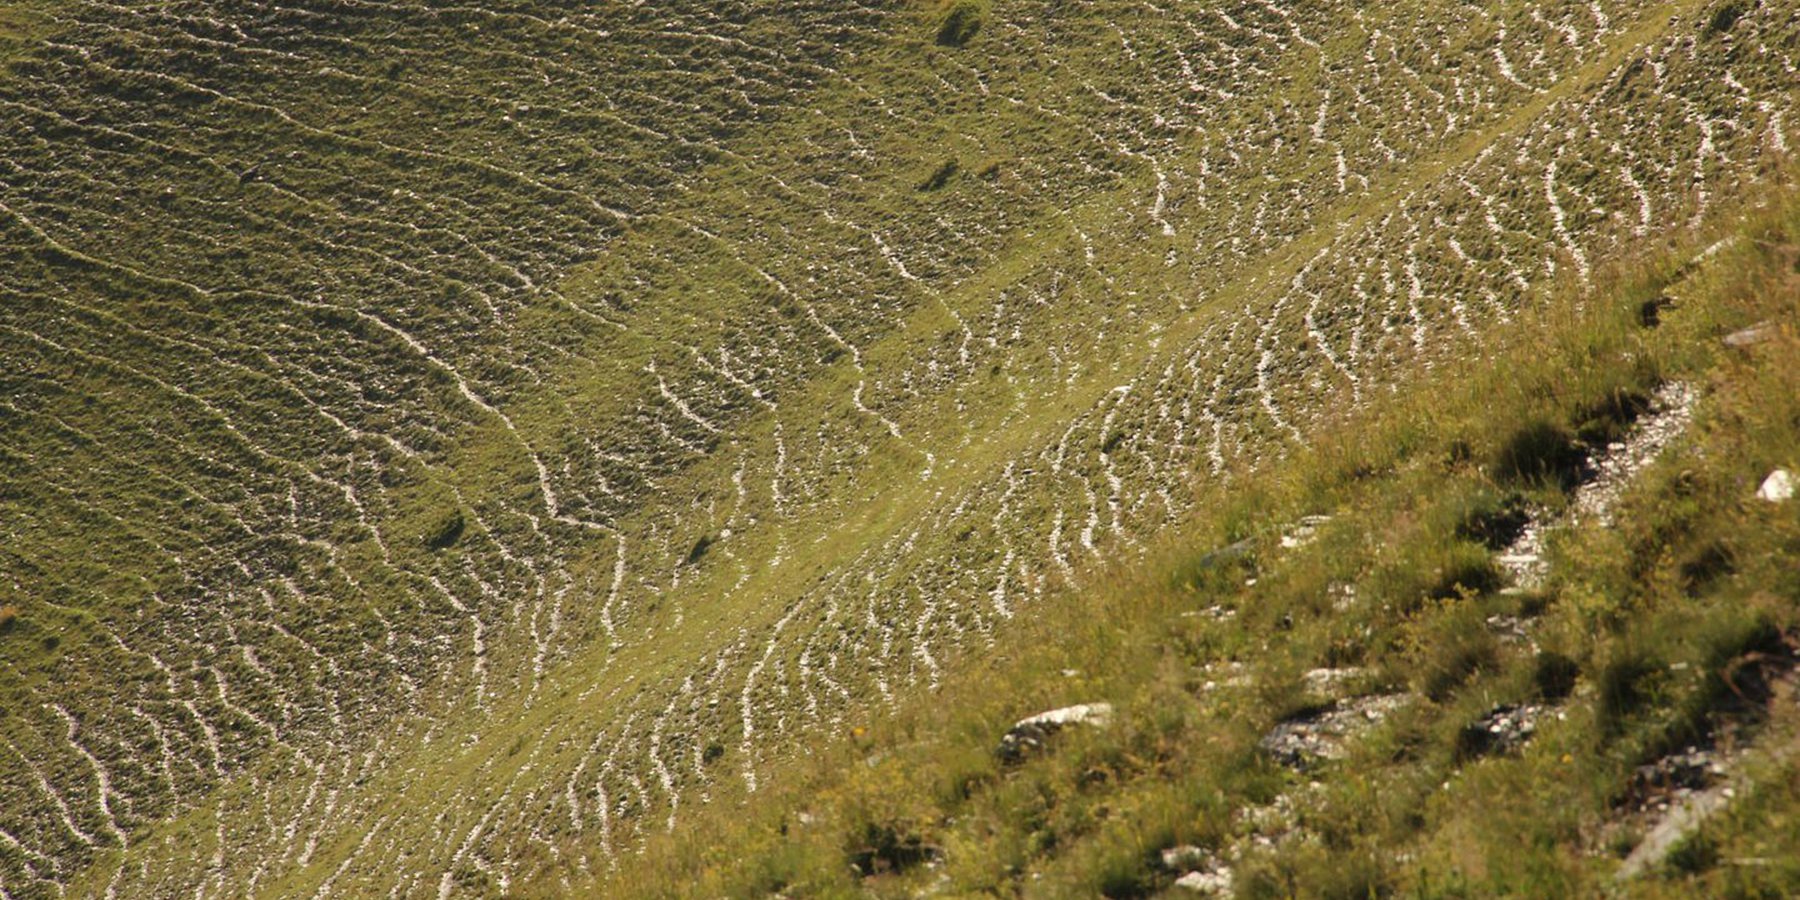
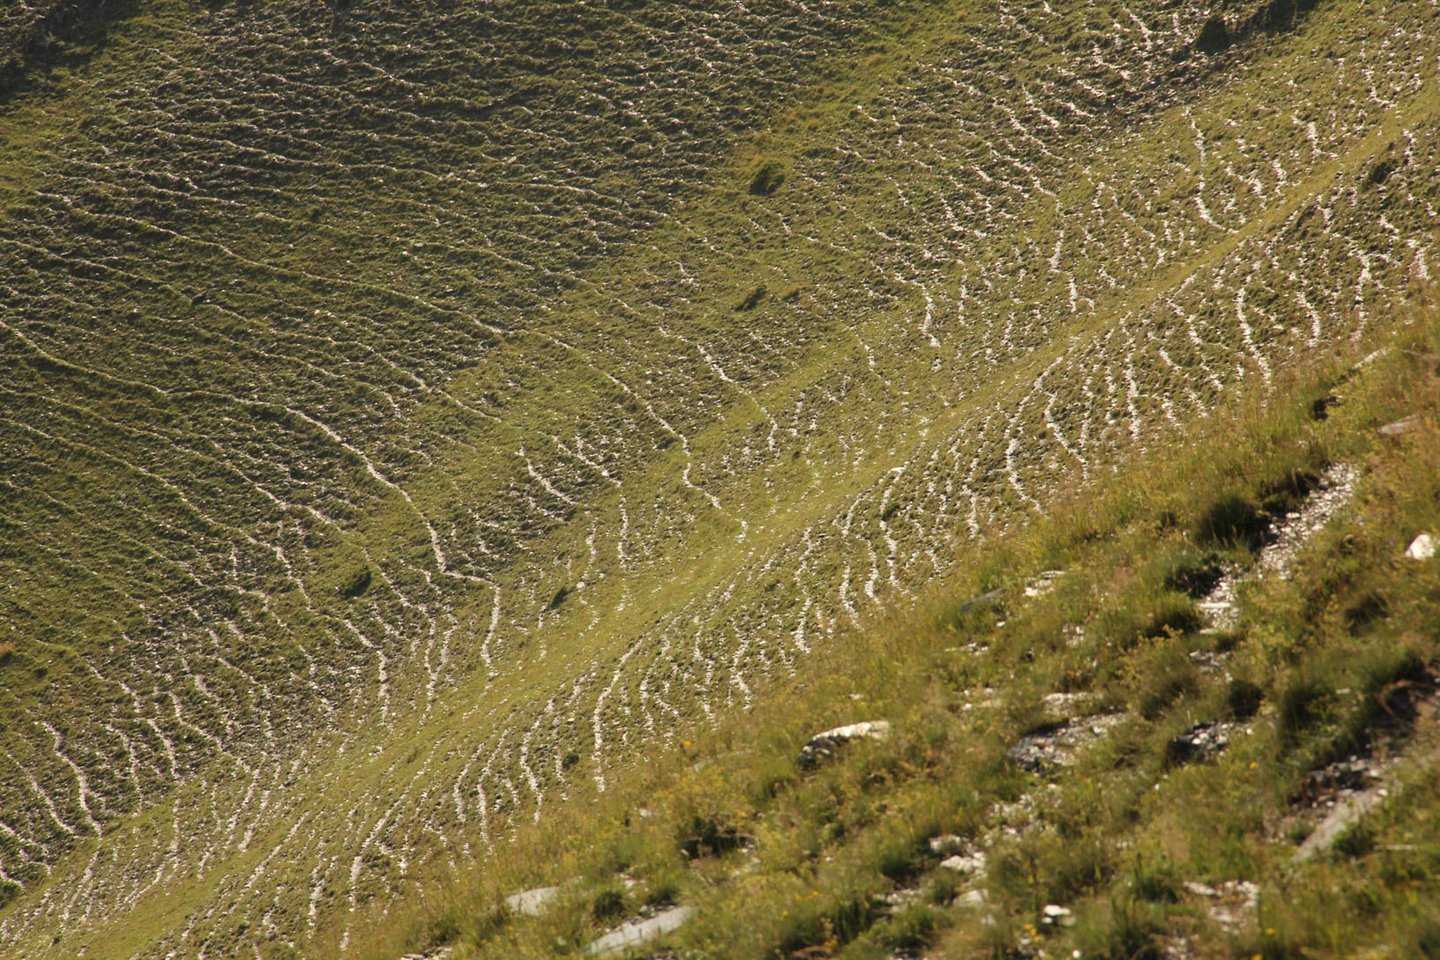
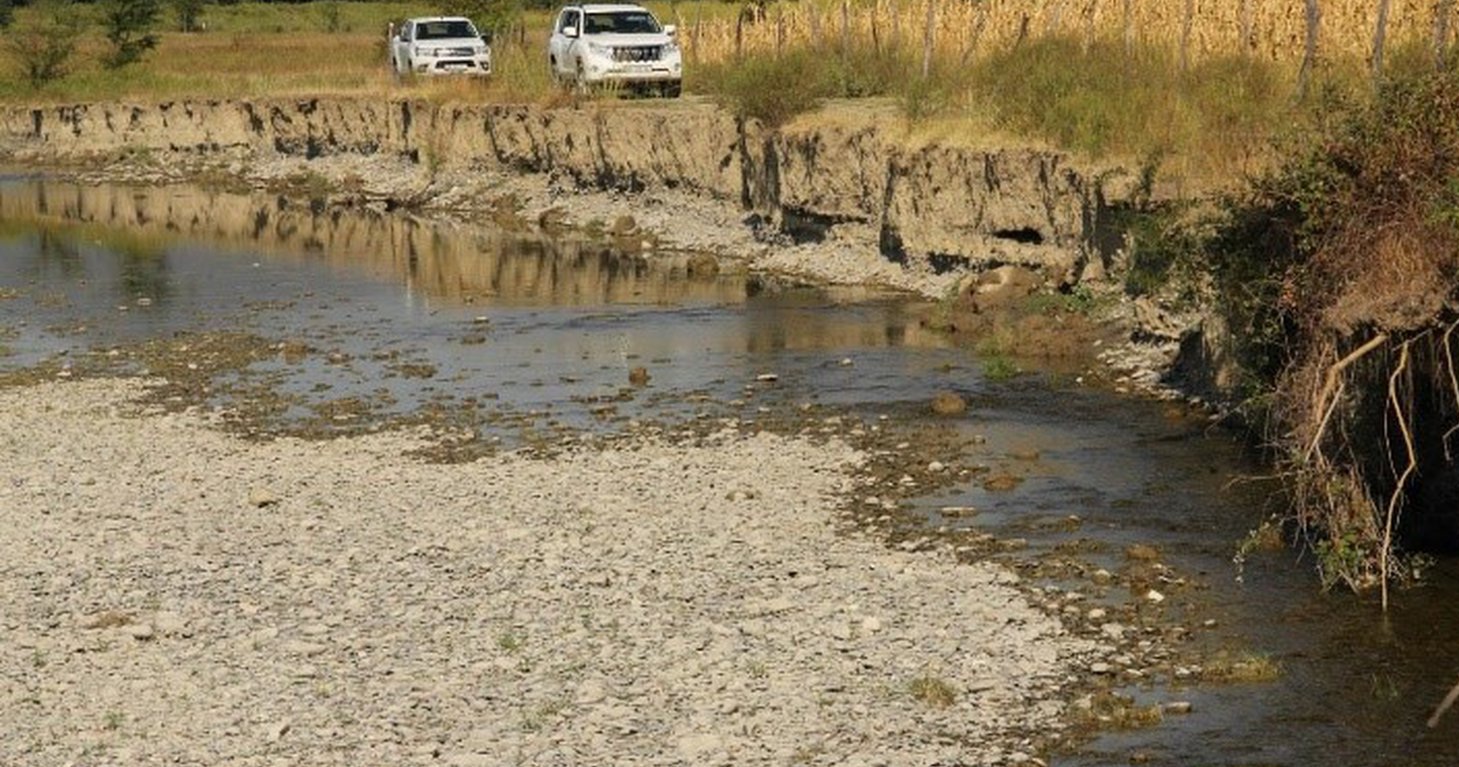
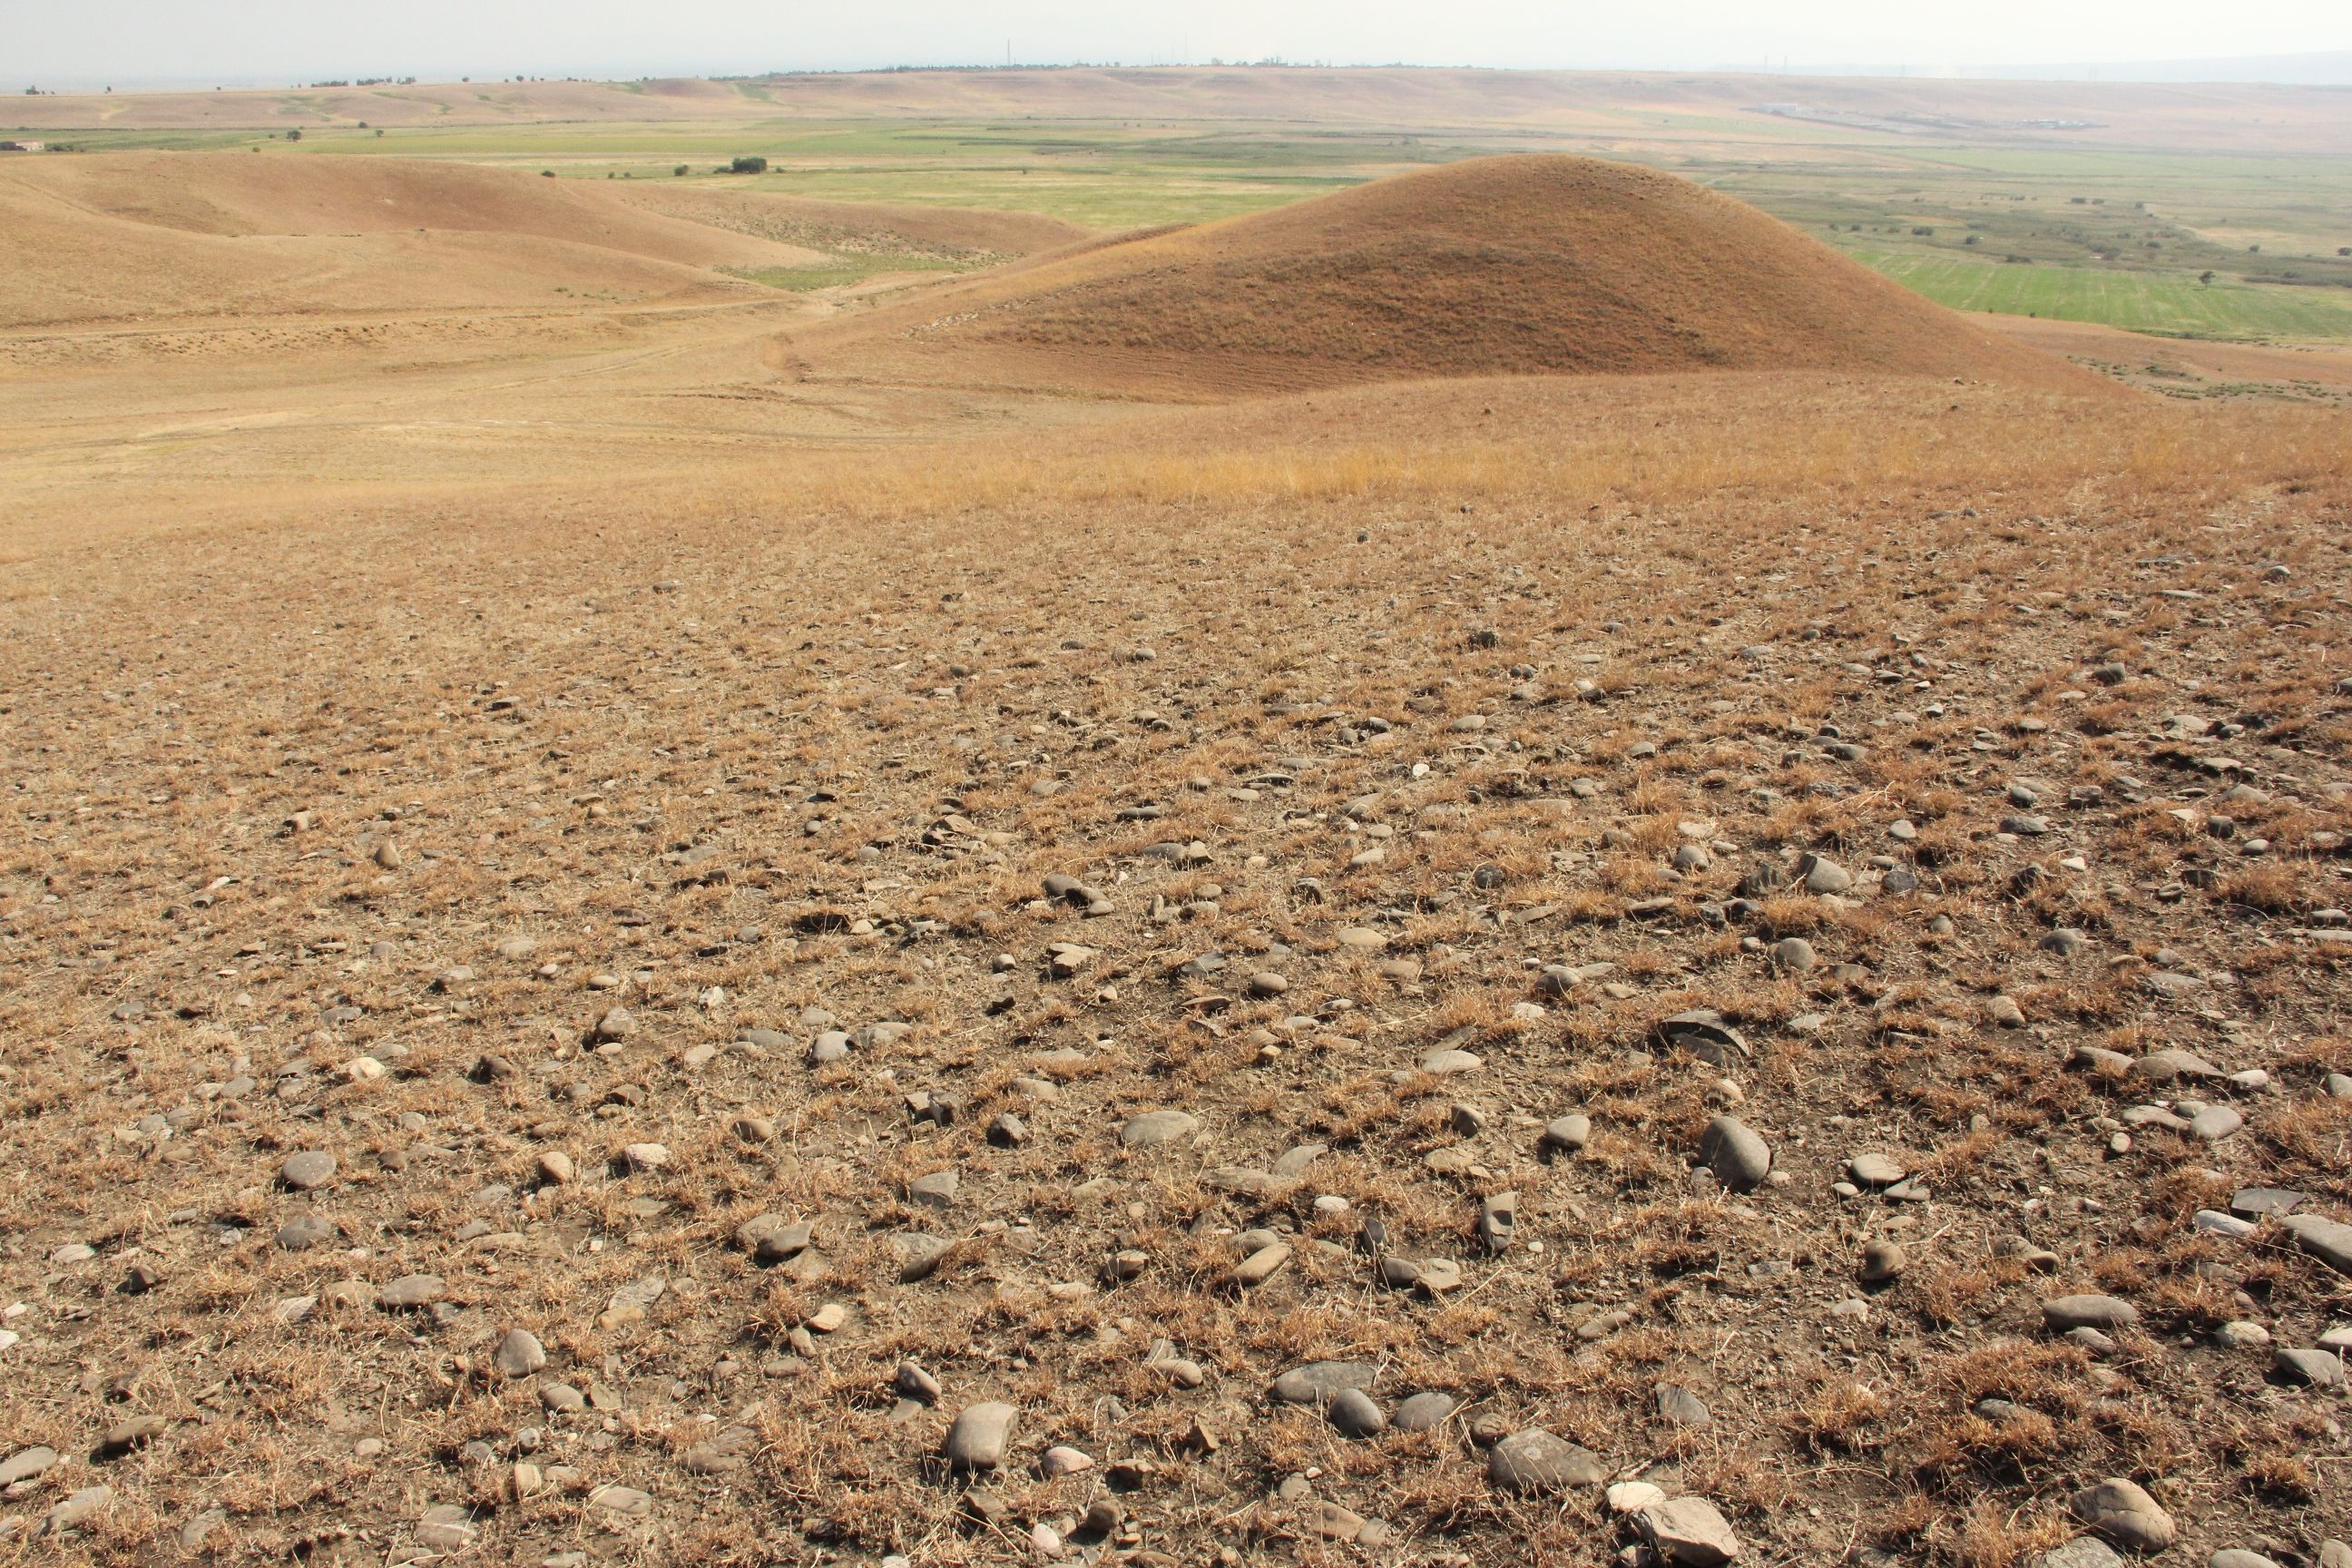
The main drivers of land degradation in the pilot area are overgrazing and trampling, off-road driving as well as infrastructure development (especially inappropriate road construction in steep slopes).
3.8 Redução, prevenção ou recuperação da degradação do solo
Especifique o objetivo da tecnologia em relação a degradação da terra:
- Prevenir degradação do solo
- Reduzir a degradação do solo
Comentários:
The monitoring tools presented here help to monitor the development of land degradation and to evaluate measures and development trends.
4. Especificações técnicas, implementação de atividades, entradas e custos
4.1 Desenho técnico da tecnologia
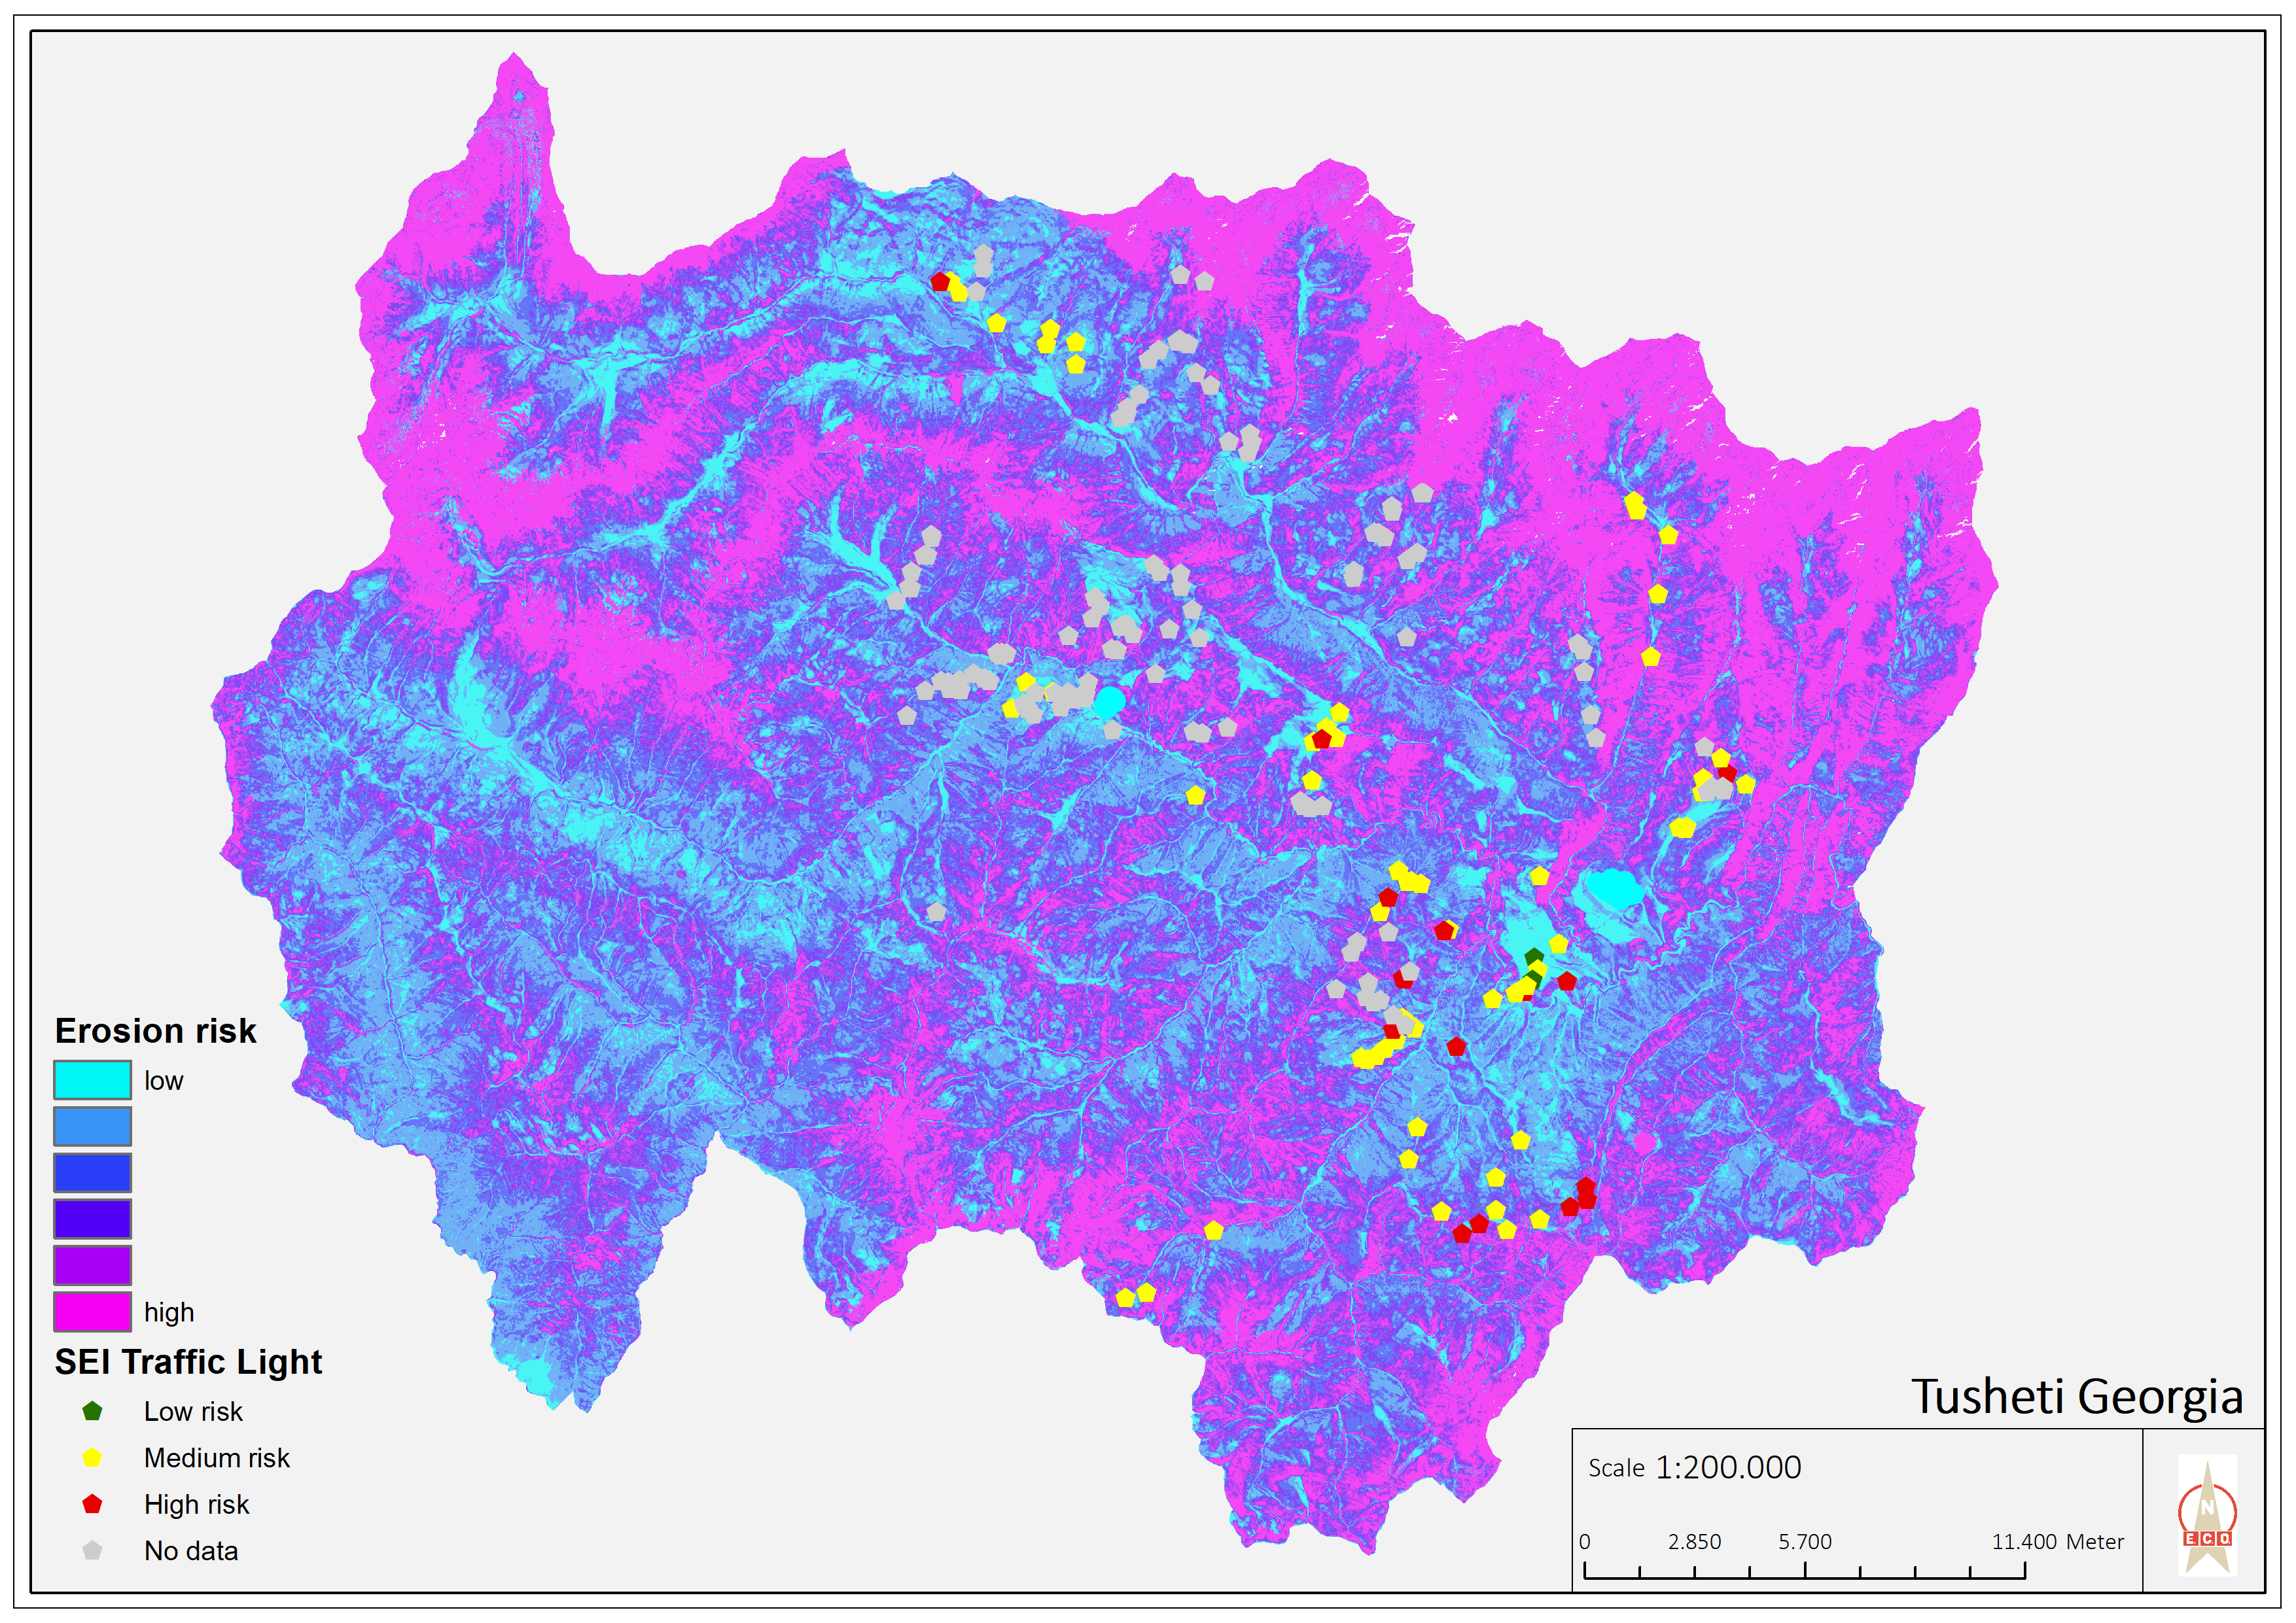
Especificações técnicas (relacionada ao desenho técnico):
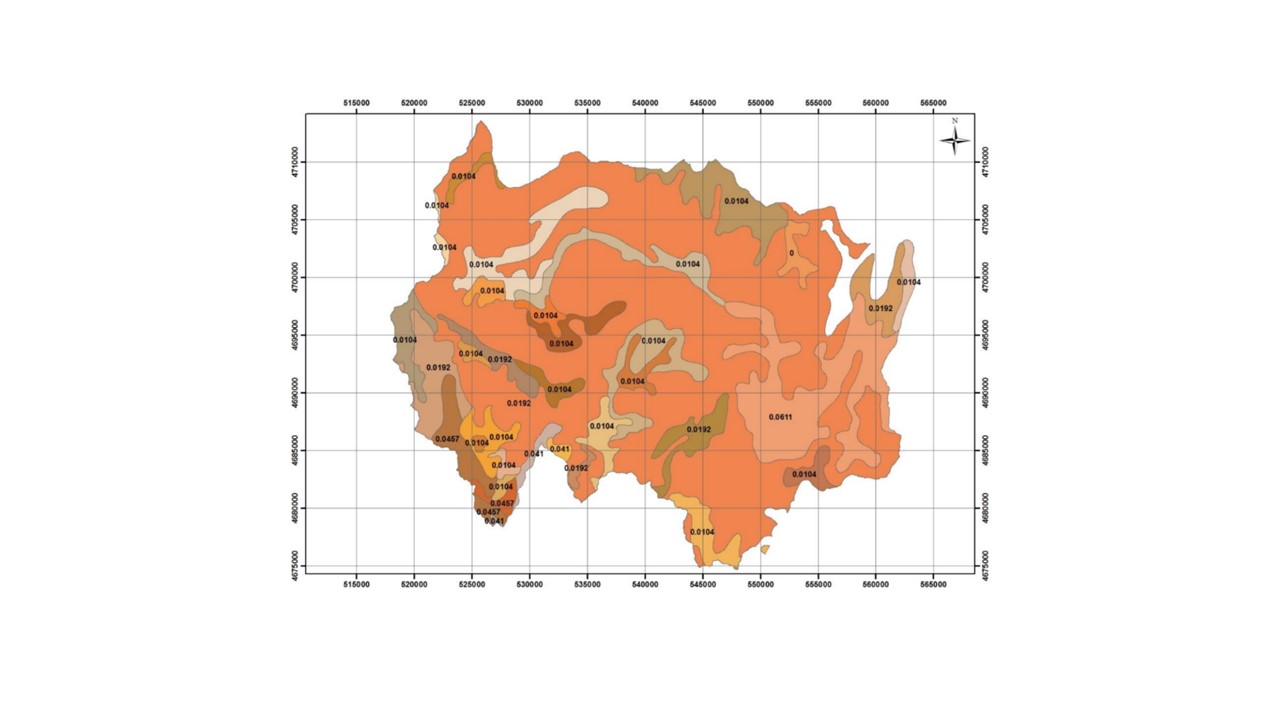
Map of erosion hot spots (pink colour) and the location of field sample plots for evaluation and ground truthing.
Autor:
Hanns Kirchmeir
Data:
11/09/2019
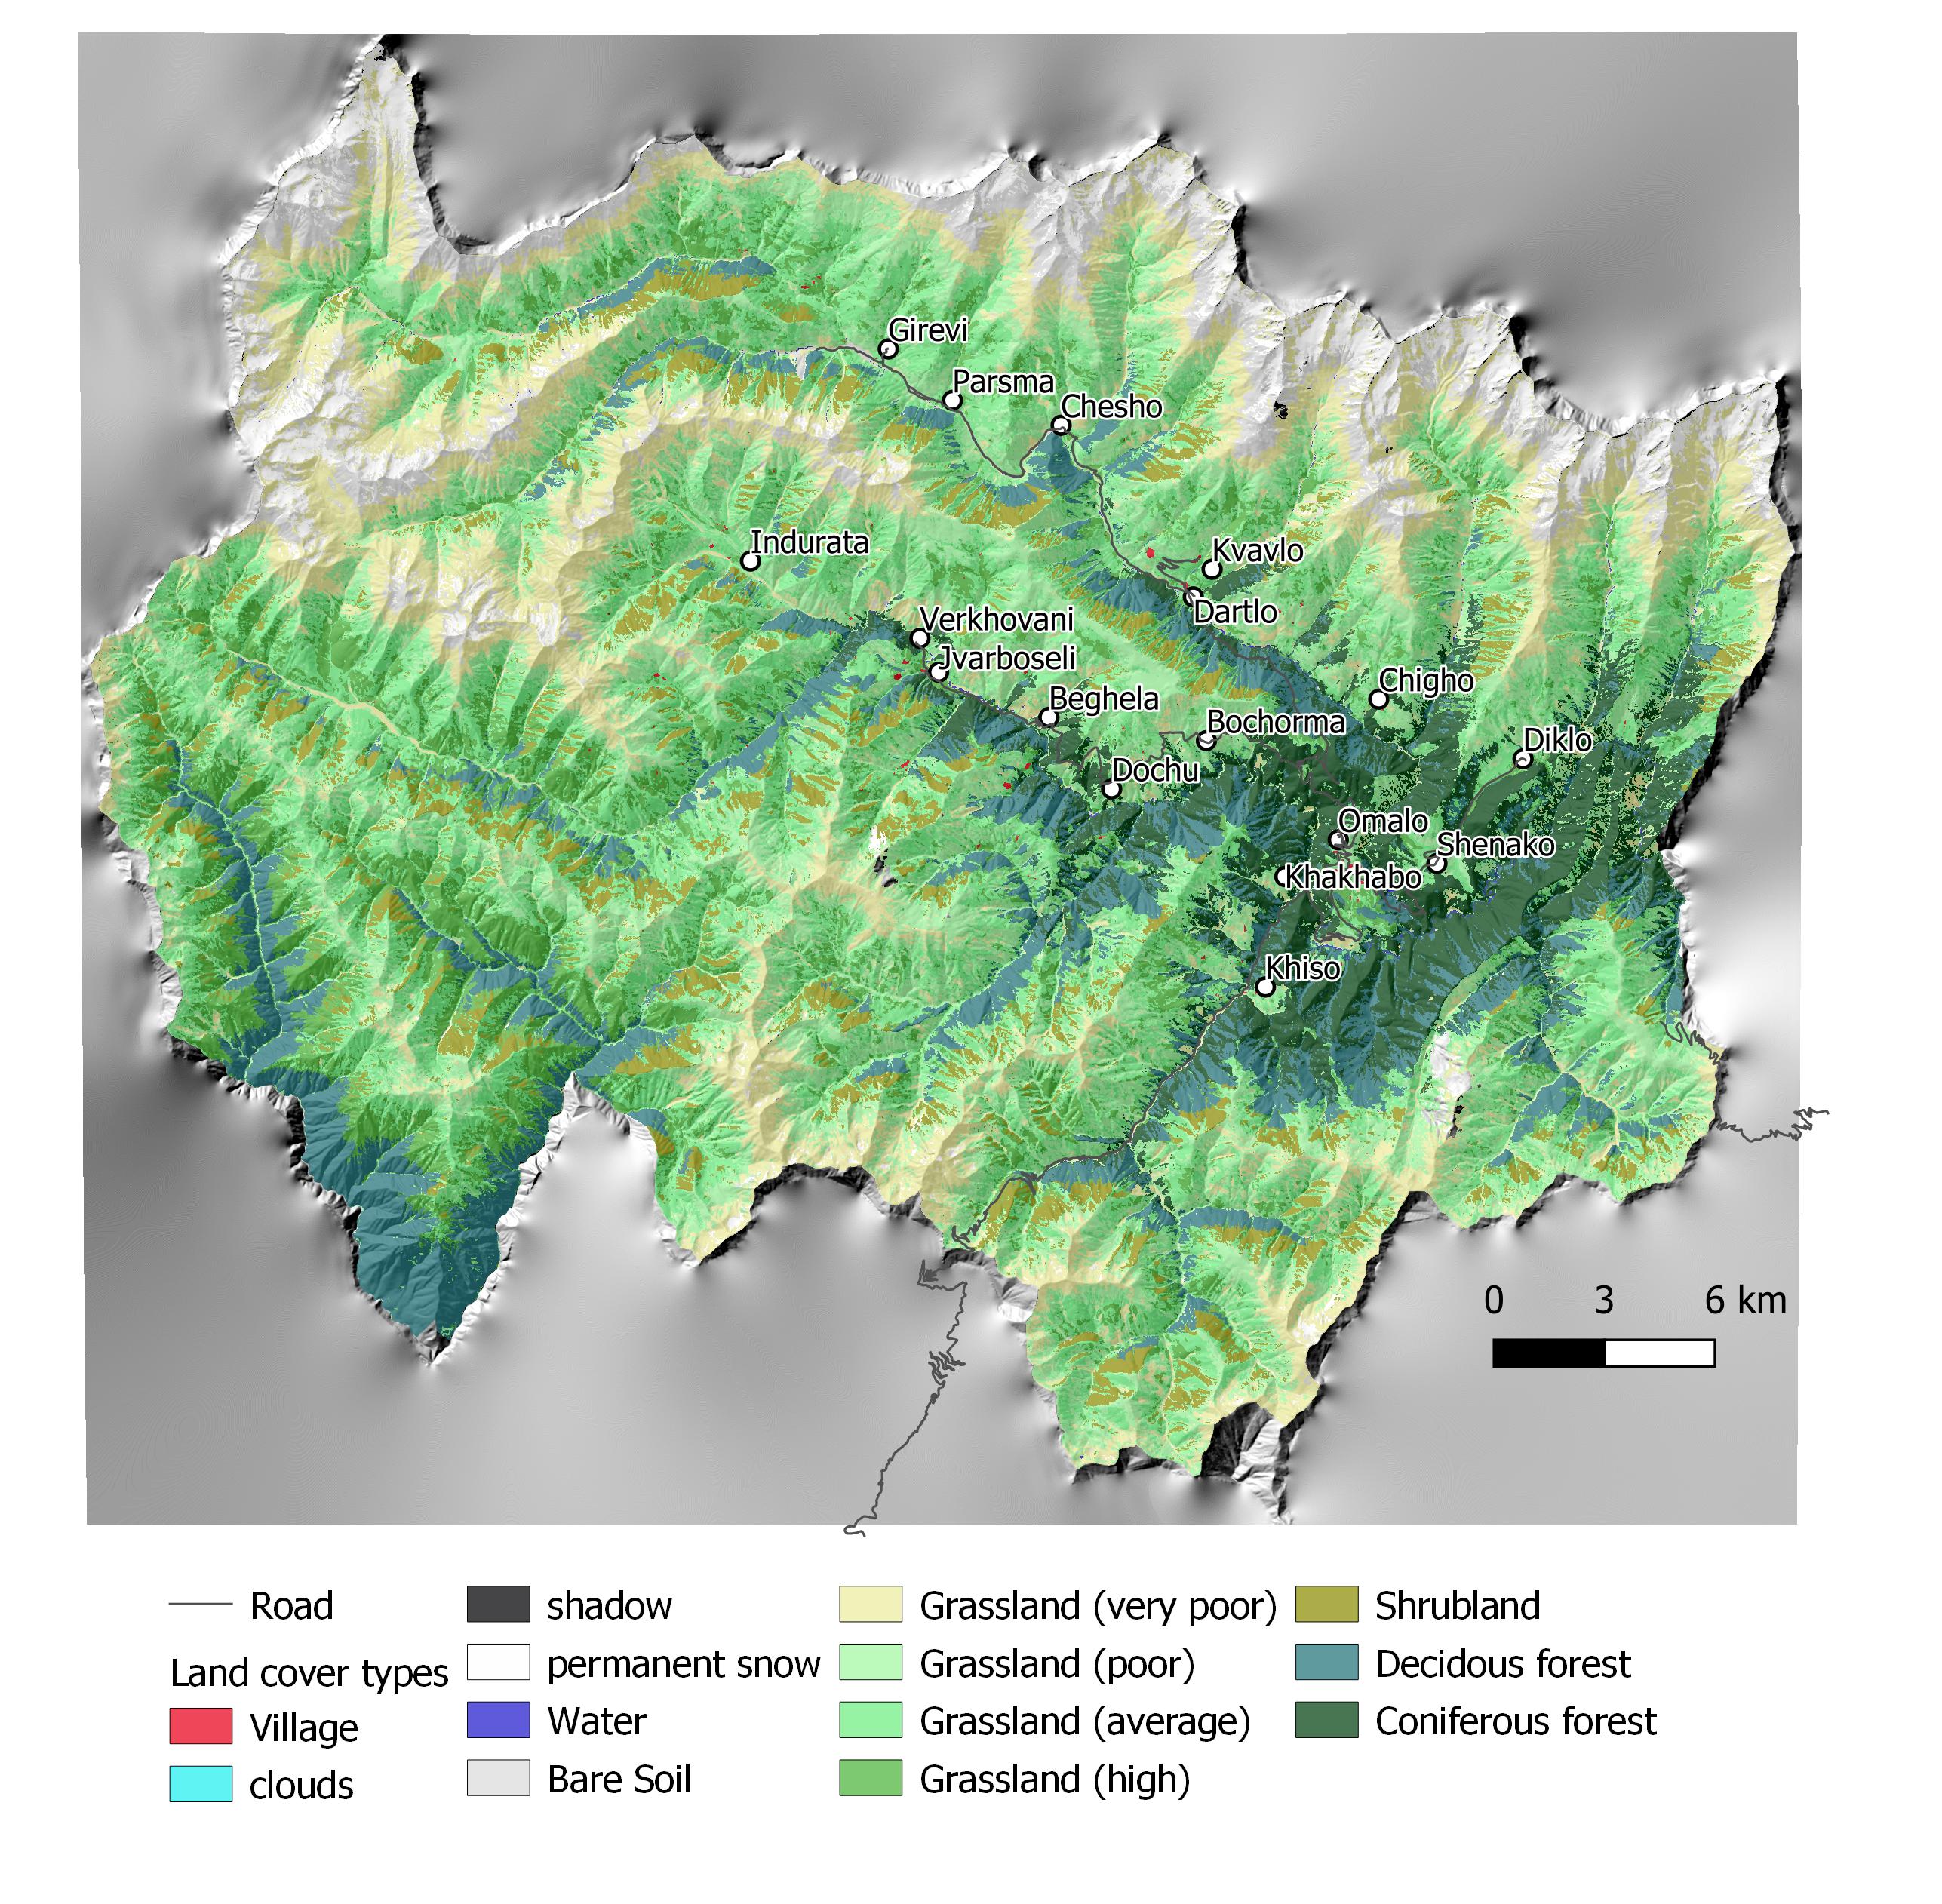
Especificações técnicas (relacionada ao desenho técnico):
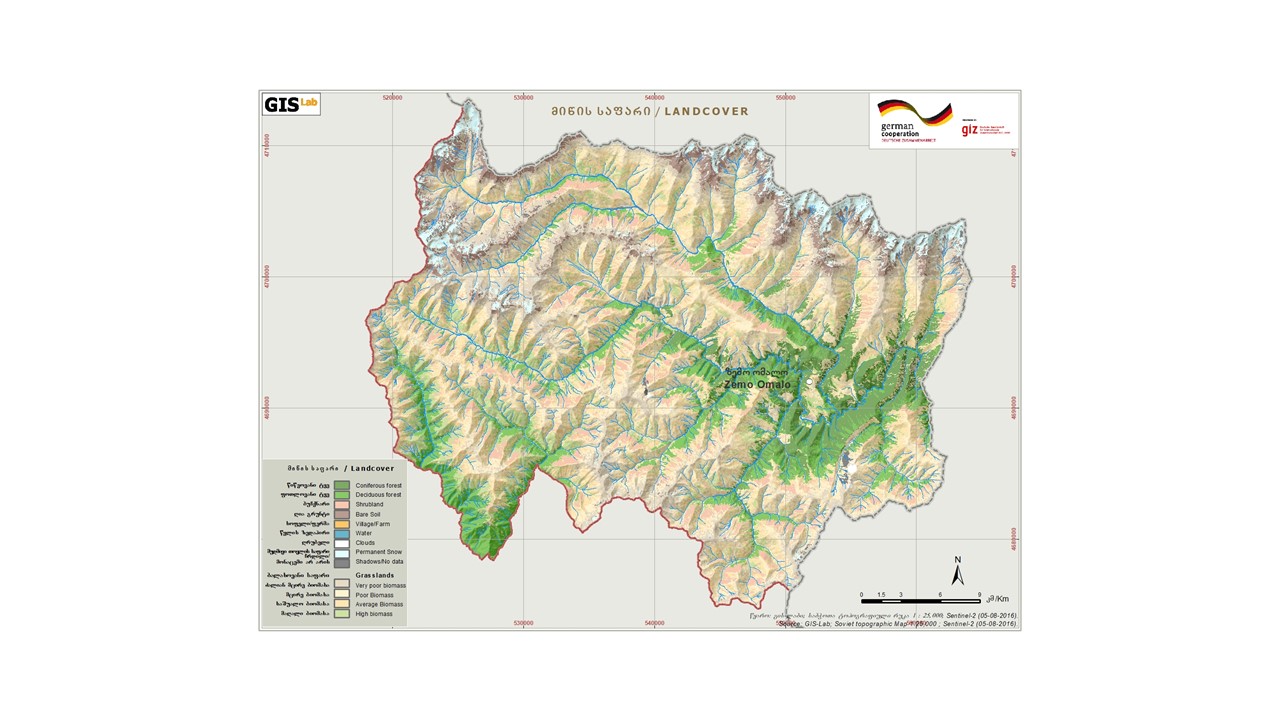
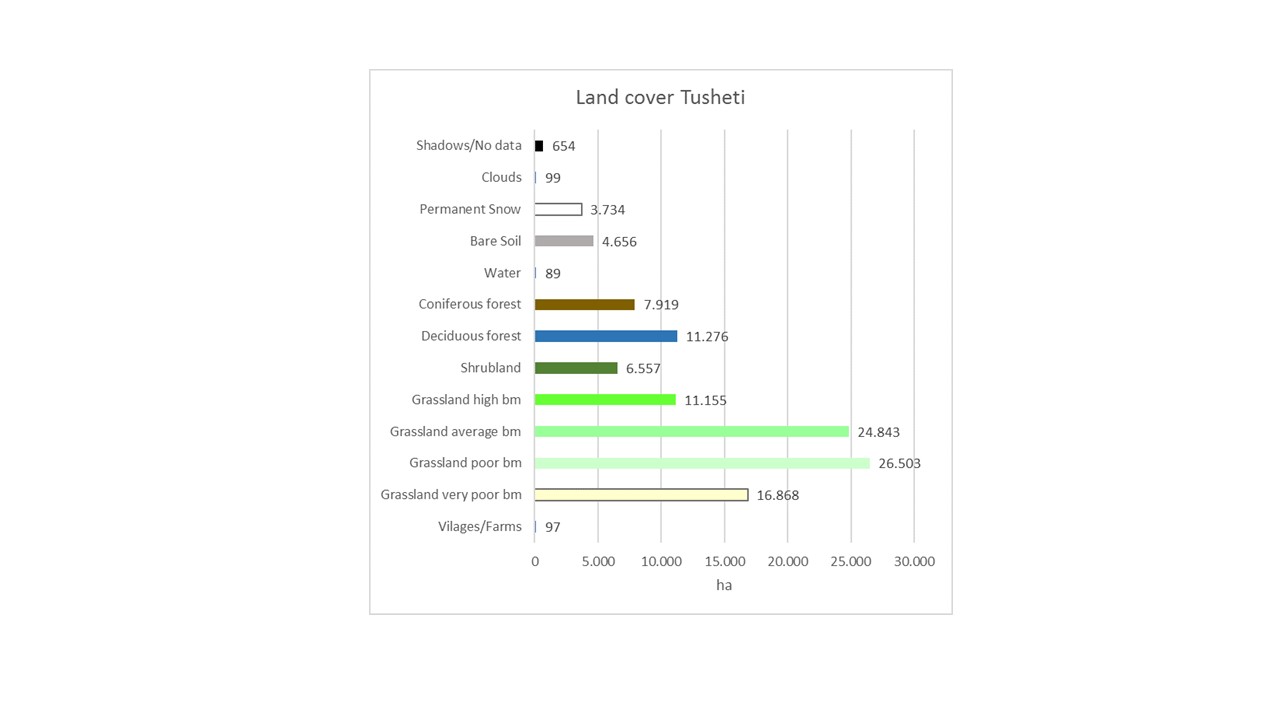
Map of land cover classification derived from satellite images. The different grassland types are classified by their biomass as an indicator of productivity and current state. Repeating the satellite image classification with the same parameters after 5 or 10 years can give a clear picture of changes in the land cover.
Autor:
Hanns Kirchmeir
Data:
11/09/2019
4.2 Informação geral em relação ao cálculo de entradas e custos
Especifique como custos e entradas foram calculados:
- por área de tecnologia
Indique o tamanho e a unidade de área:
1000 km2
Especifique a moeda utilizada para os cálculos de custo:
- USD
Indique a média salarial da mão-de-obra contratada por dia:
100
4.3 Atividades de implantação
| Atividade | Periodicidade (estação do ano) | |
|---|---|---|
| 1. | National level. Baseline: Field assessment for remote sensing calibration (1x/20 years) | 2017 |
| 2. | Sentinel satellite image classification (multi temporal data from 2017) | 2017 |
| 3. | Statistical data from GEOSTAT Agricultural census | 2014-2016 |
| 4. | Analysis of soil carbon content from existing profiles | 2003 - 2006 |
| 5. | Conduct ongoing monitoring | 5 years intervals |
| 6. | Update sentinel satellite image classification | 1x year |
| 7. | Update statistical data from GEOSTAT Agricultural census | 4x/year |
| 8. | Resampling of soil carbon content near existing profiles | 1x/5 years |
| 9. | Municipal level. Spatial planning: Assessment of current stage of land degradation, anticipated gains and losses | 1x/10 years |
| 10. | Revision of spatial planning on Municipal level. | 1x / 5 years |
4.4 Custos e entradas necessárias para a implantação
| Especifique a entrada | Unidade | Quantidade | Custos por unidade | Custos totais por entrada | % dos custos arcados pelos usuários da terra | |
|---|---|---|---|---|---|---|
| Mão-de-obra | Remote Sensing analysis by Sentinel Satellite data | person days | 50,0 | 200,0 | 10000,0 | |
| Mão-de-obra | Collecting field data for satellite image callibration | person days | 40,0 | 200,0 | 8000,0 | |
| Mão-de-obra | Soil sampling (for carbon content) | person days | 20,0 | 200,0 | 4000,0 | |
| Mão-de-obra | Including results in spatial planning | person days | 10,0 | 200,0 | 2000,0 | |
| Custos totais para a implantação da tecnologia | 24000,0 | |||||
| Custos totais para o estabelecimento da Tecnologia em USD | 24000,0 | |||||
Comentários:
This covers the implementation of the baseline. Calibrating the model for erosion risk and land cover classification is an big investment but can be extended to larger areas than 1000 km² with similar resources.
4.5 Atividades recorrentes/manutenção
| Atividade | Periodicidade/frequência | |
|---|---|---|
| 1. | Repeating the application of the calibrated remote sensing model for monitoring repitition | with 5 years interval |
| 2. | Repetition of soil samples for assessing soil carbon content | with 5 years interval |
| 3. | Analysing the results and integrate them in spatial planning and policy making | with 5 years interval |
4.6 Custos e entradas necessárias pata a manutenção/atividades recorrentes (por ano)
| Especifique a entrada | Unidade | Quantidade | Custos por unidade | Custos totais por entrada | % dos custos arcados pelos usuários da terra | |
|---|---|---|---|---|---|---|
| Mão-de-obra | Applying the calibrated remote sensing model for monitoring repetition | person days | 20,0 | 200,0 | 4000,0 | |
| Mão-de-obra | Repetition of soil samples for assessing soil carbon content | person days | 10,0 | 200,0 | 2000,0 | |
| Mão-de-obra | Analysing results and integrating in spatial planning | person days | 10,0 | 200,0 | 2000,0 | |
| Custos totais para a manutenção da tecnologia | 8000,0 | |||||
| Custos totais de manutenção da Tecnologia em USD | 8000,0 | |||||
Comentários:
For the repetition of the remote sensing no new calibration of the GIS-model is needed. Only the field samples for soil carbon need to be repeated.
4.7 Fatores mais importantes que afetam os custos
Descreva os fatores mais determinantes que afetam os custos:
Field sample collection;
Remote sensing experts.
5. Ambiente natural e humano
5.1 Clima
Precipitação pluviométrica anual
- <250 mm
- 251-500 mm
- 501-750 mm
- 751-1.000 mm
- 1.001-1.500 mm
- 1.501-2.000 mm
- 2.001-3.000 mm
- 3.001-4.000 mm
- > 4.000 mm
Especifique a média pluviométrica anual em mm (se conhecida):
800,00
Especificações/comentários sobre a pluviosidade:
The climate is generally suitable for agriculture with an annual precipitation of up to 800 mm, with hot and humid springs, rainfall peaks in May and June with hot and dry summers.
Zona agroclimática
- Subúmido
- Semiárido
5.2 Topografia
Declividade média:
- Plano (0-2%)
- Suave ondulado (3-5%)
- Ondulado (6-10%)
- Moderadamente ondulado (11-15%)
- Forte ondulado (16-30%)
- Montanhoso (31-60%)
- Escarpado (>60%)
Formas de relevo:
- Planalto/planície
- Cumes
- Encosta de serra
- Encosta de morro
- Sopés
- Fundos de vale
Zona de altitude:
- 0-100 m s.n.m.
- 101-500 m s.n.m.
- 501-1.000 m s.n.m.
- 1.001-1.500 m s.n.m.
- 1.501-2.000 m s.n.m.
- 2.001-2.500 m s.n.m.
- 2.501-3.000 m s.n.m.
- 3.001-4.000 m s.n.m.
- > 4.000 m s.n.m.
Indique se a tecnologia é aplicada especificamente em:
- Não relevante
Comentários e outras especificações sobre a topografia:
The remote sensing approach was applied for the total landscape of Tusheti, including a great variety of land-forms, altitudes ranging from 1600-4000 m a.s.l.
5.3 Solos
Profundidade do solo em média:
- Muito raso (0-20 cm)
- Raso (21-50 cm)
- Moderadamente profundo (51-80 cm)
- Profundo (81-120 cm)
- Muito profundo (>120 cm)
Textura do solo (solo superficial):
- Médio (limoso, siltoso)
Textura do solo (>20 cm abaixo da superfície):
- Médio (limoso, siltoso)
Matéria orgânica do solo superficial:
- Médio (1-3%)
5.4 Disponibilidade e qualidade de água
Lençol freático:
Na superfície
Disponibilidade de água de superfície:
Médio
Qualidade da água (não tratada):
Água potável precária (tratamento necessário)
A qualidade da água refere-se a:
tanto de águas subterrâneas quanto de superfície
A salinidade da água é um problema?
Não
Ocorre inundação da área?
Não
5.5 Biodiversidade
Diversidade de espécies:
- Médio
Diversidade de habitat:
- Alto
5.6 Características dos usuários da terra que utilizam a tecnologia
Sedentário ou nômade:
- Semi-nômade
Orientação de mercado do sistema de produção:
- misto (subsistência/comercial)
Rendimento não agrícola:
- Menos de 10% de toda renda
Nível relativo de riqueza:
- Pobre
Indivíduos ou grupos:
- Indivíduo/unidade familiar
Nível de mecanização:
- Trabalho manual
- Tração animal
Gênero:
- Mulheres
- Homens
Idade dos usuários da terra:
- meia-idade
Indique outras características relevantes dos usuários da terra:
The technology is applied by the Government.
5.7 Área média de terrenos utilizados pelos usuários de terrenos que aplicam a Tecnologia
- < 0,5 ha
- 0,5-1 ha
- 1-2 ha
- 2-5 ha
- 5-15 ha
- 15-50 ha
- 50-100 ha
- 100-500 ha
- 500-1.000 ha
- 1.000-10.000 ha
- > 10.000 ha
É considerado pequena, média ou grande escala (referente ao contexto local)?
- Média escala
Comentários:
The pasture units are fom 200 to 600 hectares and are based on the old Soviet grazing scheme.
5.8 Propriedade de terra, direitos de uso da terra e de uso da água
Propriedade da terra:
- Estado
Direitos do uso da terra:
- Comunitário (organizado)
- Arrendado
Direitos do uso da água:
- Acesso livre (não organizado)
Os direitos de uso da terra são baseados em um sistema jurídico tradicional?
Não
5.9 Acesso a serviços e infraestrutura
Saúde:
- Pobre
- Moderado
- Bom
Educação:
- Pobre
- Moderado
- Bom
Assistência técnica:
- Pobre
- Moderado
- Bom
Emprego (p. ex. não agrícola):
- Pobre
- Moderado
- Bom
Mercados:
- Pobre
- Moderado
- Bom
Energia:
- Pobre
- Moderado
- Bom
Vias e transporte:
- Pobre
- Moderado
- Bom
Água potável e saneamento:
- Pobre
- Moderado
- Bom
Serviços financeiros:
- Pobre
- Moderado
- Bom
6. Impactos e declarações finais
6.1 Impactos no local mostrados pela tecnologia
Impactos ecológicos
Solo
Cobertura do solo
Comentários/especificar:
Within the timeframe until 2030, specific process indicators to assess the progress will be done.
Outros impactos ecológicos
Changes in the quality of forests
Comentários/especificar:
tree height, stand density
Changes of the quality of pastures
Comentários/especificar:
biomass production
Changes in the quality of arable land
Comentários/especificar:
yield
Especificar a avaliação dos impactos no local (medidas):
The monitoring technology was applied for the first time to draw a baseline. Based on the results, activities have been planned and pilot measures have been implemented (exclusion from grazing, reforestation, regulation of grazing intensity). Future replications of the monitoring will show changes and evaluate success of measures. The technologies to control erosion are described separately in the WOCAT database (Community-based Erosion Control [Azerbaijan]; Pasture-weed control by thistle cutting [Georgia]; High-altitude afforestation for erosion control [Armenia]; Slope erosion control using wooden pile walls [Armenia])
6.2 Impactos externos mostrados pela tecnologia
Especificar a avaliação dos impactos fora do local (medidas):
The technology is only about the monitoring (see above).
6.3 Exposição e sensibilidade da tecnologia às mudanças climáticas graduais e extremos/desastres relacionados ao clima (conforme o ponto de vista dos usuários da terra)
Mudança climática gradual
Mudança climática gradual
| Estação do ano | aumento ou diminuição | Como a tecnologia lida com isso? | |
|---|---|---|---|
| Precipitação pluviométrica sazonal | verão | redução/diminuição | muito bem |
Comentários:
Technology is sensitive, it shows the climate change, the impact of the global change locally. The technology itself is not affected by climatic changes.
6.4 Análise do custo-benefício
Como os benefícios se comparam aos custos de implantação (do ponto de vista dos usuários da terra)?
Retornos a curto prazo:
neutro/balanceado
Retornos a longo prazo:
positivo
Como os benefícios se comparam aos custos recorrentes/de manutenção(do ponto de vista dos usuários da terra)?
Retornos a curto prazo:
neutro/balanceado
Retornos a longo prazo:
levemente positivo
Comentários:
The monitoring technology was applied for the first time to draw a baseline. Based on the results, activities have been planned and pilot measures have been implemented (exclusion from grazing, reforestation, regulation of grazing intensity). Future replications of the monitoring will show changes and evaluate success of measures. The technologies to control erosion are described separately in the WOCAT database (Community-based Erosion Control [Azerbaijan]; Pasture-weed control by thistle cutting [Georgia]; High-altitude afforestation for erosion control [Armenia]; Slope erosion control using wooden pile walls [Armenia]).
The costs of the remote sensing approach have not been invested by the land owners but by GIZ and the Ministry. Therefore there are no direct negative impact caused by the investment. The maintenance will be covered by public authorities as well. The positive impact for the land users are the clearly delineated pasture unit giving the exact area of grassland and the accessible amount of fodder biomass. By this, the lease-rate can be found according to the productivity and the number of livestock can be adapted to the carrying capacity of the land within the lease contract.
6.5 Adoção da tecnologia
- casos isolados/experimental
Se disponível, determine a quantidade (número de unidades familiares e/ou área abordada):
The technology is desigend to be applied by national or regional addministrations and not by land owners themselves.
6.6 Adaptação
A tecnologia foi recentemente modificada para adaptar-se as condições variáveis?
Não
6.7 Pontos fortes/vantagens/oportunidades da tecnologia
| Pontos fortes/vantagens/oportunidades na visão do usuário da terra |
|---|
| The monitoring technology can help to find erosion and degradation hot spots and based on this spatial information counter measures can be applied to save the productivity of land. As the income from agricultural activities and livestock breeding is of high priority in this pilot region, the protection of the productivity of land is of high importance to the local land users. |
| Pontos fortes/vantagens/oportunidades na visão do compilador ou de outra pessoa capacitada |
|---|
| The presented remote sensing technologies are a cost efficient and objective way to monitor land degradation and land use changes on large areas on long time periods. Based on this spatial data, land use regulations can be integrated in spatial planning and other legal and practical frameworks (e.g. pasture lease contracts) to counter act the degradation processes. The success of the measures and the development of degradation and rehabilitation can be monitored by the same toolset. |
6.8 Pontos fracos, desvantagens/riscos da tecnologia e formas de superá-los
| Pontos fracos/desvantagens/riscos na visão do usuário da terra | Como eles podem ser superados? |
|---|---|
| The technology is complex and cannot be applied by the land user her-/himself and is sometimes hard to understand. Therefore they might mistrust in the results and are not eager to accept regulations and measures to stop degradation. | Transparent documentation of the technology and regular field visits to evaluate together with the land owners and users the remote sensing results in the field. |
| Pontos fracos/vantagens/riscos na visão do compilador ou de outra pessoa capacitada | Como eles podem ser superados? |
|---|---|
| The institutional setup on the national level for the regular application of the remote sensing technology and the storage and management of the monitoring data is not established yet. GIS, remote sensing and soil experts are of limited availability. | Institutional capacity building and academic training courses provided at the Georgian universities can help to overcome these limitations. |
| Field data for calibration of satellite images (biomass volumes, classified land cover types, soil types, land management types) with exact information on the spatial location are rare and costly to be created. | Such data and information should be organised and gathered on national level across different sectors (agriculture, forestry, spatial planing, nature conservation ...). This would help to reduce significantly the costs and remote sensing could be applied on much larger areas. |
7. Referências e links
7.1 Métodos/fontes de informação
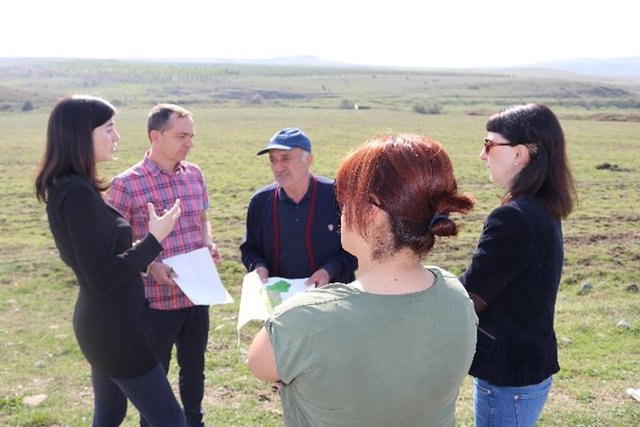
- visitas de campo, pesquisas de campo
Three field visits with national and international experts as well as representatives of administrations and local stakeholders.
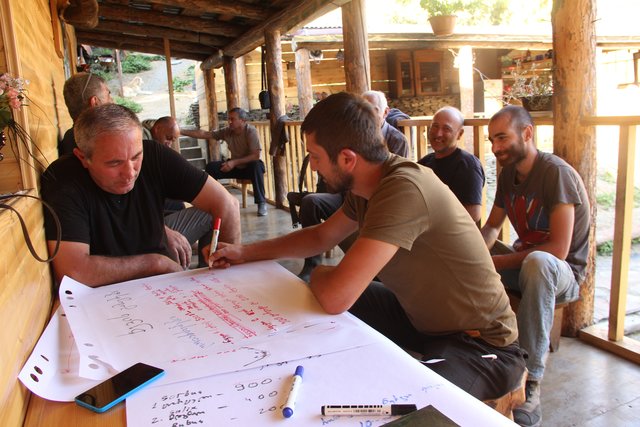
- entrevistas com usuários de terras
Meeting with cooperation partners, key village stakeholders from three pilot municipalities.
- entrevistas com especialistas em GST
Three mission meetings with 35 experts.
- compilação de relatórios e outra documentação existente
Pilot project on land degradation neutrality in Georgia Final Report. 20.10.2017.
GISLab 2016: Development of Land Cover and Erosion Risk Map based on remote sensing for Tusheti Protected Areas. Study within the frame of GIZ-IBIS.
7.2 Referências às publicações disponíveis
Título, autor, ano, ISBN:
Land Degradation Neutrality 25.10.2017
Disponível de onde? Custos?
https://e-c-o.at/files/publications/downloads/D00813_ECO_policy_brief_LDN_Georgia_171025.pdf
7.3 Links para informações on-line relevantes
Título/ descrição:
Tools for satellite image analysis
URL:
http://step.esa.int/main/snap-2-0-out-now/
Título/ descrição:
UNCCD Good Practice Guidance on SDG Indicator 15.31. (Sims et al. 2017)
URL:
https://www.unccd.int/sites/default/files/relevant-links/2017-10/Good%20Practice%20Guidance_SDG%20Indicator%2015.3.1_Version%201.0.pdf
7.4 Comentários gerais
UNCCD Good Practice Guidance on SDG Indicator 15.31. (Sims et al. 2017) gives a detailed technical overview on methods and approaches to calculate LDN indicators by means of remote sensing data.
Links e módulos
Expandir tudo Recolher tudoLinks
Land Degradation Neutrality Transformative Projects and Programmes (LDN-TPP) … [Geórgia]
In the framework of the project ‘Generating Economic and Environmental Benefits from Sustainable Land Management for Vulnerable Rural Communities of Georgia’, Land Degradation Neutrality Transformative Projects and Programmes (LDN-TPP) were developed to implement the LDN targets at municipal level. The approach defines the process to break down global and international …
- Compilador/a: Daniel Zollner
Integrated Pasture Management Planning in Mountainous Regions [Geórgia]
The unsustainable use of pastures and forest areas has led to soil erosion, degradation, desertification and loss of biodiversity in the high mountain areas of the South Caucasus. The development of pasture passports is part of a broader approach to a strategic pasture management plan for Tusheti. This showcase includes …
- Compilador/a: Hanns Kirchmeir
Módulos
Não há módulos