Remote Sensing as a Tool for Land Degradation Neutrality Monitoring [Géorgie]
- Création :
- Mise à jour :
- Compilateur : Hanns Kirchmeir
- Rédacteurs : Natia Kobakhidze, Christian Goenner
- Examinateur : Rima Mekdaschi Studer
technologies_5488 - Géorgie
Voir les sections
Développer tout Réduire tout1. Informations générales
1.2 Coordonnées des personnes-ressources et des institutions impliquées dans l'évaluation et la documentation de la Technologie
co-compiler:
co-compiler:
Nom du projet qui a facilité la documentation/ l'évaluation de la Technologie (si pertinent)
Integrated Biodiversity Management, South Caucasus (IBiS)Nom du ou des institutions qui ont facilité la documentation/ l'évaluation de la Technologie (si pertinent)
Deutsche Gesellschaft für Internationale Zusammenarbeit (GIZ)1.3 Conditions relatives à l'utilisation par WOCAT des données documentées
Le compilateur et la(les) personne(s) ressource(s) acceptent les conditions relatives à l'utilisation par WOCAT des données documentées:
Oui
1.4 Déclaration sur la durabilité de la Technologie décrite
Est-ce que la Technologie décrite ici pose problème par rapport à la dégradation des terres, de telle sorte qu'elle ne peut pas être déclarée comme étant une technologie de gestion durable des terres?
Non
1.5 Référence au(x) Questionnaires sur les Approches de GDT (documentées au moyen de WOCAT)
Land Degradation Neutrality Transformative Projects and Programmes (LDN-TPP) … [Géorgie]
In the framework of the project ‘Generating Economic and Environmental Benefits from Sustainable Land Management for Vulnerable Rural Communities of Georgia’, Land Degradation Neutrality Transformative Projects and Programmes (LDN-TPP) were developed to implement the LDN targets at municipal level. The approach defines the process to break down global and international …
- Compilateur : Daniel Zollner
Integrated Pasture Management Planning in Mountainous Regions [Géorgie]
The unsustainable use of pastures and forest areas has led to soil erosion, degradation, desertification and loss of biodiversity in the high mountain areas of the South Caucasus. The development of pasture passports is part of a broader approach to a strategic pasture management plan for Tusheti. This showcase includes …
- Compilateur : Hanns Kirchmeir
2. Description de la Technologie de GDT
2.1 Courte description de la Technologie
Définition de la Technologie:
Land degradation contributes to biodiversity loss and the impoverishment of rural livelihoods in Tusheti. Above all, however, land degradation are triggered by climate change as traditional land use practise might not be adapted to new climate conditions which can cause or speed up degradation processes significantly. On the other hand, degraded land often leads to low biomass volumes and this reduces the ecosystem capability to stabilise local climate conditions. The concept of Land Degradation Neutrality (LDN) and the method of using remote sensing for monitoring land degradation are tools to identify the need for local planning processes. This showcase describes the LDN monitoring concept, national targets and the technology to assess indicators, mechanism and incentives for LDN.
2.2 Description détaillée de la Technologie
Description:
Purpose
The continuing global degradation of land resources threatens food security and the functioning of ecosystem services by reducing or losing their biological or economic productivity. Unsustainable land-use practices such as deforestation, overgrazing and inappropriate agricultural management systems trigger the loss and degradation of valuable land resources in Georgia. These effects are visible in all countries of the South Caucasus. About 35% of the agricultural land in Georgia is severely degraded, 60% is of low to middle production quality.
Land Degradation Neutrality (LDN)
LDN is a new international concept to combat the ongoing degradation of valuable soil resources. The LDN concept was developed by the UNCCD to encourage countries to take measures to avoid, reduce or reverse land degradation, with the vision of achieving a zero-net loss of productive land. To combat land degradation in Georgia, in 2017, the national LDN Working Group set voluntary national targets to address specific aspects of LDN, and submitted them to the UNCCD Secretariat.
To effectively set up counter measures to combat land degradation it is important to have detailed spatial information on land cover and land cover changes as well as on trends in degradation (like size of areas effected by erosion). Therefore a remote sensing toolset was developed and tested in the pilot are of Tusheti protected landscapes in the High Caucasus in Georgia. This region shows increasing soil erosion problems by uneven distribution of grazing activities and was selected for developing erosion control measures within the Integrated Biodiversity Management in the South Caucasus Program (IBiS) funded by the Deutsche Gesellschaft für internationale Zusammenarbeit (GIZ).
Sensitivity Model
The Integrated Biodiversity Management in the South Caucasus (IBiS) project in cooperation with national experts in Georgia, developed and applied a remote sensing toolset called "Erosion Sensitivity Model". This remote sensing toolset helps to assess the current state and the general erosion risk. The sensitivity model is based on the RUSLE – Revised Universal Soil Loss Equation. The tool allows the calculation of erosion caused by rainfall and surface run-off. The RUSLE equation incorporates a combination of different input factors such as precipitation (R), soil type (K), slope (LS), vegetation cover (C) and protection measures (P). In this way, the estimated average soil loss in tonnes per acre per year (A) can be calculated as follows: A = R * K * LS * C * P.
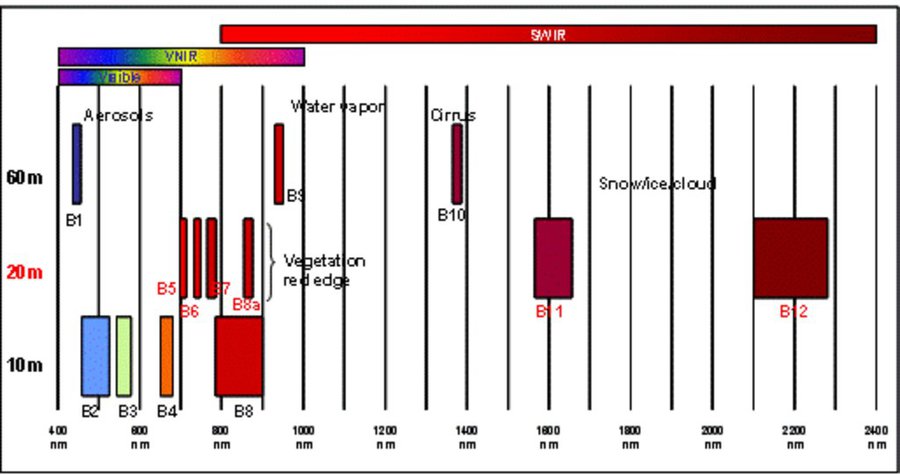
The rainfall factor (R) results from a quotient from the monthly and annual mean value of precipitation. The data come from the data platform “CHELSA – Climatologies at high resolution for the earth’s land surface areas”. For the soil type factor (K), a soil map of 1:200,000 was taken. Then, depending on the soil type, different contents of sand, silt, loam and clay were used to calculate the K factor. The slope length and steepness factor (LS) is calculated from a digital elevation model (DEM) with a raster resolution of 10x10m. The DEM is derived from the topographic map 1:25,000. The global elevation model derived from SRTM data (Shuttle Radar Topography Mission) has a resolution of 30x30 m and is available worldwide free of charge. The land cover factor (C) describes the vegetation cover that protects the soil from erosion. The vegetation cover slows down the speed of the raindrops and reduces the erosive effect of the rain. It slows down surface water runoff and stabilises the soil through root systems. The main indicators, land cover and productivity, can be assessed by remote sensing. The data from satellites need to be classified and calibrated by field data (ground truthing). The technology for the assessment of these indicators with Sentinel 2 satellite images was developed and applied in 2016 to 2018 in the Tusheti region (Akhmeta municipality) in the framework of the GIZ-IBiS project. Based on spectral information from airborne or satellite images, the density of the vegetation was calculated and mapped. There are well developed vegetation indices and classification systems to derive different land cover types and vegetation densities (mainly described by the Leaf Area Index LAI or biomass indices). The LAI is the area of the leaf surface (in square meters) per square meter ground surface. Since the real surface area of the leaves is hardly measurable, the amount of biomass is a proxy for the LAI. The P-factor is rarely considered in large-scale modelling of soil erosion risk as it is difficult to estimate it with very high accuracy. Therefore, to refine the model, a more detailed DEM (digital elevation model) is required (e.g., from satellite images). Based on the input factors, a soil erosion risk map was calculated for the whole territory of the Tusheti Protected Areas (113,660 ha). Based on the different spectral bands of the Sentinel 2 satellite image, a land cover map was calculated using the Support Vector Machine (SVM) technology and spectral image information.
The results have been integrated in the development of pasture management plans ("pasture passports"). This maps and documents are indicating areas of high erosion risk that need to be excluded from grazing and the maximum number of livestock has been calculated based on the biomass maps and will be integrated into the lease contracts.
The repetition of the remote sensing after some years (e.g. 5 years) will help to evaluate, if the measures in the pasture management have been successful to stop the degradation processes.
2.3 Photos de la Technologie
Galerie Médias
2.5 Pays/ région/ lieux où la Technologie a été appliquée et qui sont couverts par cette évaluation
Pays:
Géorgie
Région/ Etat/ Province:
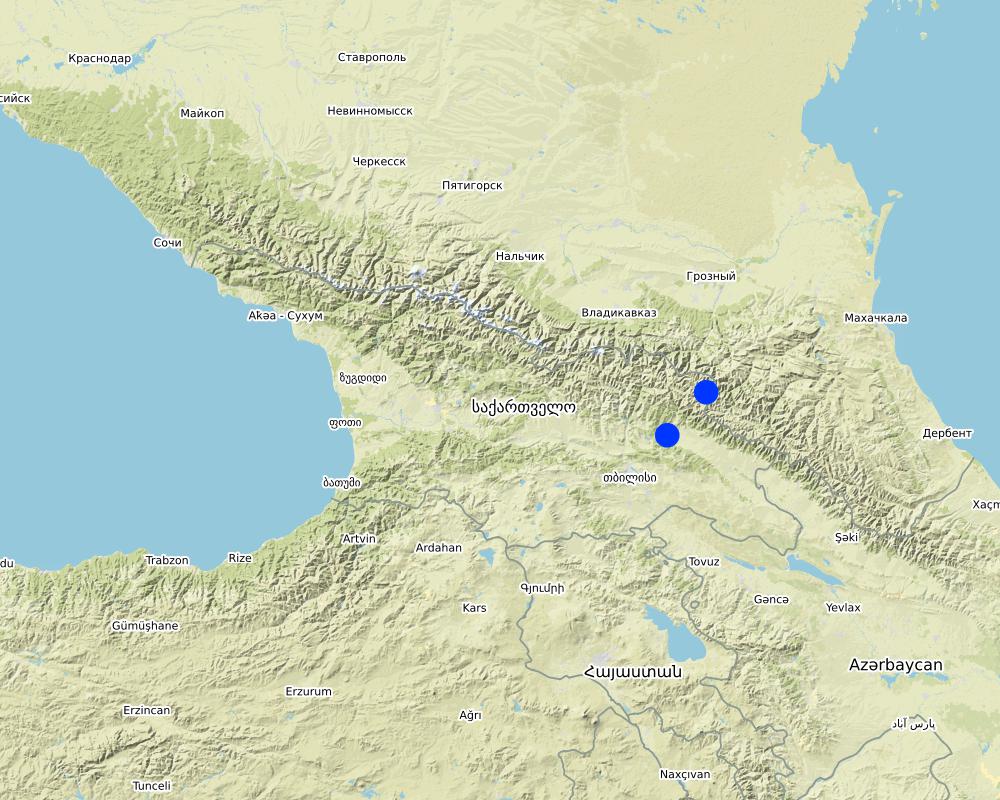
Tusheti region, Akhmeta municipality
Spécifiez la diffusion de la Technologie:
- répartie uniformément sur une zone
Si la Technologie est uniformément répartie sur une zone, précisez la superficie couverte (en km2):
1000,0
Est-ce que les sites dans lesquels la Technologie est appliquée sont situés dans des zones protégées en permanence?
Oui
Si oui, veuillez préciser:
The area is in the Tusheti Protected Areas (Tusheti Strict Nature Reserve, Tusheti National Park, Tusheti Protected Landscape).
Commentaires:
The whole territory was analysed by remote sensing and field records for calibration were collected on sample plots from different places in Tusheti.
Map
×2.6 Date de mise en œuvre de la Technologie
Indiquez l'année de mise en œuvre:
2016
2.7 Introduction de la Technologie
Spécifiez comment la Technologie a été introduite: :
- par le biais de projets/ d'interventions extérieures
3. Classification de la Technologie de GDT
3.1 Principal(aux) objectif(s) de la Technologie
- améliorer la production
- réduire, prévenir, restaurer les terres dégradées
- conserver/ améliorer la biodiversité
- provide information to make a spatial-territorial planning
3.2 Type(s) actuel(s) d'utilisation des terres, là où la Technologie est appliquée
Les divers types d'utilisation des terres au sein du même unité de terrain: :
Oui
Précisez l'utilisation mixte des terres (cultures/ pâturages/ arbres):
- Agropastoralisme (y compris les systèmes culture-élevage intégrés)

Terres cultivées
- Cultures annuelles
Cultures annuelles - Précisez les cultures:
- céréales - orge
- plantes à racines et à tubercules - pommes de terre
Nombre de période de croissance par an: :
- 1
Est-ce que les cultures intercalaires sont pratiquées?
Non
Est-ce que la rotation des cultures est appliquée?
Non

Pâturages
Pâturage extensif:
- Pastoralisme transhumant
Type d'animal:
- cattle - dairy and beef (e.g. zebu)
- ovins
Est-ce que la gestion intégrée cultures-élevage est pratiquée?
Non
3.3 Est-ce que l’utilisation des terres a changé en raison de la mise en œuvre de la Technologie ?
Est-ce que l’utilisation des terres a changé en raison de la mise en œuvre de la Technologie ?
- Non (Passez à la question 3.4)
3.4 Approvisionnement en eau
autre (par ex., post-inondation):
- rainfed and mixed rained-irrigation
3.5 Groupe de GDT auquel appartient la Technologie
- pastoralisme et gestion des pâturages
- Amélioration de la couverture végétale/ du sol
3.6 Mesures de GDT constituant la Technologie

modes de gestion
- M2: Changement du niveau de gestion / d'intensification

autres mesures
Précisez:
It is a monitoring technology to evaluate land management activities.
Commentaires:
On some pilot plots technologies to control erosion and stop land degradation have been tested. This includes fencing, rotational pasture management, mulching and installing check dams to stop gully erosion.
3.7 Principaux types de dégradation des terres traités par la Technologie

érosion hydrique des sols
- Wt: perte de la couche superficielle des sols (couche arable)/ érosion de surface
- Wg: ravinement/ érosion en ravines

dégradation physique des sols
- Pc: compaction

dégradation biologique
- Bc: réduction de la couverture végétale
- Bq: baisse de la quantité/ biomasse
Commentaires:
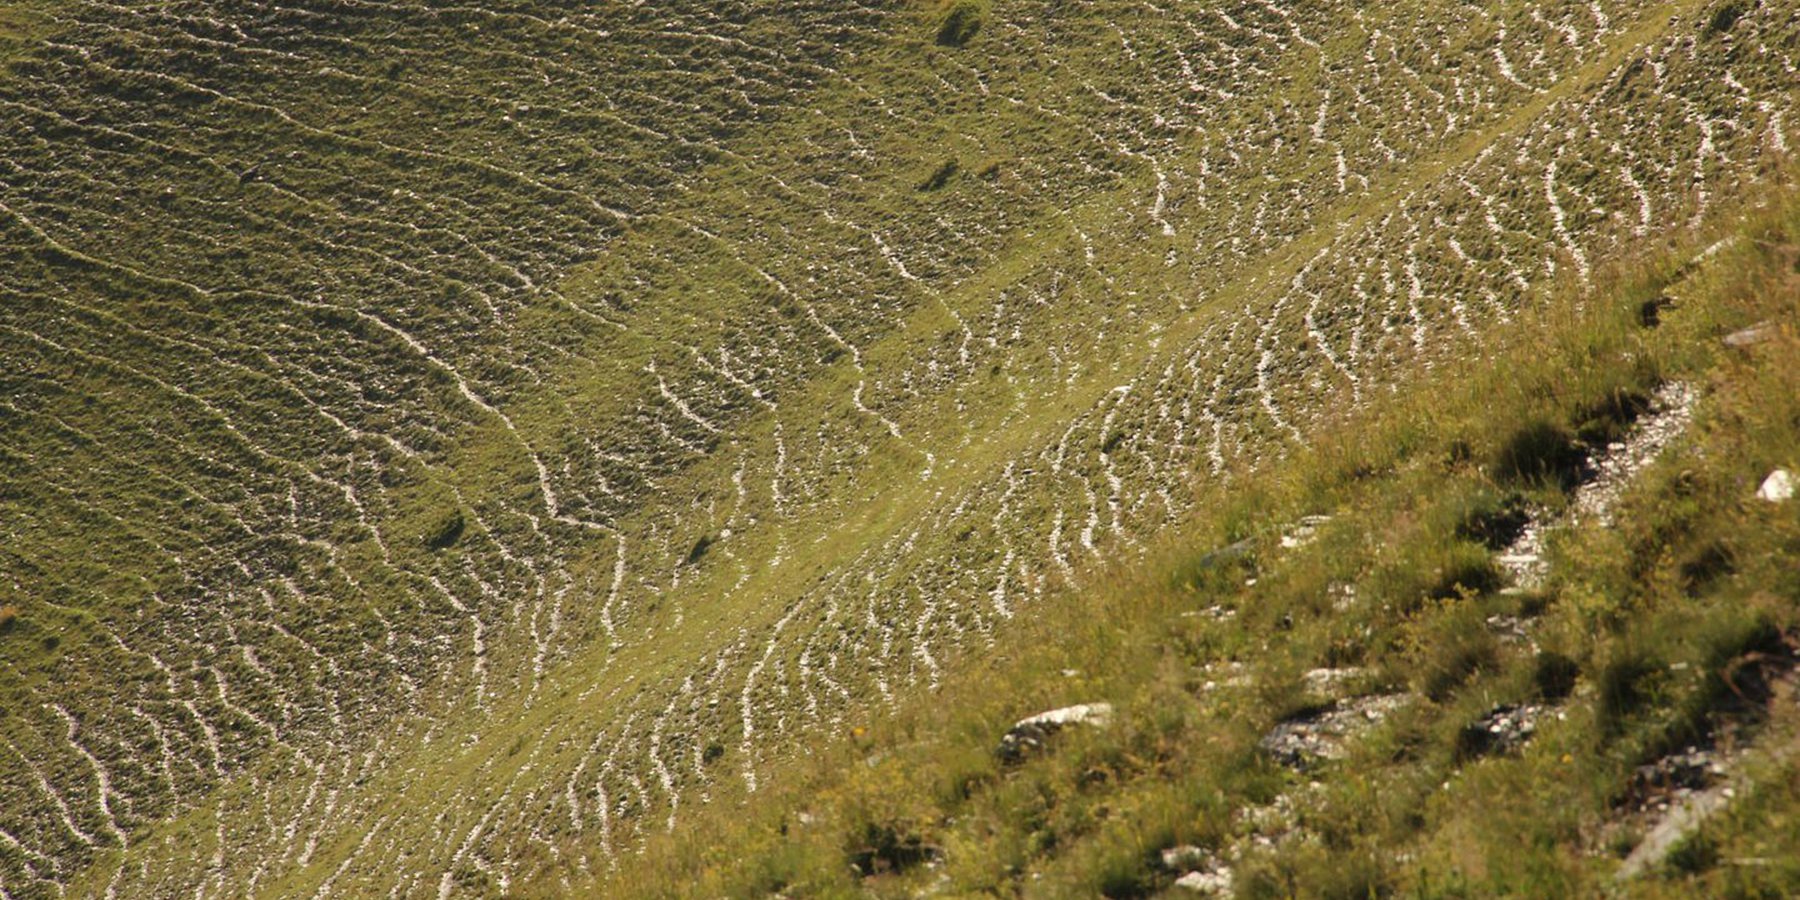
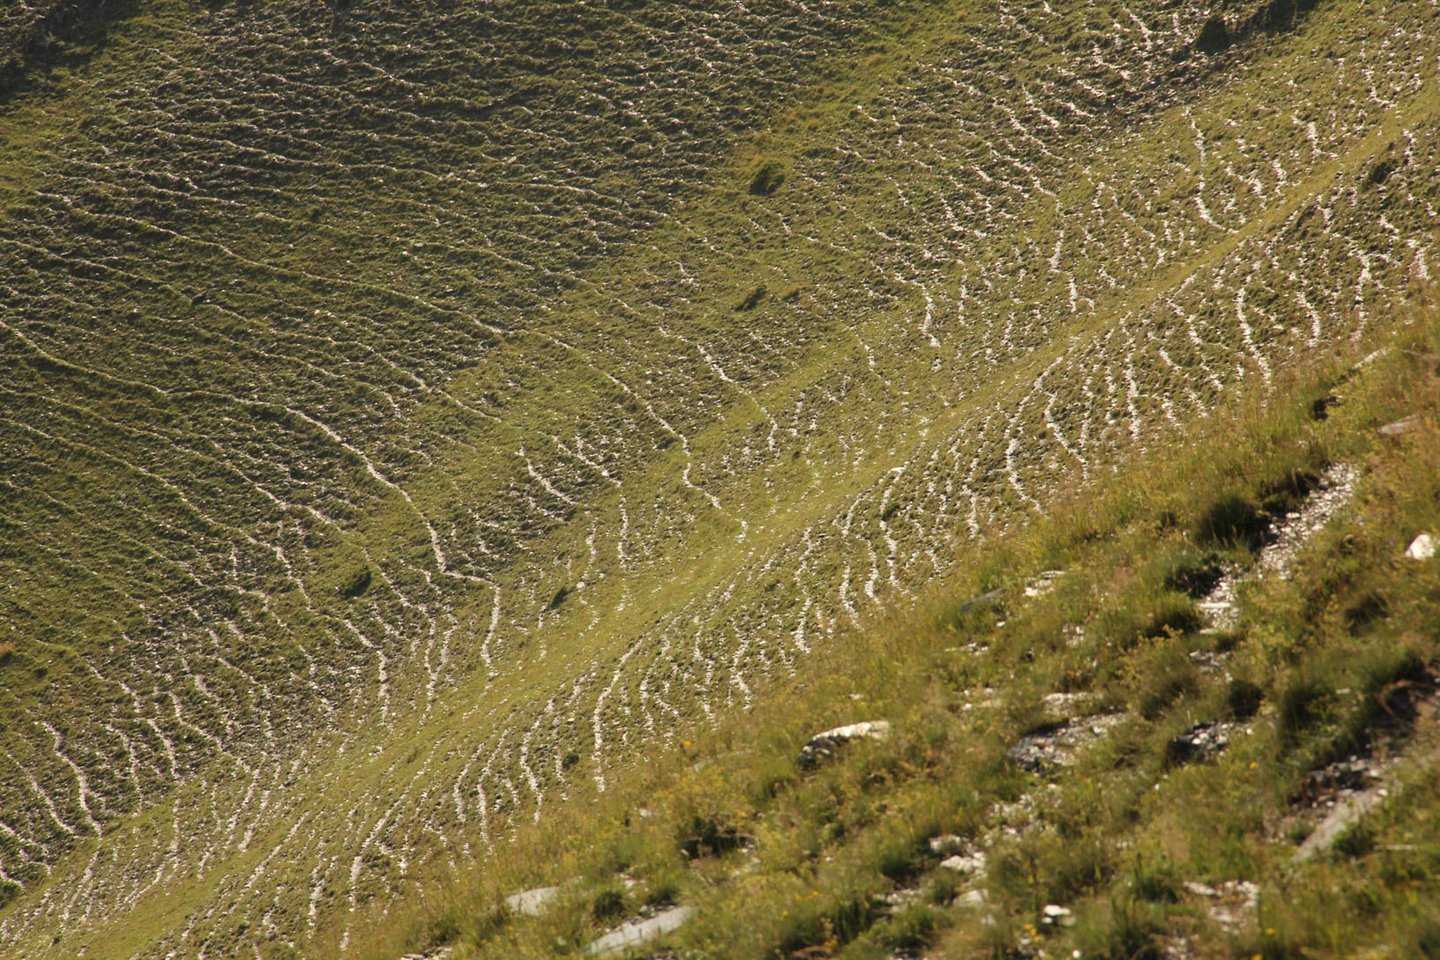
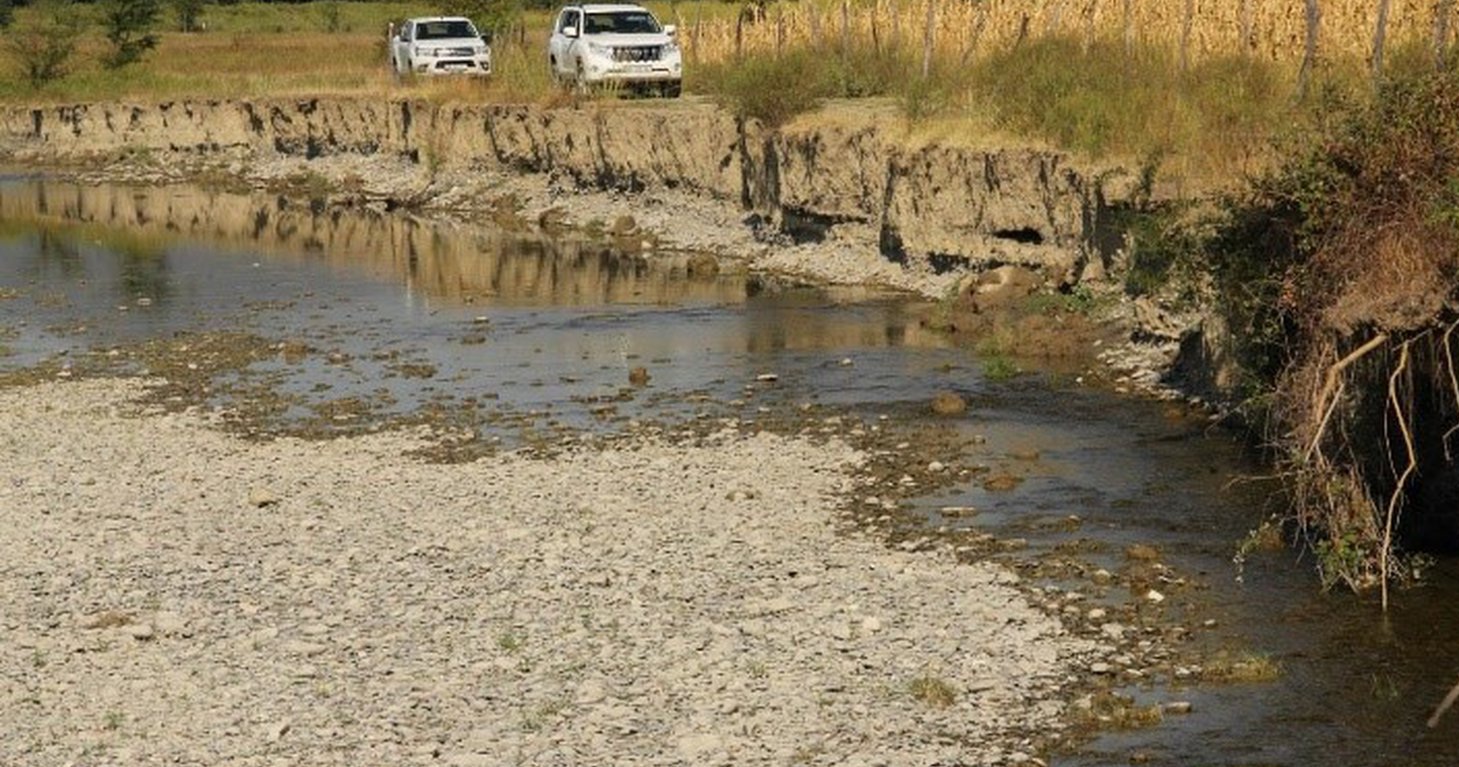
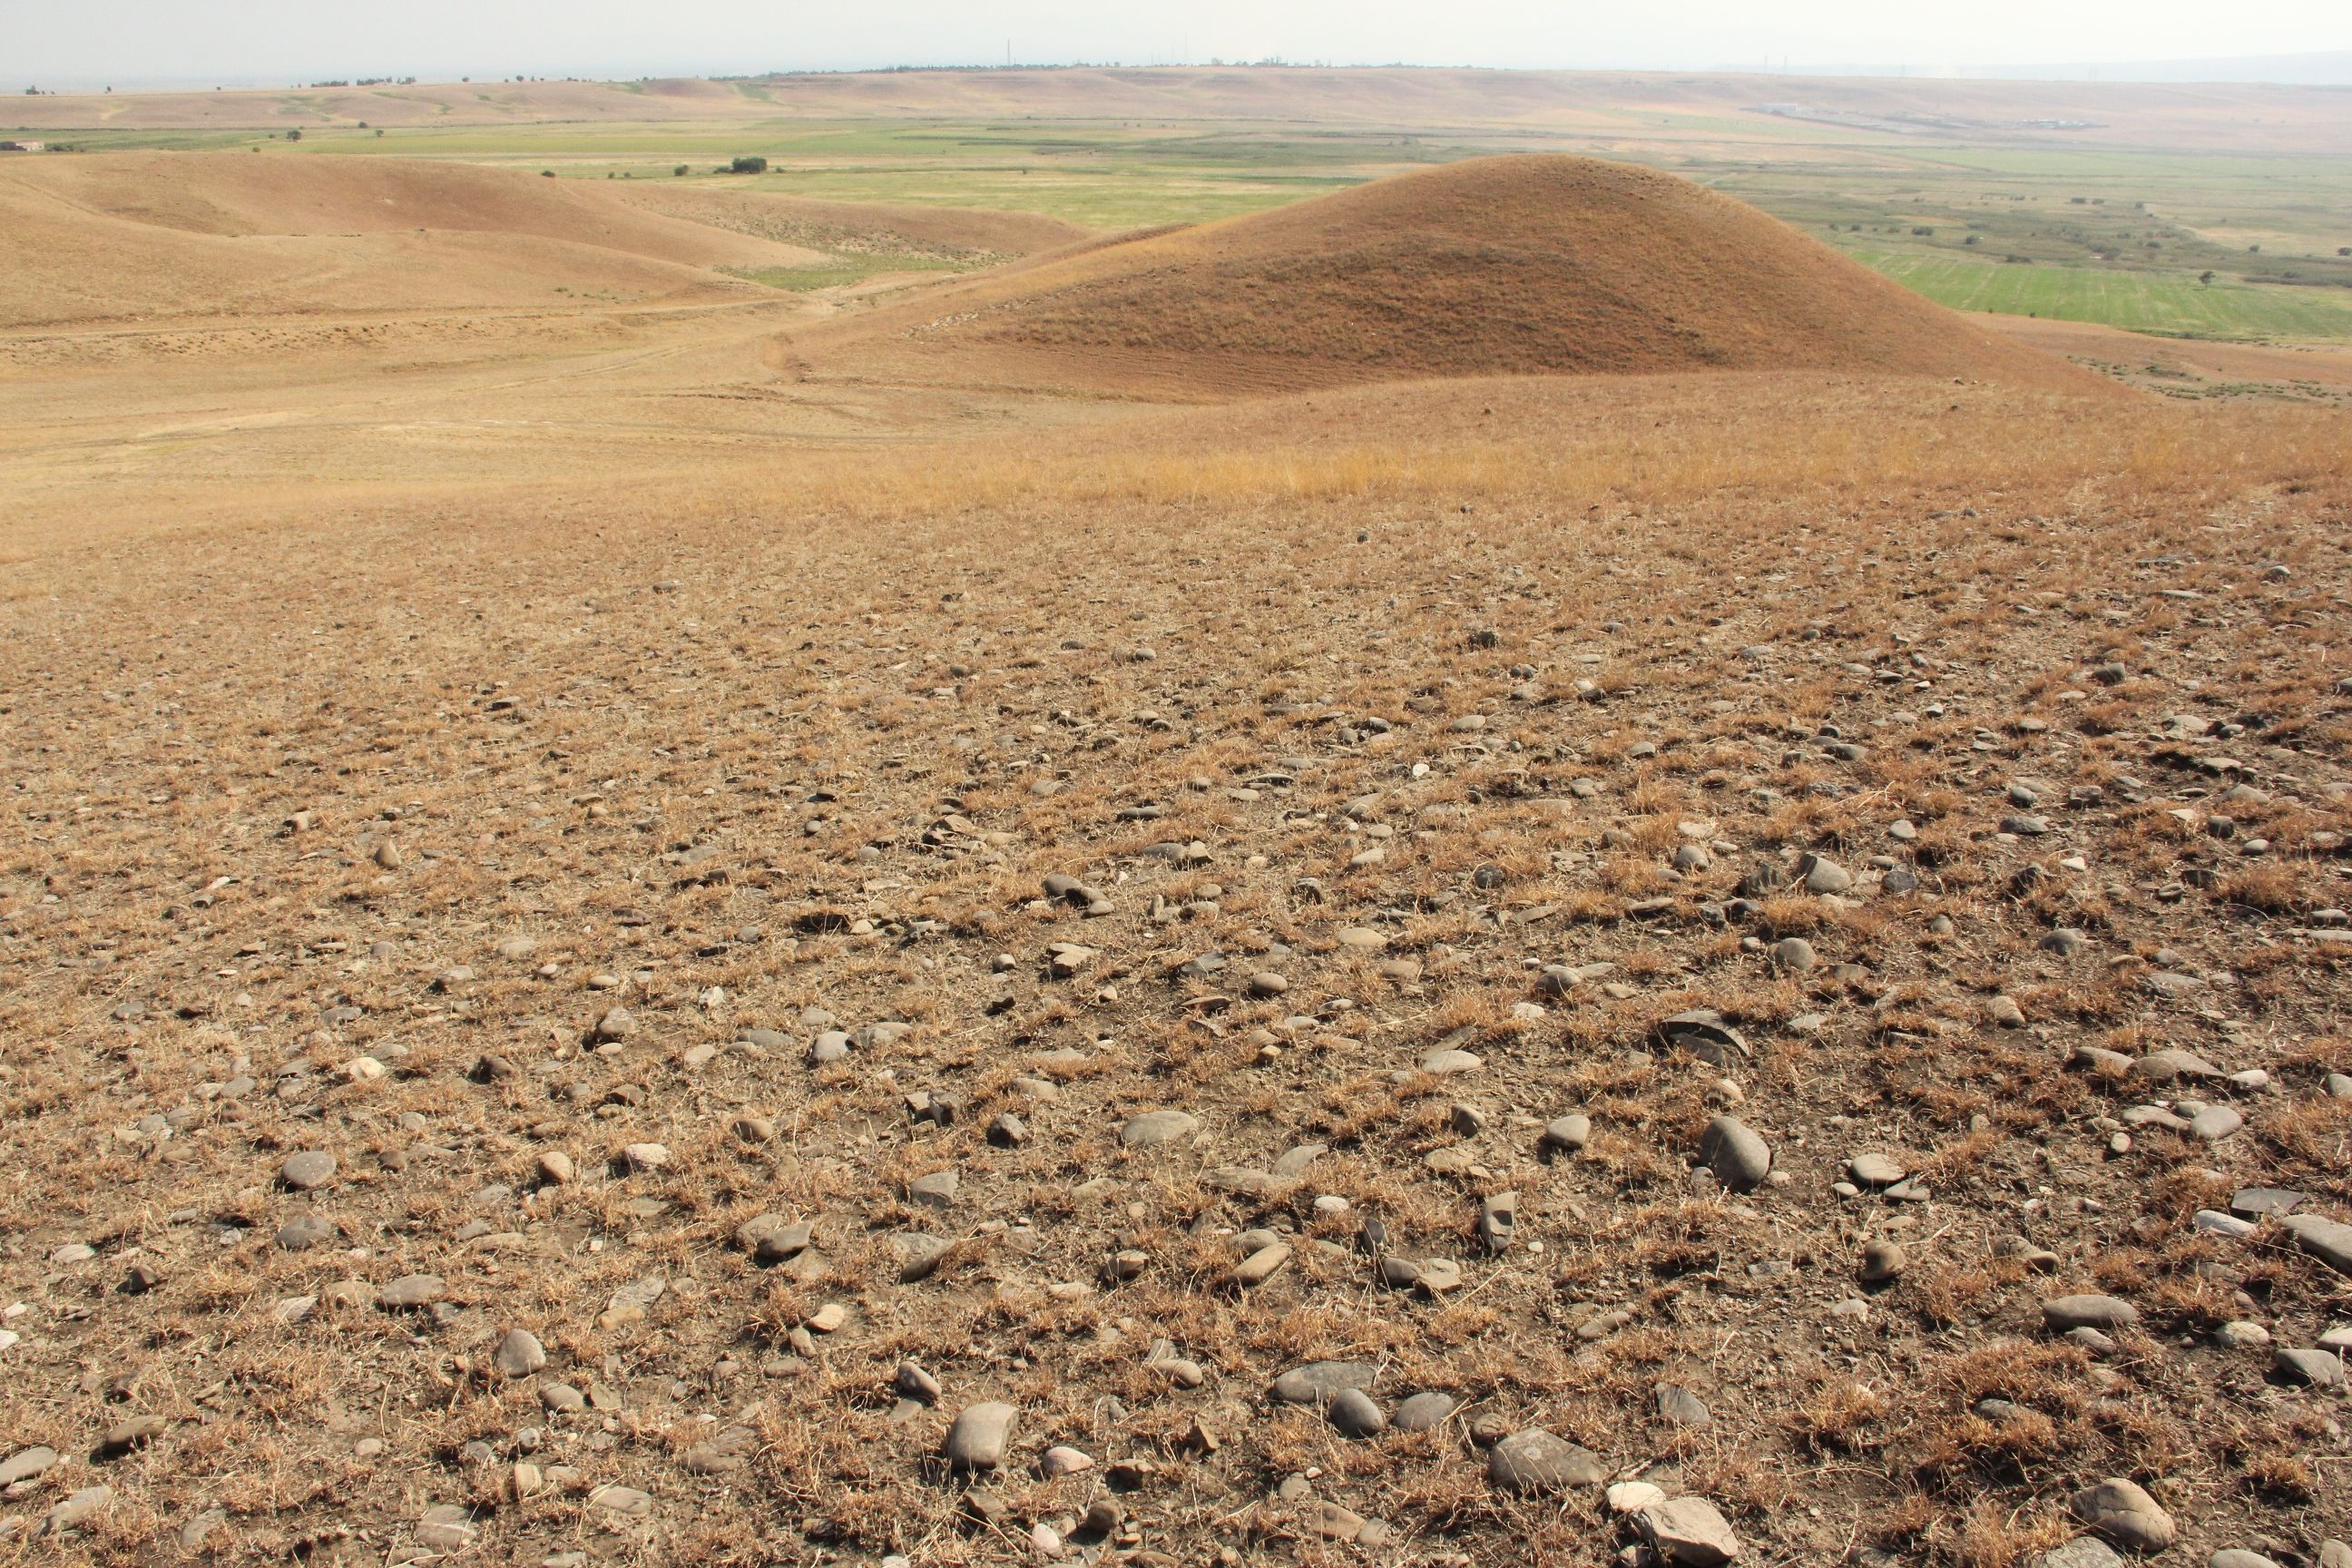
The main drivers of land degradation in the pilot area are overgrazing and trampling, off-road driving as well as infrastructure development (especially inappropriate road construction in steep slopes).
3.8 Prévention, réduction de la dégradation ou réhabilitation des terres dégradées
Spécifiez l'objectif de la Technologie au regard de la dégradation des terres:
- prévenir la dégradation des terres
- réduire la dégradation des terres
Commentaires:
The monitoring tools presented here help to monitor the development of land degradation and to evaluate measures and development trends.
4. Spécifications techniques, activités, intrants et coûts de mise en œuvre
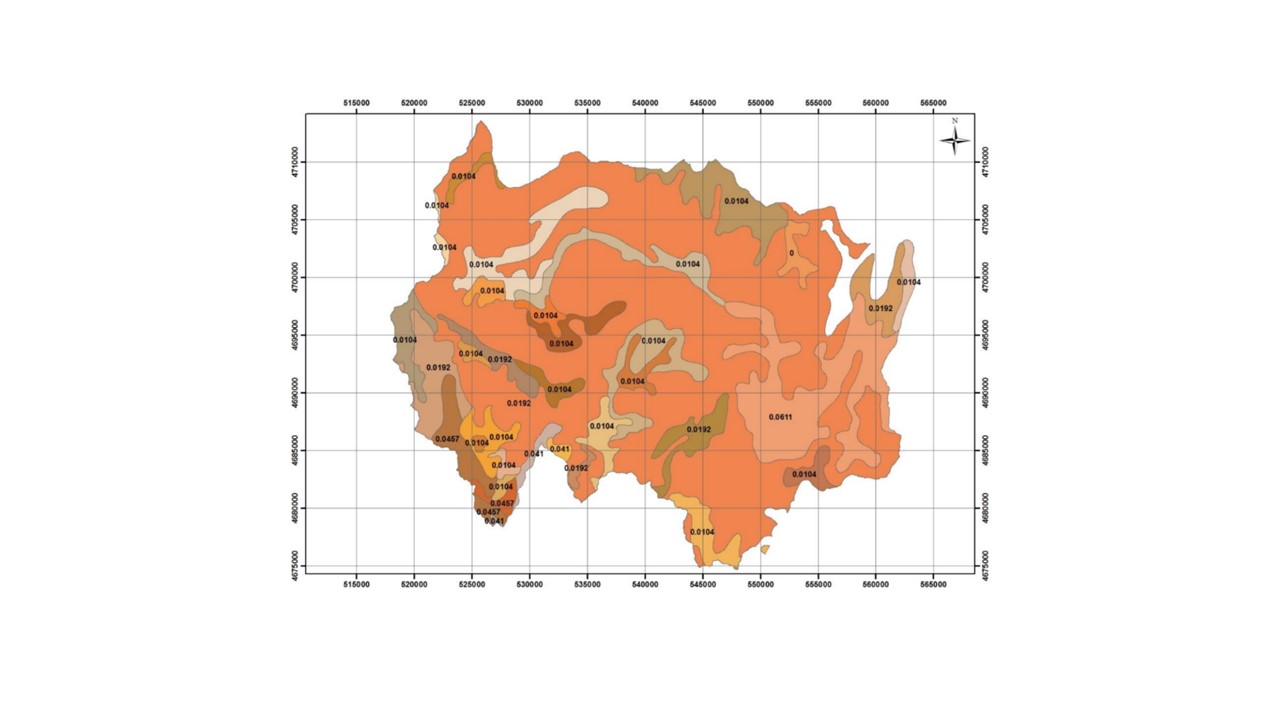
4.1 Dessin technique de la Technologie
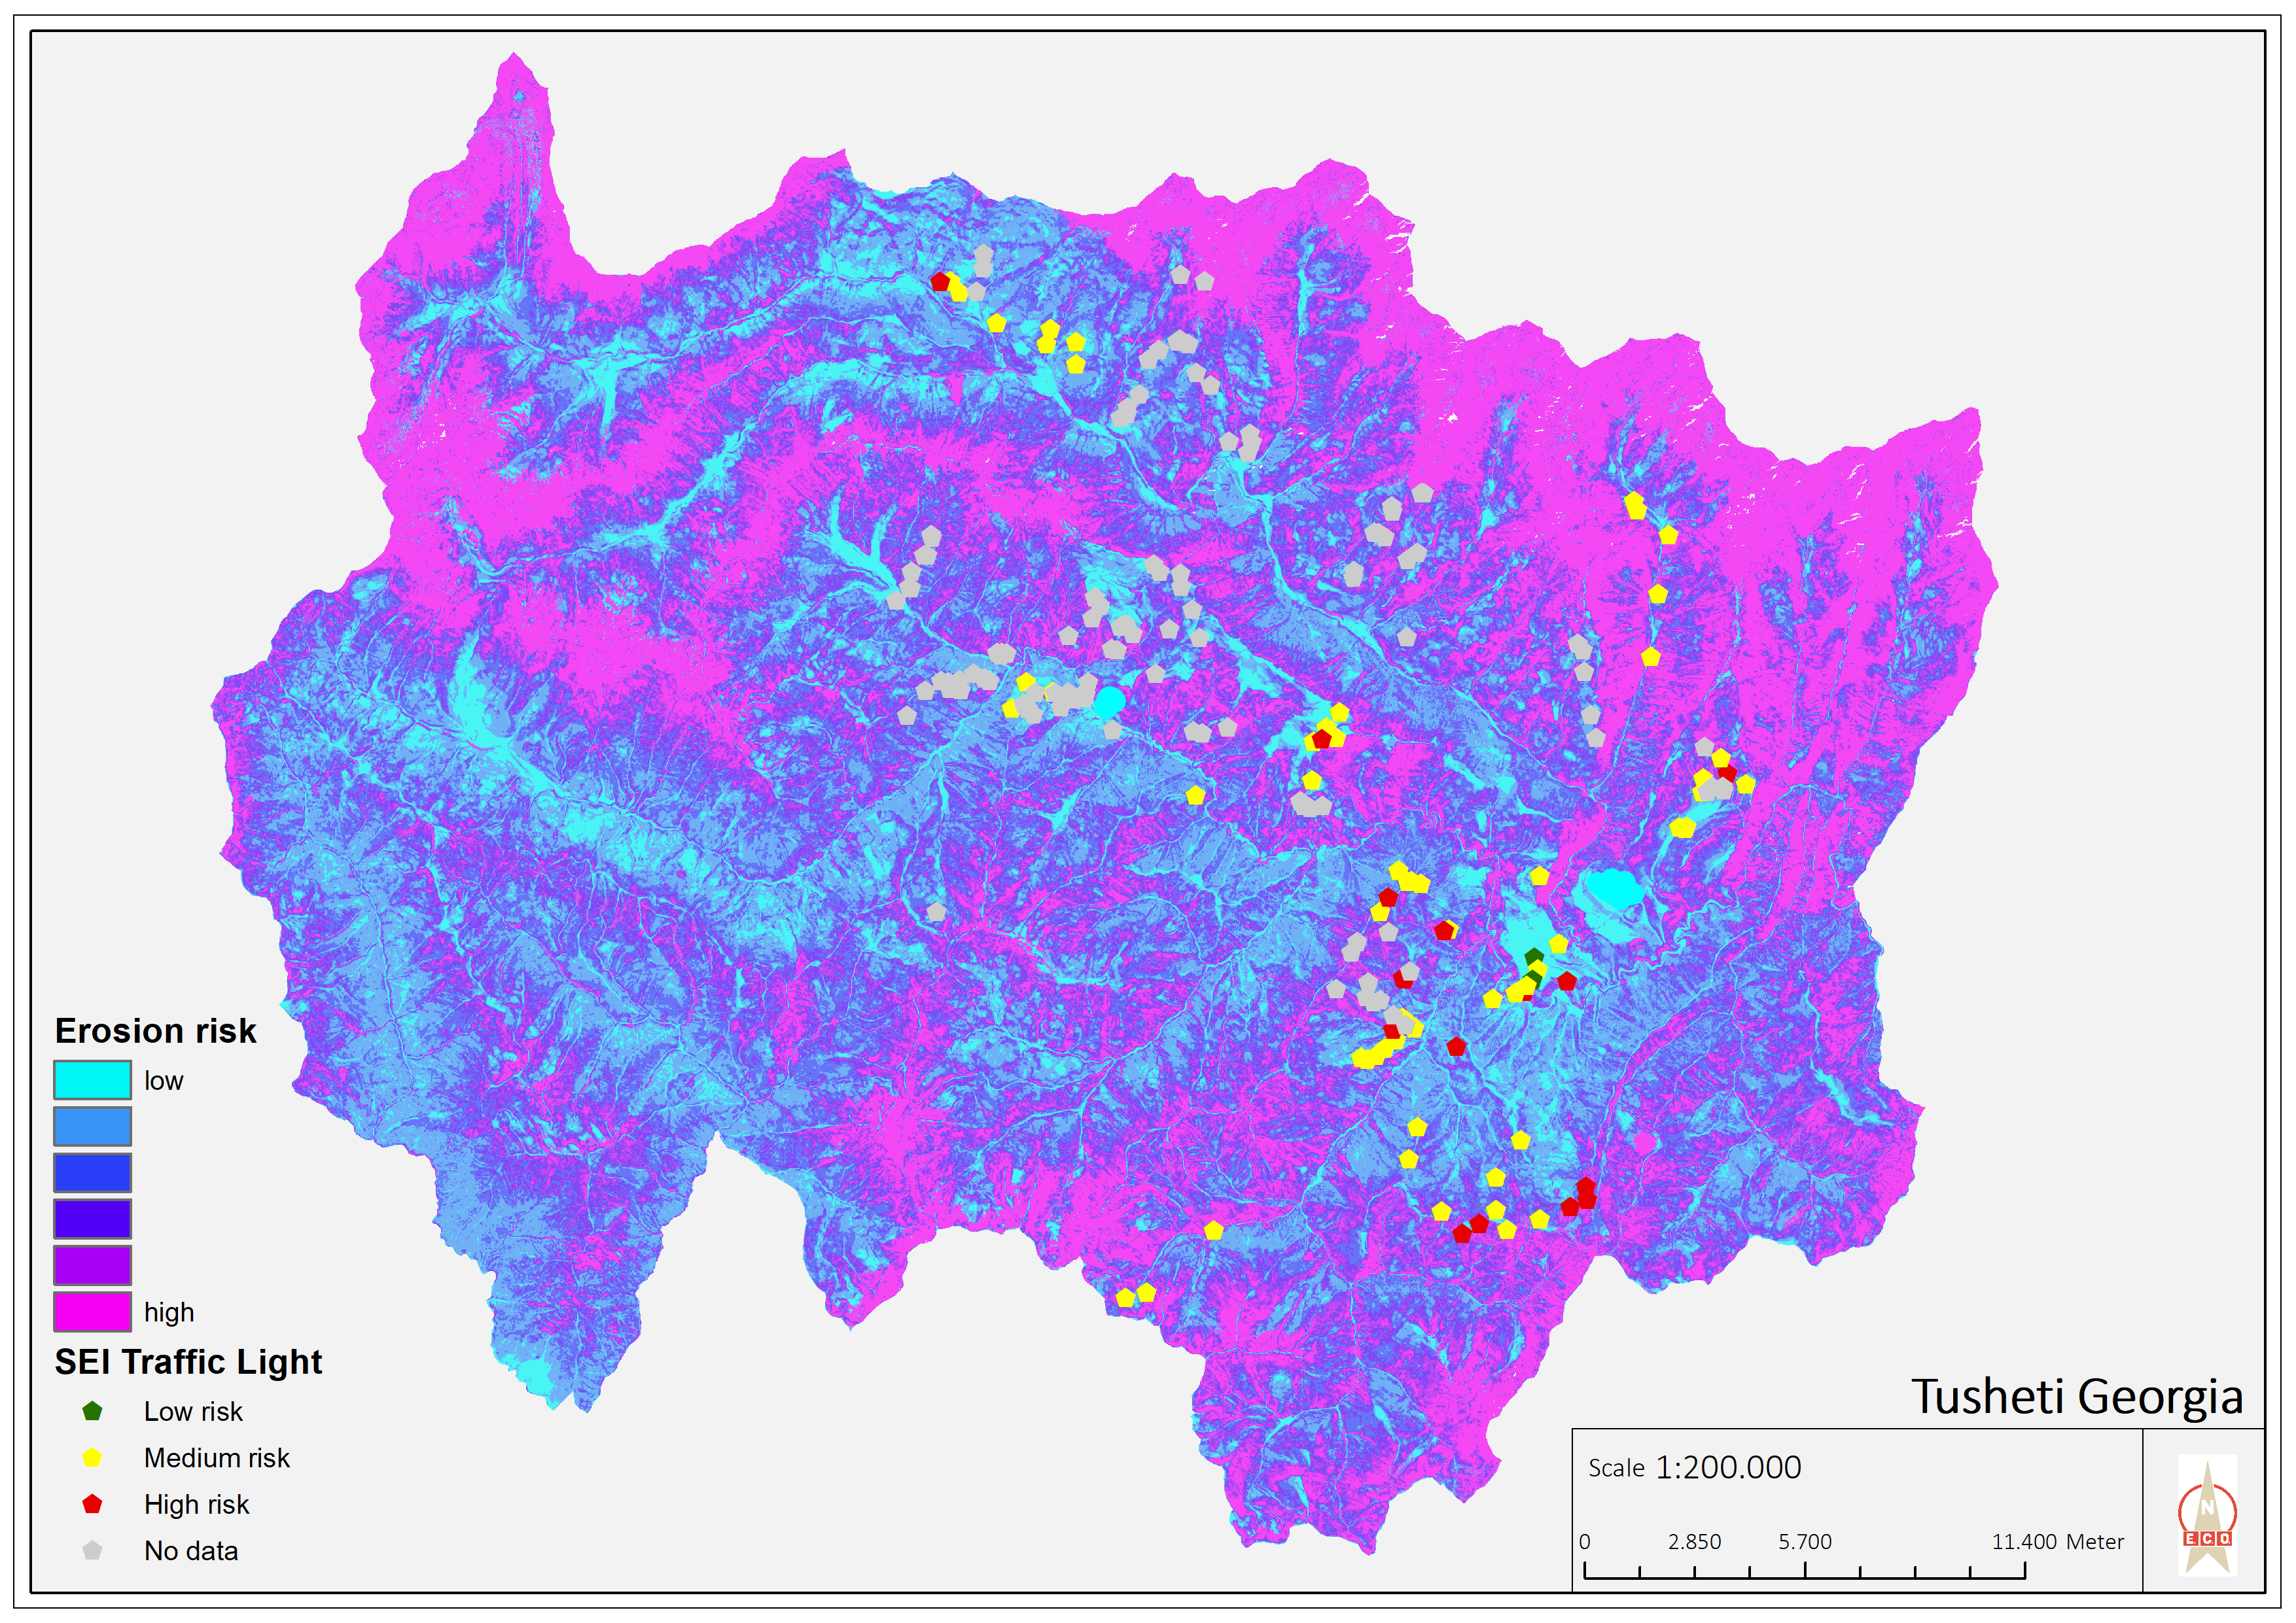
Spécifications techniques (associées au dessin technique):
Map of erosion hot spots (pink colour) and the location of field sample plots for evaluation and ground truthing.
Auteur:
Hanns Kirchmeir
Date:
11/09/2019
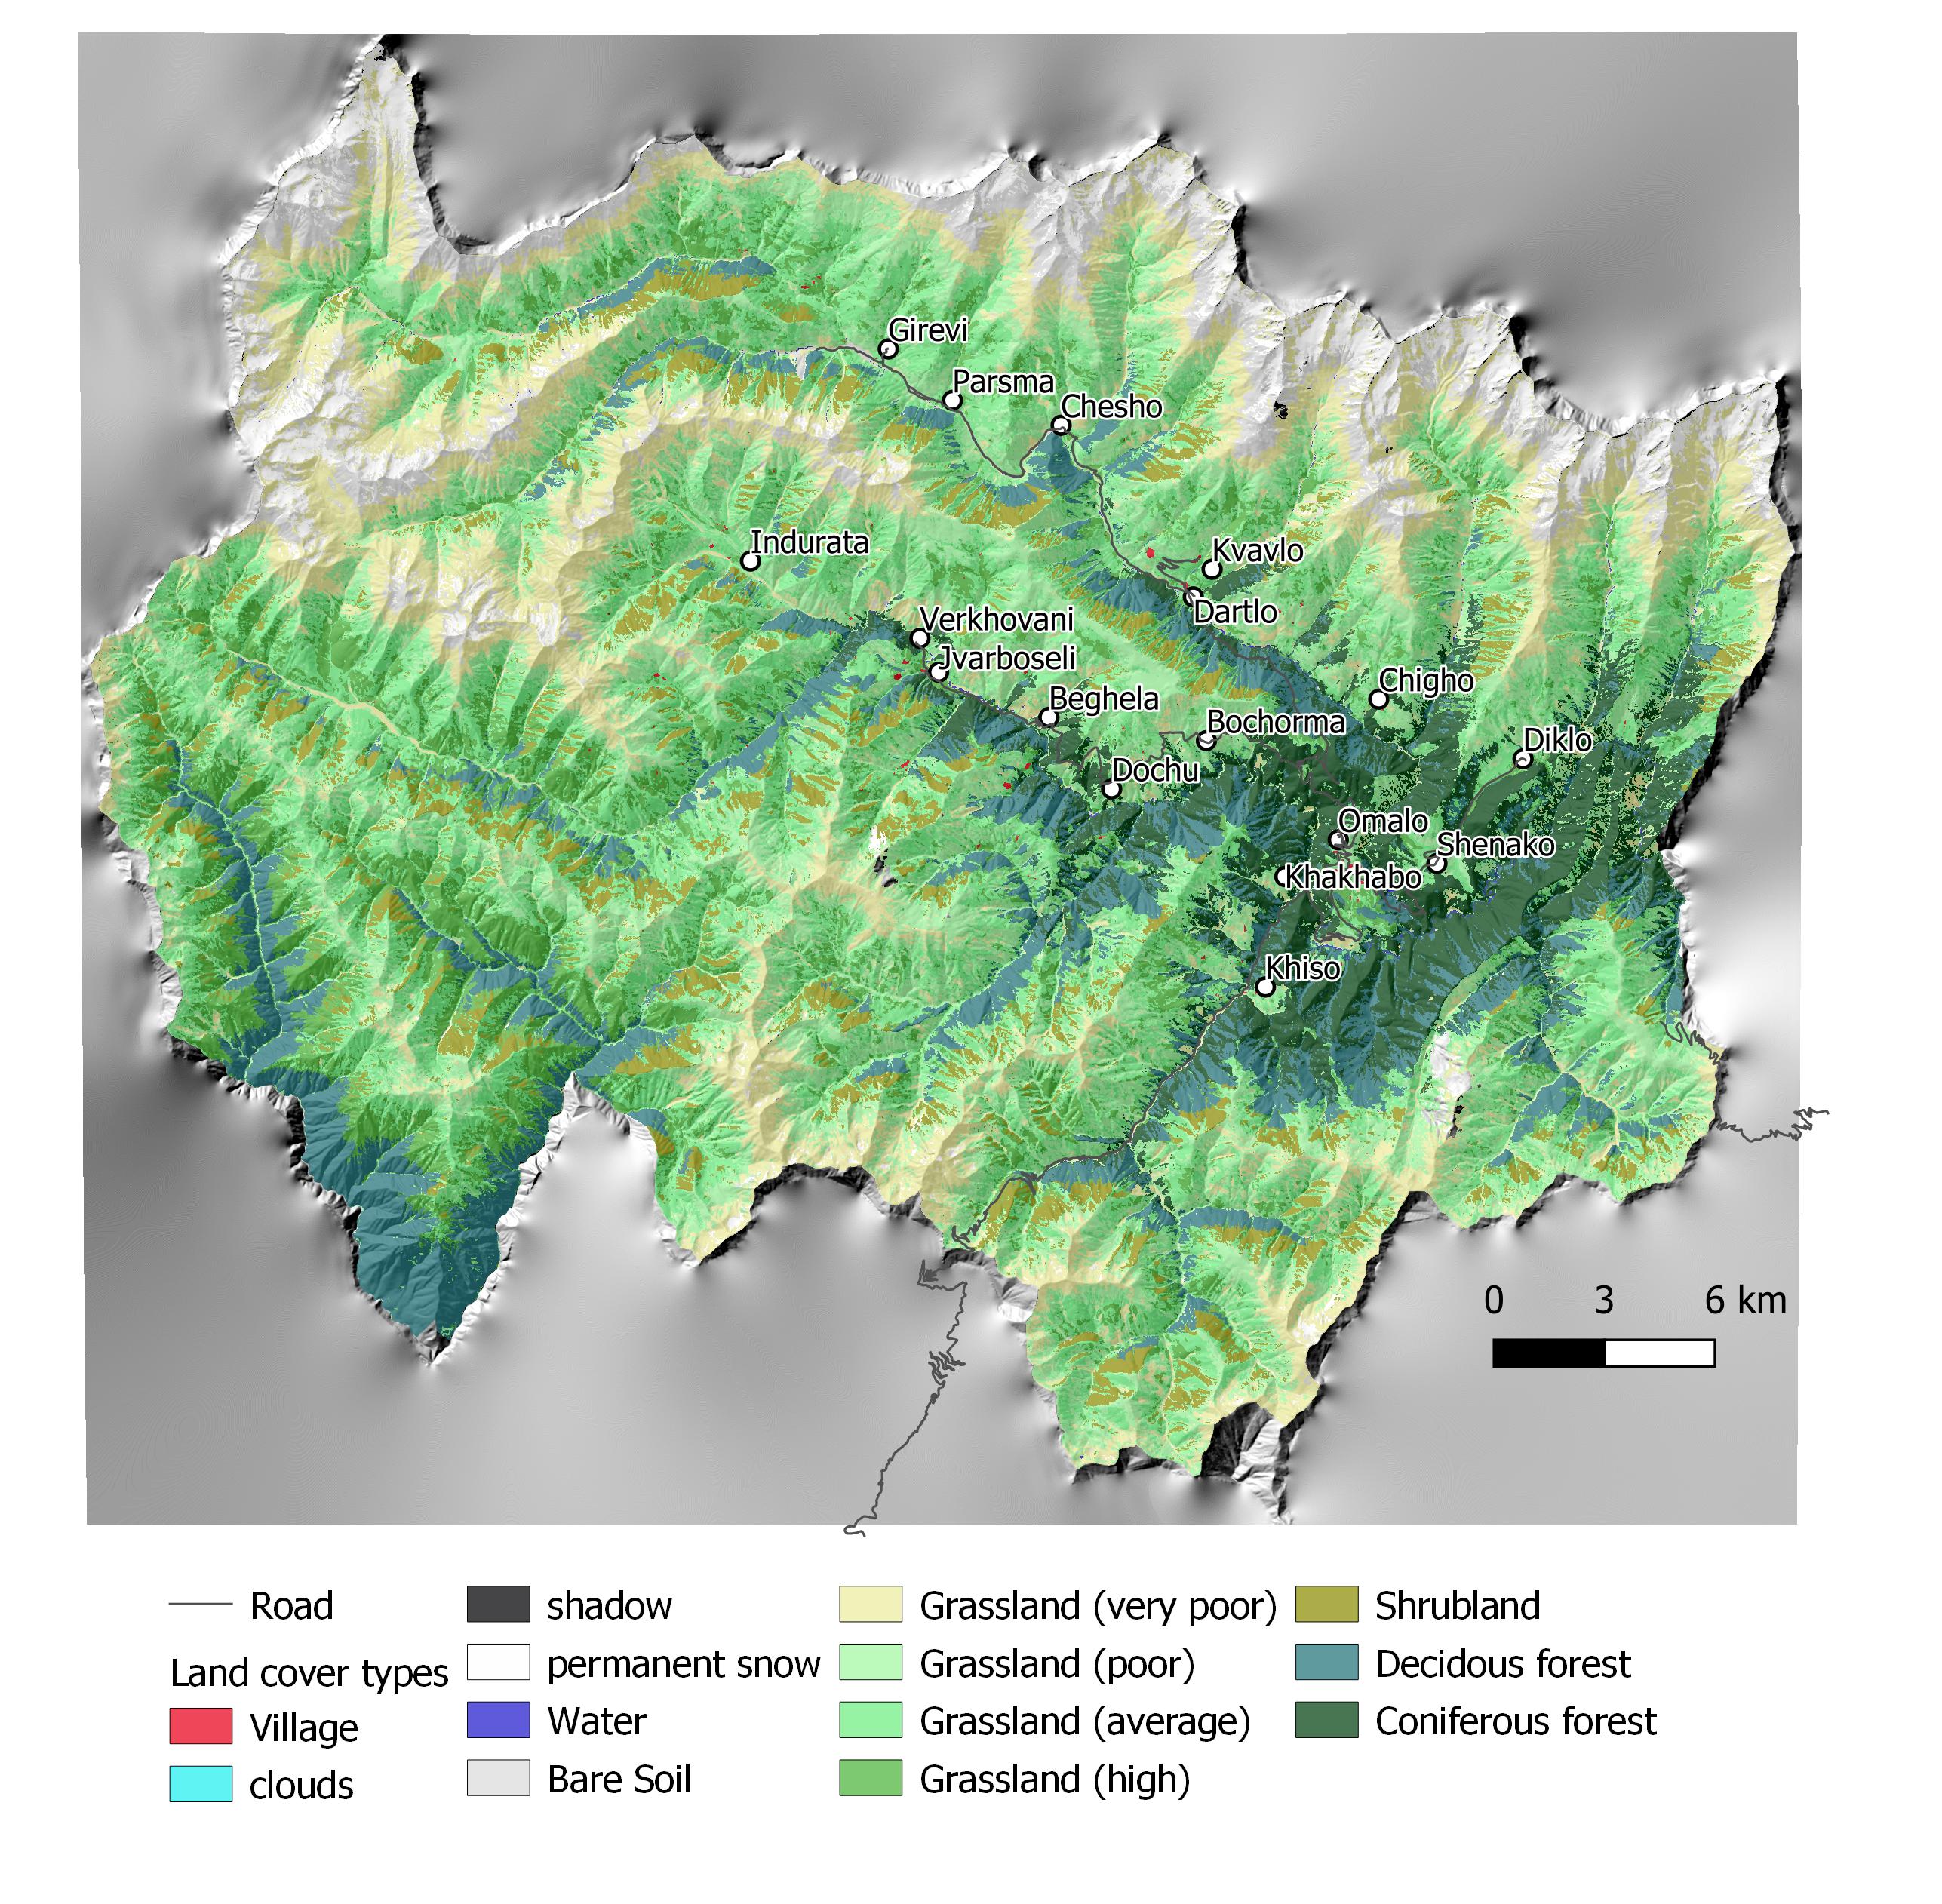
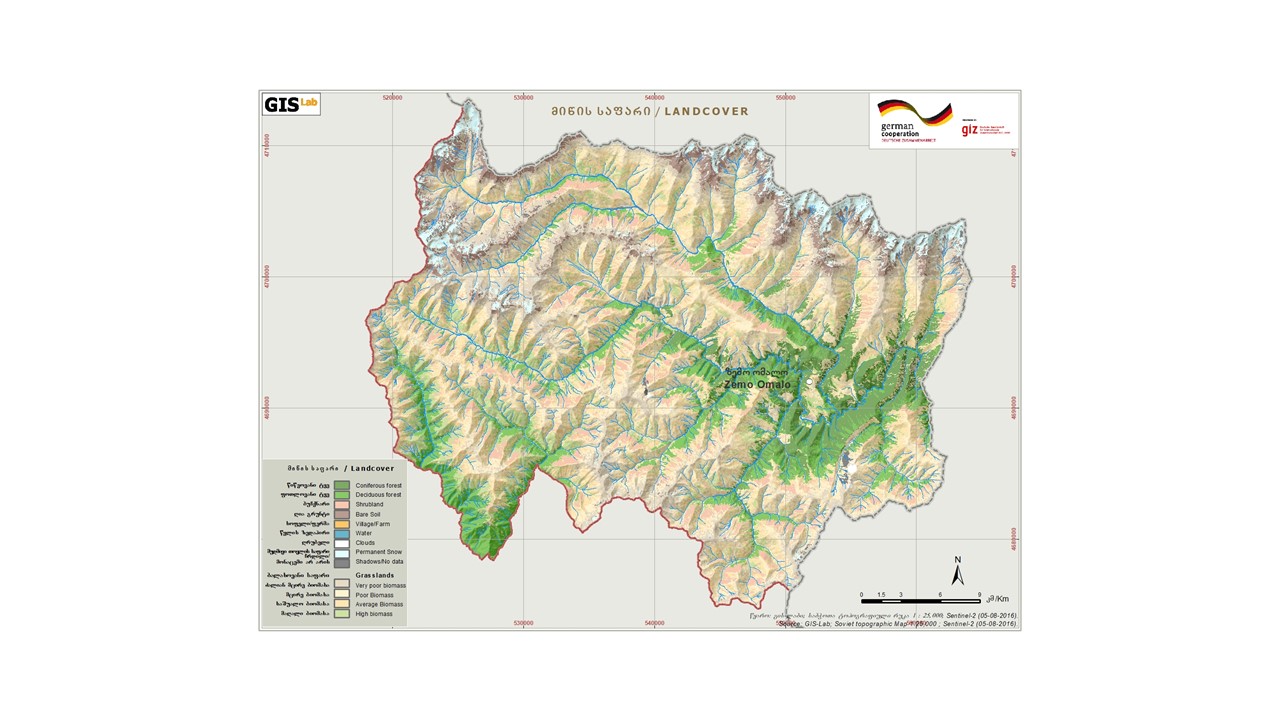
Spécifications techniques (associées au dessin technique):
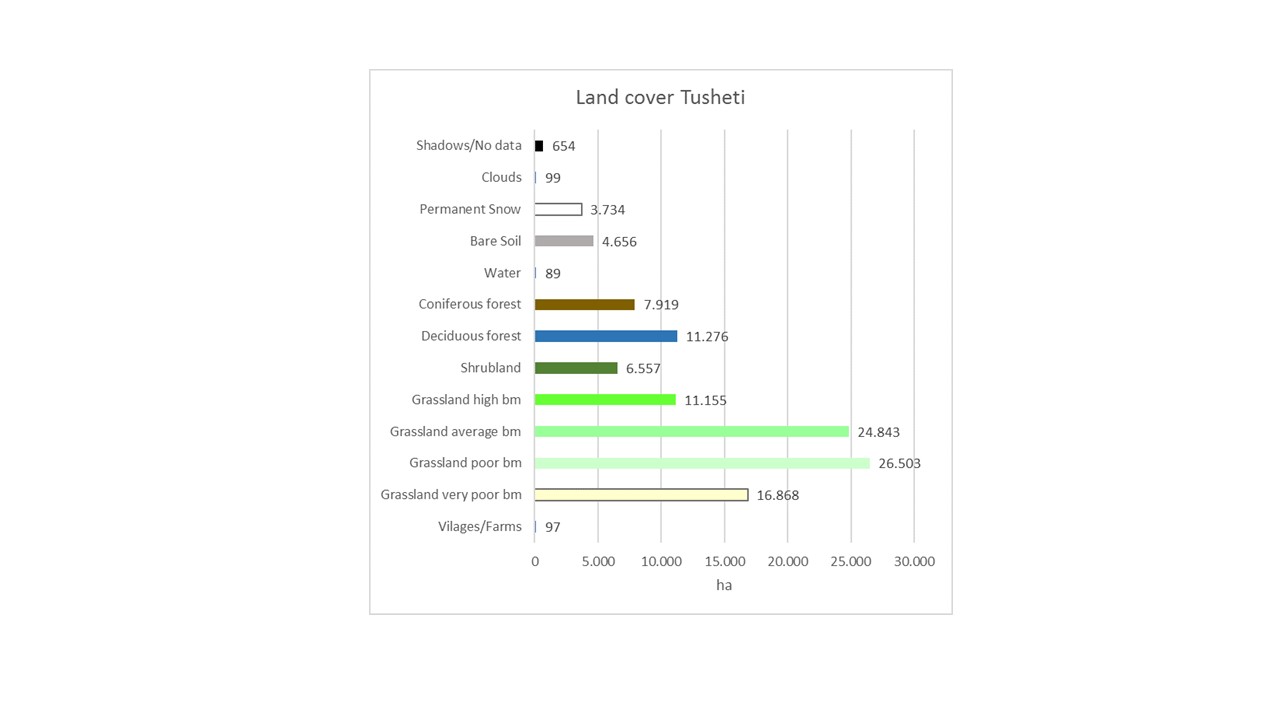
Map of land cover classification derived from satellite images. The different grassland types are classified by their biomass as an indicator of productivity and current state. Repeating the satellite image classification with the same parameters after 5 or 10 years can give a clear picture of changes in the land cover.
Auteur:
Hanns Kirchmeir
Date:
11/09/2019
4.2 Informations générales sur le calcul des intrants et des coûts
Spécifiez la manière dont les coûts et les intrants ont été calculés:
- par superficie de la Technologie
Indiquez la taille et l'unité de surface:
1000 km2
Indiquez la monnaie utilisée pour le calcul des coûts:
- dollars américains
Indiquez le coût salarial moyen de la main d'œuvre par jour:
100
4.3 Activités de mise en place/ d'établissement
| Activité | Calendrier des activités (saisonnier) | |
|---|---|---|
| 1. | National level. Baseline: Field assessment for remote sensing calibration (1x/20 years) | 2017 |
| 2. | Sentinel satellite image classification (multi temporal data from 2017) | 2017 |
| 3. | Statistical data from GEOSTAT Agricultural census | 2014-2016 |
| 4. | Analysis of soil carbon content from existing profiles | 2003 - 2006 |
| 5. | Conduct ongoing monitoring | 5 years intervals |
| 6. | Update sentinel satellite image classification | 1x year |
| 7. | Update statistical data from GEOSTAT Agricultural census | 4x/year |
| 8. | Resampling of soil carbon content near existing profiles | 1x/5 years |
| 9. | Municipal level. Spatial planning: Assessment of current stage of land degradation, anticipated gains and losses | 1x/10 years |
| 10. | Revision of spatial planning on Municipal level. | 1x / 5 years |
4.4 Coûts et intrants nécessaires à la mise en place
| Spécifiez les intrants | Unité | Quantité | Coûts par unité | Coût total par intrant | % du coût supporté par les exploitants des terres | |
|---|---|---|---|---|---|---|
| Main d'œuvre | Remote Sensing analysis by Sentinel Satellite data | person days | 50,0 | 200,0 | 10000,0 | |
| Main d'œuvre | Collecting field data for satellite image callibration | person days | 40,0 | 200,0 | 8000,0 | |
| Main d'œuvre | Soil sampling (for carbon content) | person days | 20,0 | 200,0 | 4000,0 | |
| Main d'œuvre | Including results in spatial planning | person days | 10,0 | 200,0 | 2000,0 | |
| Coût total de mise en place de la Technologie | 24000,0 | |||||
| Coût total de mise en place de la Technologie en dollars américains (USD) | 24000,0 | |||||
Commentaires:
This covers the implementation of the baseline. Calibrating the model for erosion risk and land cover classification is an big investment but can be extended to larger areas than 1000 km² with similar resources.
4.5 Activités d'entretien/ récurrentes
| Activité | Calendrier/ fréquence | |
|---|---|---|
| 1. | Repeating the application of the calibrated remote sensing model for monitoring repitition | with 5 years interval |
| 2. | Repetition of soil samples for assessing soil carbon content | with 5 years interval |
| 3. | Analysing the results and integrate them in spatial planning and policy making | with 5 years interval |
4.6 Coûts et intrants nécessaires aux activités d'entretien/ récurrentes (par an)
| Spécifiez les intrants | Unité | Quantité | Coûts par unité | Coût total par intrant | % du coût supporté par les exploitants des terres | |
|---|---|---|---|---|---|---|
| Main d'œuvre | Applying the calibrated remote sensing model for monitoring repetition | person days | 20,0 | 200,0 | 4000,0 | |
| Main d'œuvre | Repetition of soil samples for assessing soil carbon content | person days | 10,0 | 200,0 | 2000,0 | |
| Main d'œuvre | Analysing results and integrating in spatial planning | person days | 10,0 | 200,0 | 2000,0 | |
| Coût total d'entretien de la Technologie | 8000,0 | |||||
| Coût total d'entretien de la Technologie en dollars américains (USD) | 8000,0 | |||||
Commentaires:
For the repetition of the remote sensing no new calibration of the GIS-model is needed. Only the field samples for soil carbon need to be repeated.
4.7 Facteurs les plus importants affectant les coûts
Décrivez les facteurs les plus importants affectant les coûts :
Field sample collection;
Remote sensing experts.
5. Environnement naturel et humain
5.1 Climat
Précipitations annuelles
- < 250 mm
- 251-500 mm
- 501-750 mm
- 751-1000 mm
- 1001-1500 mm
- 1501-2000 mm
- 2001-3000 mm
- 3001-4000 mm
- > 4000 mm
Spécifiez la pluviométrie moyenne annuelle (si connue), en mm:
800,00
Spécifications/ commentaires sur les précipitations:
The climate is generally suitable for agriculture with an annual precipitation of up to 800 mm, with hot and humid springs, rainfall peaks in May and June with hot and dry summers.
Zone agro-climatique
- subhumide
- semi-aride
5.2 Topographie
Pentes moyennes:
- plat (0-2 %)
- faible (3-5%)
- modéré (6-10%)
- onduleux (11-15%)
- vallonné (16-30%)
- raide (31-60%)
- très raide (>60%)
Reliefs:
- plateaux/ plaines
- crêtes
- flancs/ pentes de montagne
- flancs/ pentes de colline
- piémonts/ glacis (bas de pente)
- fonds de vallée/bas-fonds
Zones altitudinales:
- 0-100 m
- 101-500 m
- 501-1000 m
- 1001-1500 m
- 1501-2000 m
- 2001-2500 m
- 2501-3000 m
- 3001-4000 m
- > 4000 m
Indiquez si la Technologie est spécifiquement appliquée dans des:
- non pertinent
Commentaires et précisions supplémentaires sur la topographie:
The remote sensing approach was applied for the total landscape of Tusheti, including a great variety of land-forms, altitudes ranging from 1600-4000 m a.s.l.
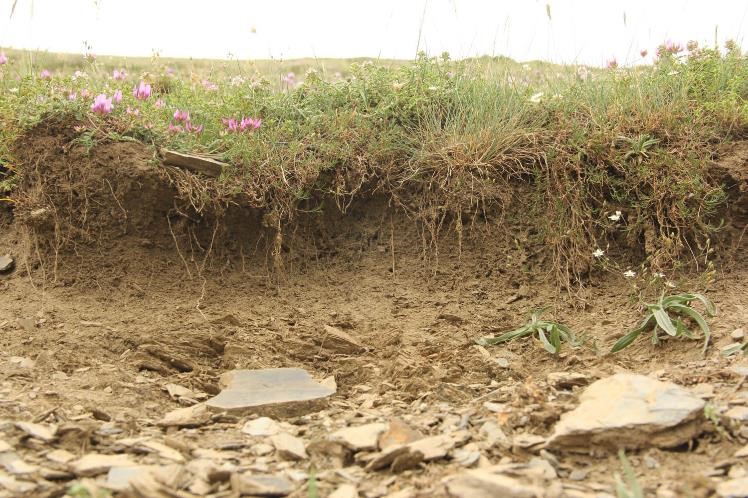
5.3 Sols
Profondeur moyenne du sol:
- très superficiel (0-20 cm)
- superficiel (21-50 cm)
- modérément profond (51-80 cm)
- profond (81-120 cm)
- très profond (>120 cm)
Texture du sol (de la couche arable):
- moyen (limoneux)
Texture du sol (> 20 cm sous la surface):
- moyen (limoneux)
Matière organique de la couche arable:
- moyen (1-3%)
5.4 Disponibilité et qualité de l'eau
Profondeur estimée de l’eau dans le sol:
en surface
Disponibilité de l’eau de surface:
moyenne
Qualité de l’eau (non traitée):
faiblement potable (traitement nécessaire)
La qualité de l'eau fait référence à:
à la fois les eaux souterraines et de surface
La salinité de l'eau est-elle un problème? :
Non
La zone est-elle inondée?
Non
5.5 Biodiversité
Diversité des espèces:
- moyenne
Diversité des habitats:
- élevé
5.6 Caractéristiques des exploitants des terres appliquant la Technologie
Sédentaire ou nomade:
- Semi-nomade
Orientation du système de production:
- exploitation mixte (de subsistance/ commerciale)
Revenus hors exploitation:
- moins de 10% de tous les revenus
Niveau relatif de richesse:
- pauvre
Individus ou groupes:
- individu/ ménage
Niveau de mécanisation:
- travail manuel
- traction animale
Genre:
- femmes
- hommes
Age des exploitants des terres:
- personnes d'âge moyen
Indiquez toute autre caractéristique pertinente des exploitants des terres:
The technology is applied by the Government.
5.7 Superficie moyenne des terres utilisées par les exploitants des terres appliquant la Technologie
- < 0,5 ha
- 0,5-1 ha
- 1-2 ha
- 2-5 ha
- 5-15 ha
- 15-50 ha
- 50-100 ha
- 100-500 ha
- 500-1 000 ha
- 1 000-10 000 ha
- > 10 000 ha
Cette superficie est-elle considérée comme de petite, moyenne ou grande dimension (en se référant au contexte local)?
- moyenne dimension
Commentaires:
The pasture units are fom 200 to 600 hectares and are based on the old Soviet grazing scheme.
5.8 Propriété foncière, droits d’utilisation des terres et de l'eau
Propriété foncière:
- état
Droits d’utilisation des terres:
- communautaire (organisé)
- loué
Droits d’utilisation de l’eau:
- accès libre (non organisé)
Est-ce que les droits d'utilisation des terres sont fondés sur un système juridique traditionnel?
Non
5.9 Accès aux services et aux infrastructures
santé:
- pauvre
- modéré
- bonne
éducation:
- pauvre
- modéré
- bonne
assistance technique:
- pauvre
- modéré
- bonne
emploi (par ex. hors exploitation):
- pauvre
- modéré
- bonne
marchés:
- pauvre
- modéré
- bonne
énergie:
- pauvre
- modéré
- bonne
routes et transports:
- pauvre
- modéré
- bonne
eau potable et assainissement:
- pauvre
- modéré
- bonne
services financiers:
- pauvre
- modéré
- bonne
6. Impacts et conclusions
6.1 Impacts sur site que la Technologie a montrés
Impacts écologiques
Sols
couverture du sol
Commentaires/ spécifiez:
Within the timeframe until 2030, specific process indicators to assess the progress will be done.
Autres impacts écologiques
Changes in the quality of forests
Commentaires/ spécifiez:
tree height, stand density
Changes of the quality of pastures
Commentaires/ spécifiez:
biomass production
Changes in the quality of arable land
Commentaires/ spécifiez:
yield
Précisez l'évaluation des impacts sur site (sous forme de mesures):
The monitoring technology was applied for the first time to draw a baseline. Based on the results, activities have been planned and pilot measures have been implemented (exclusion from grazing, reforestation, regulation of grazing intensity). Future replications of the monitoring will show changes and evaluate success of measures. The technologies to control erosion are described separately in the WOCAT database (Community-based Erosion Control [Azerbaijan]; Pasture-weed control by thistle cutting [Georgia]; High-altitude afforestation for erosion control [Armenia]; Slope erosion control using wooden pile walls [Armenia])
6.2 Impacts hors site que la Technologie a montrés
Précisez l'évaluation des impacts extérieurs (sous forme de mesures):
The technology is only about the monitoring (see above).
6.3 Exposition et sensibilité de la Technologie aux changements progressifs et aux évènements extrêmes/catastrophes liés au climat (telles que perçues par les exploitants des terres)
Changements climatiques progressifs
Changements climatiques progressifs
| Saison | Augmentation ou diminution | Comment la Technologie fait-elle face à cela? | |
|---|---|---|---|
| précipitations saisonnières | été | décroît | très bien |
Commentaires:
Technology is sensitive, it shows the climate change, the impact of the global change locally. The technology itself is not affected by climatic changes.
6.4 Analyse coûts-bénéfices
Quels sont les bénéfices comparativement aux coûts de mise en place (du point de vue des exploitants des terres)?
Rentabilité à court terme:
neutre / équilibrée
Rentabilité à long terme:
positive
Quels sont les bénéfices comparativement aux coûts d'entretien récurrents (du point de vue des exploitants des terres)?
Rentabilité à court terme:
neutre / équilibrée
Rentabilité à long terme:
légèrement positive
Commentaires:
The monitoring technology was applied for the first time to draw a baseline. Based on the results, activities have been planned and pilot measures have been implemented (exclusion from grazing, reforestation, regulation of grazing intensity). Future replications of the monitoring will show changes and evaluate success of measures. The technologies to control erosion are described separately in the WOCAT database (Community-based Erosion Control [Azerbaijan]; Pasture-weed control by thistle cutting [Georgia]; High-altitude afforestation for erosion control [Armenia]; Slope erosion control using wooden pile walls [Armenia]).
The costs of the remote sensing approach have not been invested by the land owners but by GIZ and the Ministry. Therefore there are no direct negative impact caused by the investment. The maintenance will be covered by public authorities as well. The positive impact for the land users are the clearly delineated pasture unit giving the exact area of grassland and the accessible amount of fodder biomass. By this, the lease-rate can be found according to the productivity and the number of livestock can be adapted to the carrying capacity of the land within the lease contract.
6.5 Adoption de la Technologie
- cas isolés/ expérimentaux
Si disponible, quantifiez (nombre de ménages et/ou superficie couverte):
The technology is desigend to be applied by national or regional addministrations and not by land owners themselves.
6.6 Adaptation
La Technologie a-t-elle été récemment modifiée pour s'adapter à l'évolution des conditions?
Non
6.7 Points forts/ avantages/ possibilités de la Technologie
| Points forts/ avantages/ possibilités du point de vue de l'exploitant des terres |
|---|
| The monitoring technology can help to find erosion and degradation hot spots and based on this spatial information counter measures can be applied to save the productivity of land. As the income from agricultural activities and livestock breeding is of high priority in this pilot region, the protection of the productivity of land is of high importance to the local land users. |
| Points forts/ avantages/ possibilités du point de vue du compilateur ou d'une autre personne ressource clé |
|---|
| The presented remote sensing technologies are a cost efficient and objective way to monitor land degradation and land use changes on large areas on long time periods. Based on this spatial data, land use regulations can be integrated in spatial planning and other legal and practical frameworks (e.g. pasture lease contracts) to counter act the degradation processes. The success of the measures and the development of degradation and rehabilitation can be monitored by the same toolset. |
6.8 Faiblesses/ inconvénients/ risques de la Technologie et moyens de les surmonter
| Faiblesses/ inconvénients/ risques du point de vue de l’exploitant des terres | Comment peuvent-ils être surmontés? |
|---|---|
| The technology is complex and cannot be applied by the land user her-/himself and is sometimes hard to understand. Therefore they might mistrust in the results and are not eager to accept regulations and measures to stop degradation. | Transparent documentation of the technology and regular field visits to evaluate together with the land owners and users the remote sensing results in the field. |
| Faiblesses/ inconvénients/ risques du point de vue du compilateur ou d'une autre personne ressource clé | Comment peuvent-ils être surmontés? |
|---|---|
| The institutional setup on the national level for the regular application of the remote sensing technology and the storage and management of the monitoring data is not established yet. GIS, remote sensing and soil experts are of limited availability. | Institutional capacity building and academic training courses provided at the Georgian universities can help to overcome these limitations. |
| Field data for calibration of satellite images (biomass volumes, classified land cover types, soil types, land management types) with exact information on the spatial location are rare and costly to be created. | Such data and information should be organised and gathered on national level across different sectors (agriculture, forestry, spatial planing, nature conservation ...). This would help to reduce significantly the costs and remote sensing could be applied on much larger areas. |
7. Références et liens
7.1 Méthodes/ sources d'information
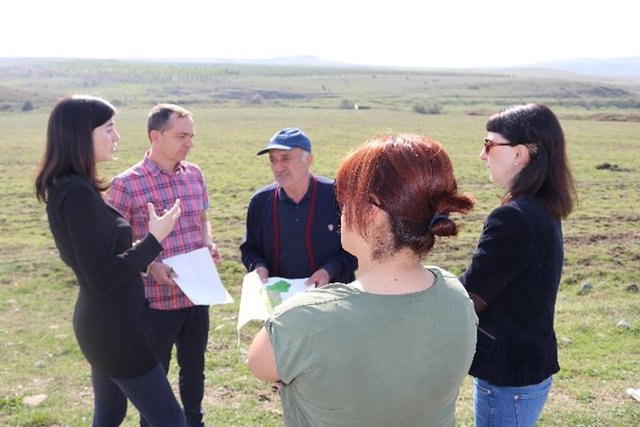
- visites de terrain, enquêtes sur le terrain
Three field visits with national and international experts as well as representatives of administrations and local stakeholders.
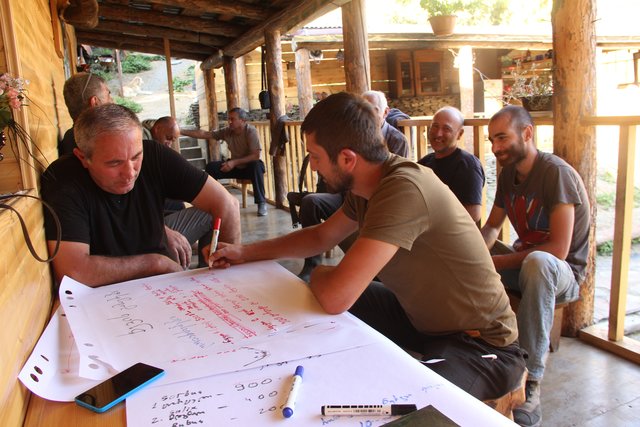
- interviews/entretiens avec les exploitants des terres
Meeting with cooperation partners, key village stakeholders from three pilot municipalities.
- interviews/ entretiens avec les spécialistes/ experts de GDT
Three mission meetings with 35 experts.
- compilation à partir de rapports et d'autres documents existants
Pilot project on land degradation neutrality in Georgia Final Report. 20.10.2017.
GISLab 2016: Development of Land Cover and Erosion Risk Map based on remote sensing for Tusheti Protected Areas. Study within the frame of GIZ-IBIS.
7.2 Références des publications disponibles
Titre, auteur, année, ISBN:
Land Degradation Neutrality 25.10.2017
Disponible à partir d'où? Coût?
https://e-c-o.at/files/publications/downloads/D00813_ECO_policy_brief_LDN_Georgia_171025.pdf
7.3 Liens vers les informations pertinentes en ligne
Titre/ description:
Tools for satellite image analysis
URL:
http://step.esa.int/main/snap-2-0-out-now/
Titre/ description:
UNCCD Good Practice Guidance on SDG Indicator 15.31. (Sims et al. 2017)
URL:
https://www.unccd.int/sites/default/files/relevant-links/2017-10/Good%20Practice%20Guidance_SDG%20Indicator%2015.3.1_Version%201.0.pdf
7.4 Observations d'ordre général
UNCCD Good Practice Guidance on SDG Indicator 15.31. (Sims et al. 2017) gives a detailed technical overview on methods and approaches to calculate LDN indicators by means of remote sensing data.
Liens et modules
Développer tout Réduire toutLiens
Land Degradation Neutrality Transformative Projects and Programmes (LDN-TPP) … [Géorgie]
In the framework of the project ‘Generating Economic and Environmental Benefits from Sustainable Land Management for Vulnerable Rural Communities of Georgia’, Land Degradation Neutrality Transformative Projects and Programmes (LDN-TPP) were developed to implement the LDN targets at municipal level. The approach defines the process to break down global and international …
- Compilateur : Daniel Zollner
Integrated Pasture Management Planning in Mountainous Regions [Géorgie]
The unsustainable use of pastures and forest areas has led to soil erosion, degradation, desertification and loss of biodiversity in the high mountain areas of the South Caucasus. The development of pasture passports is part of a broader approach to a strategic pasture management plan for Tusheti. This showcase includes …
- Compilateur : Hanns Kirchmeir
Modules
Aucun module trouvé