Remote Sensing as a Tool for Land Degradation Neutrality Monitoring [ຈີອໍເຈຍ]
- ການສ້າງ:
- ປັບປູງ:
- ຜູ້ສັງລວມຂໍ້ມູນ: Hanns Kirchmeir
- ບັນນາທິການ: Natia Kobakhidze, Christian Goenner
- ຜູ້ທົບທວນຄືນ: Rima Mekdaschi Studer
technologies_5488 - ຈີອໍເຈຍ
ເບິ່ງພາກສ່ວນ
ຂະຫຍາຍທັງໝົດ ຍຸບທັງໝົດ1. ຂໍ້ມູນທົ່ວໄປ
1.2 ຂໍ້ມູນ ການຕິດຕໍ່ພົວພັນ ຂອງບຸກຄົນທີ່ສໍາຄັນ ແລະ ສະຖາບັນ ທີ່ມີສ່ວນຮ່ວມ ໃນການປະເມີນເອກກະສານ ເຕັກໂນໂລຢີ
co-compiler:
co-compiler:
ຊື່ໂຄງການ ທີ່ອໍານວຍຄວາມສະດວກ ໃນການສ້າງເອກກະສານ/ປະເມີນ ເຕັກໂນໂລຢີ (ຖ້າກ່ຽວຂ້ອງ)
Integrated Biodiversity Management, South Caucasus (IBiS)ຊື່ສະຖາບັນ (ຫຼາຍສະຖາບັນ) ທີ່ອໍານວຍຄວາມສະດວກ ໃນການສ້າງເອກກະສານ / ປະເມີນ ເຕັກໂນໂລຢີ (ຖ້າກ່ຽວຂ້ອງ)
Deutsche Gesellschaft für Internationale Zusammenarbeit (GIZ)1.3 ເງື່ອນໄຂ ກ່ຽວກັບ ການນໍາໃຊ້ຂໍ້ມູນເອກະສານ ທີ່ສ້າງຂື້ນ ໂດຍຜ່ານ ອົງການພາບລວມຂອງໂລກ ທາງດ້ານແນວທາງ ແລະ ເຕັກໂນໂລຢີ ຂອງການອານຸລັກ ທໍາມະຊາດ (WOCAT)
ຜູ້ປ້ອນຂໍ້ມູນ ແລະ ບຸກຄົນສຳຄັນ ທີ່ໃຫ້ຂໍ້ມູນ (ຫຼາຍ) ຍິນຍອມ ຕາມເງື່ອນໄຂ ໃນການນຳໃຊ້ຂໍ້ມູນ ເພື່ອສ້າງເປັນເອກກະສານຂອງ WOCAT:
ແມ່ນ
1.4 ແຈ້ງການວ່າ ດ້ວຍຄວາມຍືນຍົງຂອງ ເຕັກໂນໂລຢີ
ການນໍາໃຊ້ ເຕັກໂນໂລຢີ ດັ່ງກ່າວໄດ້ອະທິບາຍ ເຖິງບັນຫາ ກ່ຽວກັບ ການເຊື່ອມໂຊມຂອງດິນບໍ? ຖ້າບໍ່ດັ່ງນັ້ນ ມັນບໍ່ສາມາດ ຢັ້ງຢືນໄດ້ວ່າ ເປັນເຕັກໂນໂລຊີ ໃນການຄຸ້ມຄອງ ທີ່ດິນແບບຍືນຍົງ? :
ບໍ່ແມ່ນ
1.5 ແບບສອບຖາມທີ່ອ້າງອີງເຖີງແນວທາງ ການຄຸ້ມຄອງທີ່ດິນແບບຍືນຍົງ (ໄດ້ເຮັດເປັນເອກະສານທີ່ໃຊ້ WOCAT)
Land Degradation Neutrality Transformative Projects and Programmes (LDN-TPP) … [ຈີອໍເຈຍ]
In the framework of the project ‘Generating Economic and Environmental Benefits from Sustainable Land Management for Vulnerable Rural Communities of Georgia’, Land Degradation Neutrality Transformative Projects and Programmes (LDN-TPP) were developed to implement the LDN targets at municipal level. The approach defines the process to break down global and international …
- ຜູ້ສັງລວມຂໍ້ມູນ: Daniel Zollner
Integrated Pasture Management Planning in Mountainous Regions [ຈີອໍເຈຍ]
The unsustainable use of pastures and forest areas has led to soil erosion, degradation, desertification and loss of biodiversity in the high mountain areas of the South Caucasus. The development of pasture passports is part of a broader approach to a strategic pasture management plan for Tusheti. This showcase includes …
- ຜູ້ສັງລວມຂໍ້ມູນ: Hanns Kirchmeir
2. ການອະທິບາຍ ເຕັກໂນໂລຢີ ຂອງການຄຸ້ມຄອງ ທີ່ດິນແບບຍືນຍົງ
2.1 ຄໍາອະທິບາຍສັ້ນຂອງ ເຕັກໂນໂລຢີ
ການກຳໜົດຄວາມໝາຍ ຂອງເຕັກໂນໂລຢີ:
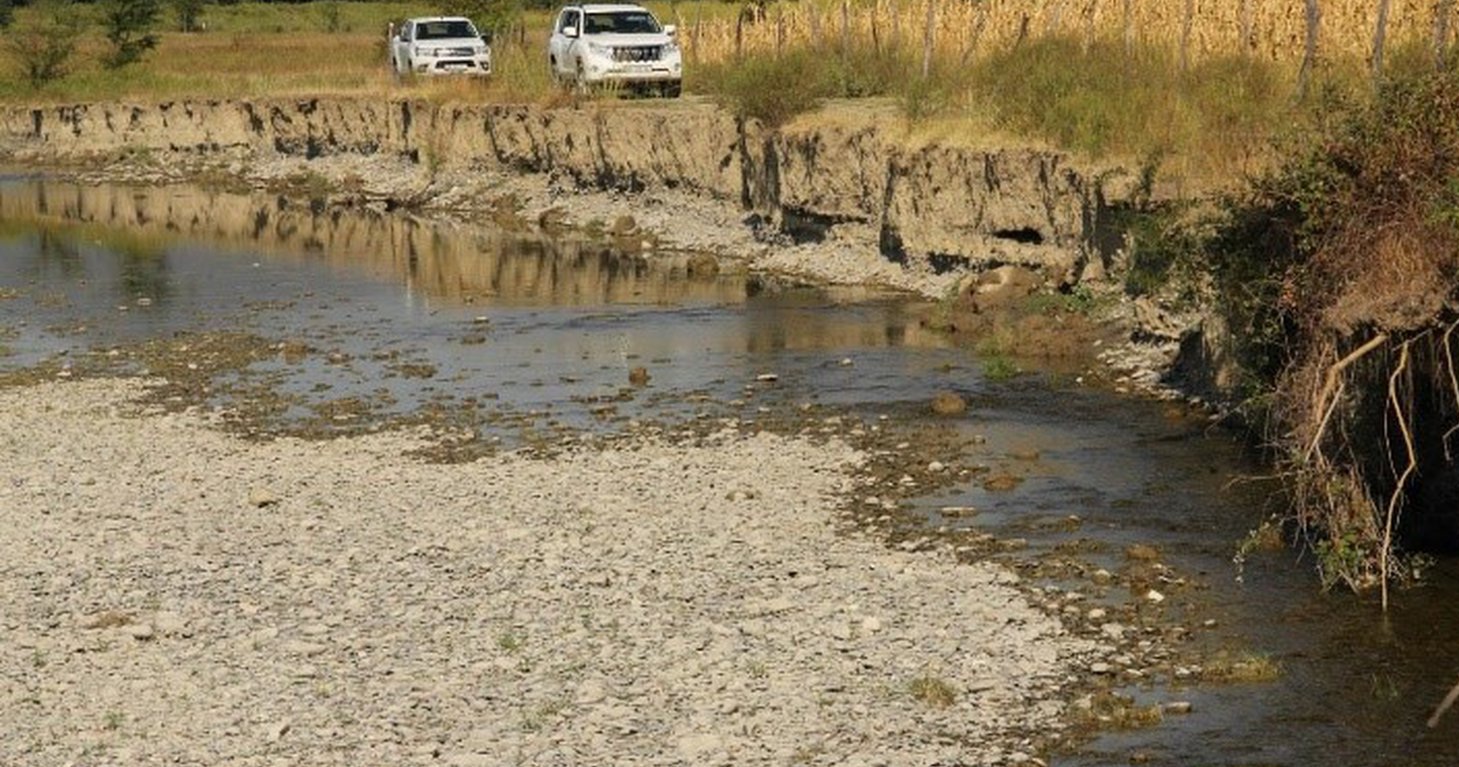
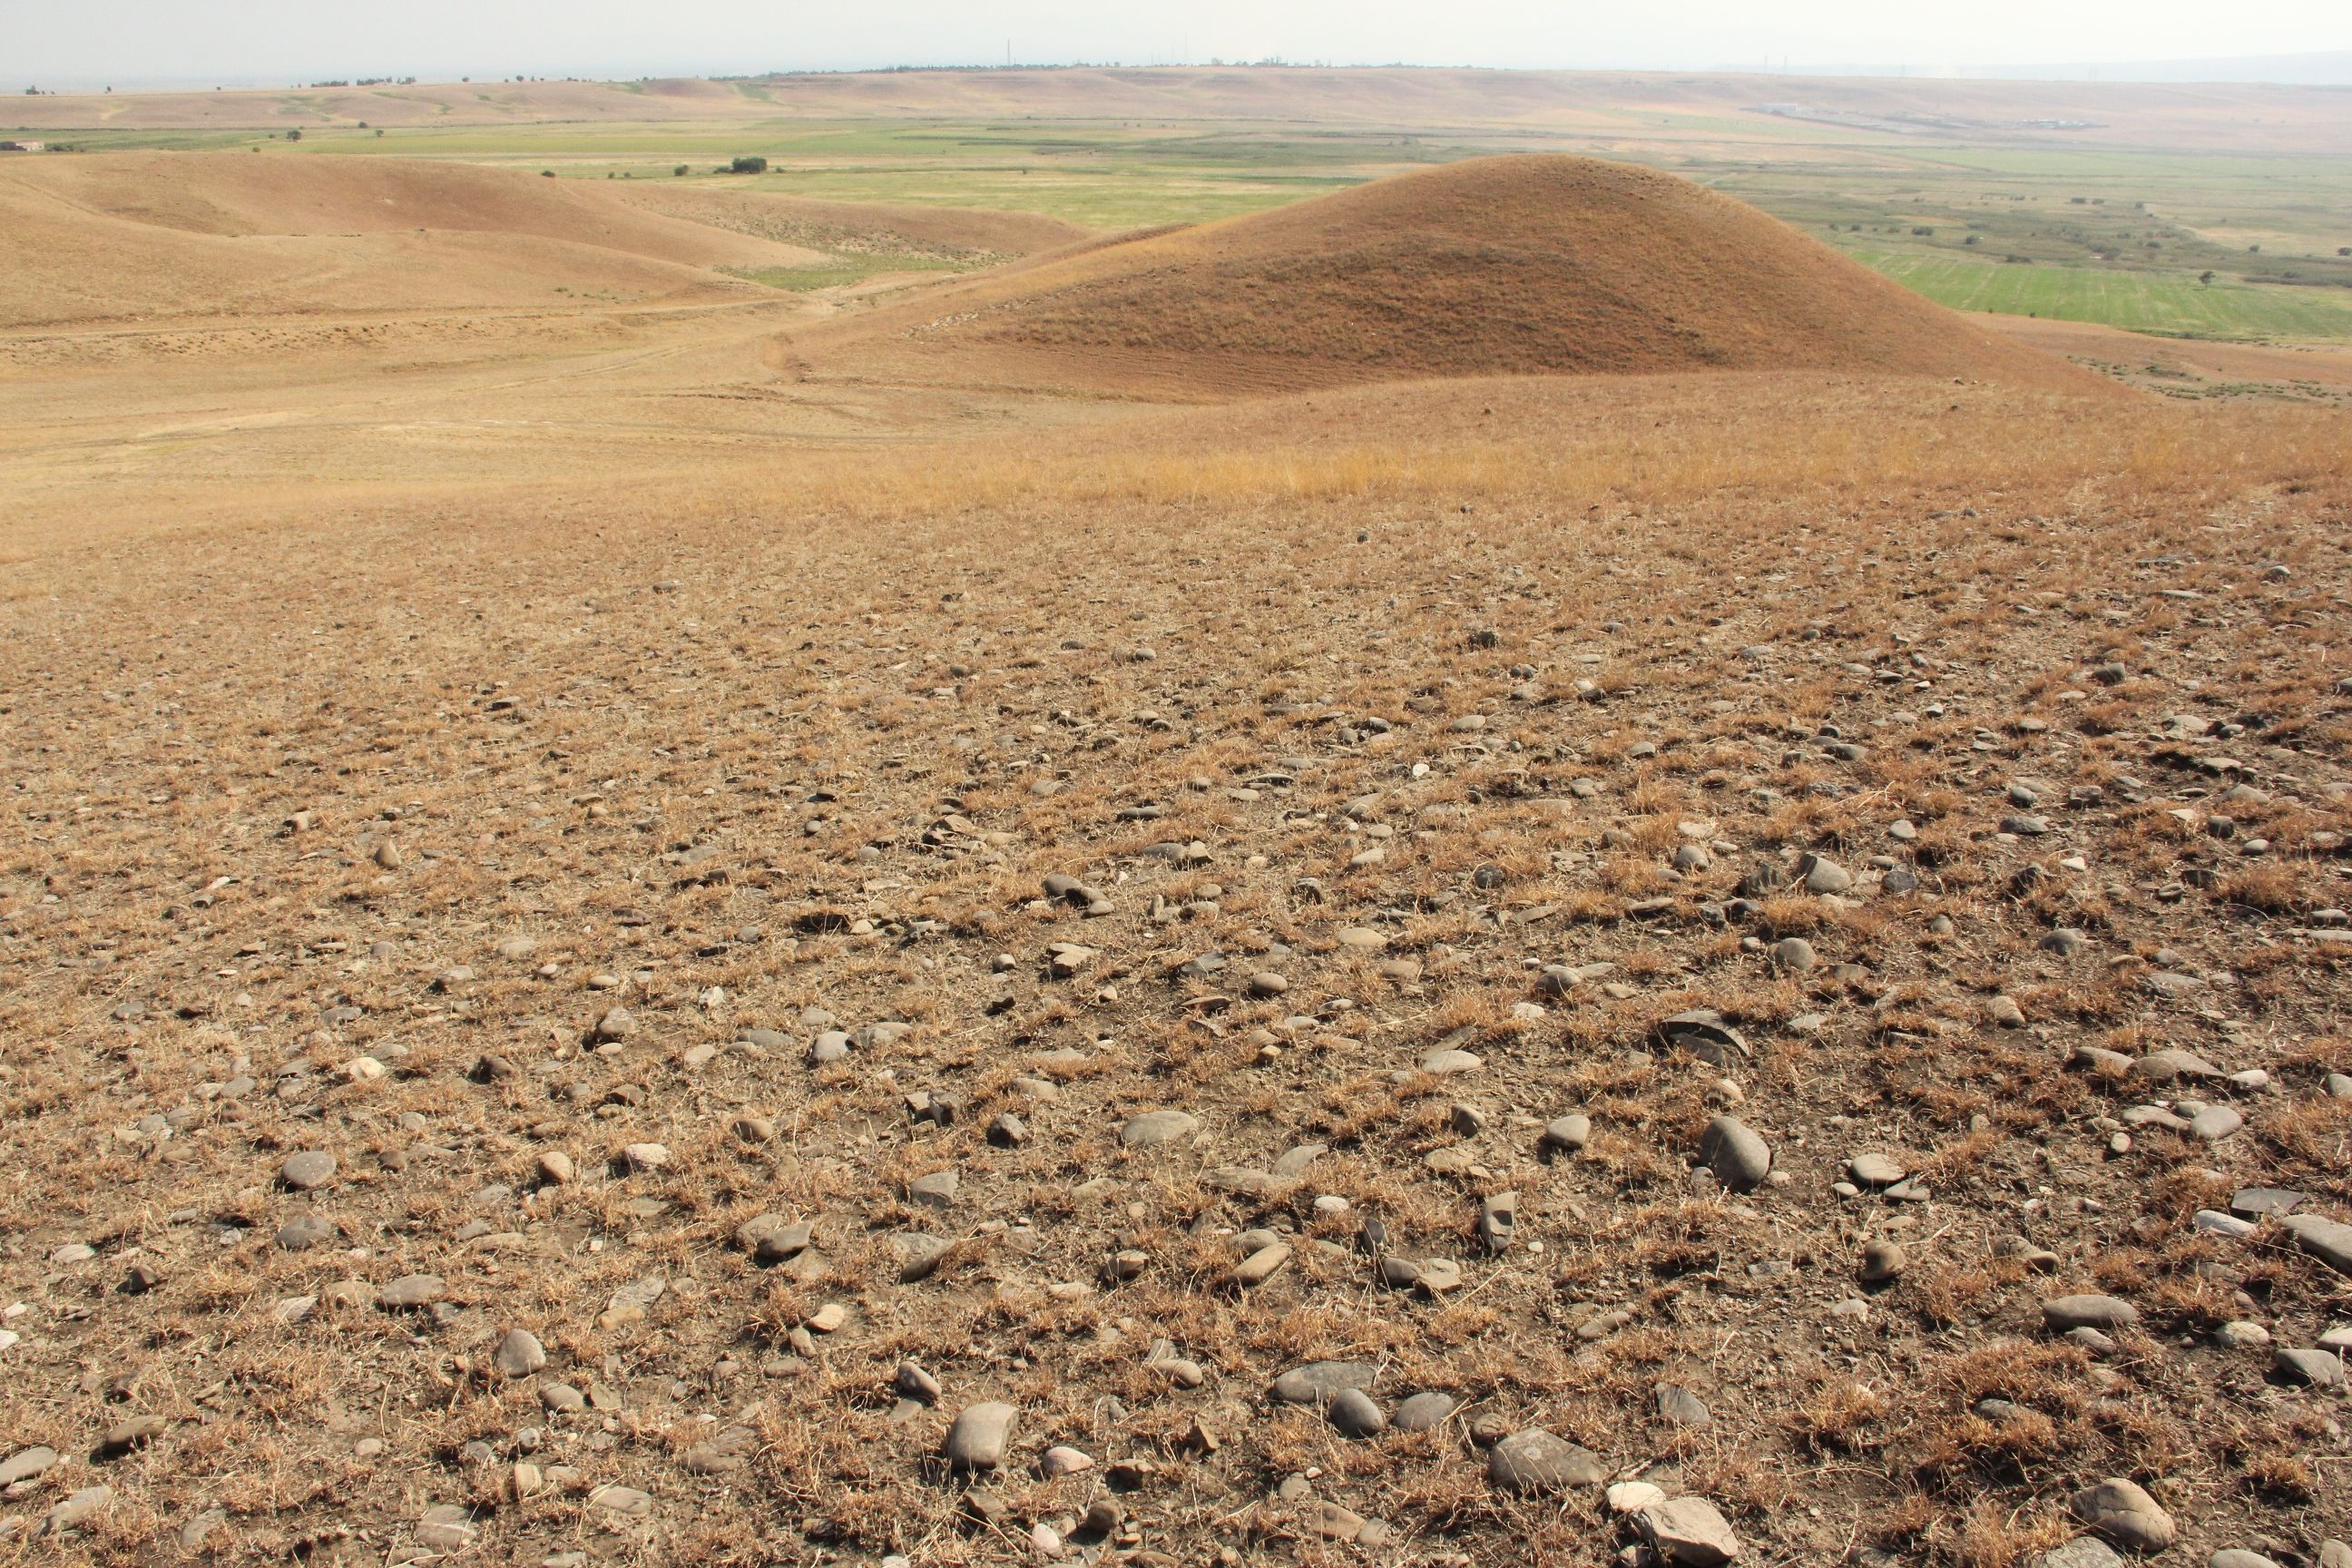
Land degradation contributes to biodiversity loss and the impoverishment of rural livelihoods in Tusheti. Above all, however, land degradation are triggered by climate change as traditional land use practise might not be adapted to new climate conditions which can cause or speed up degradation processes significantly. On the other hand, degraded land often leads to low biomass volumes and this reduces the ecosystem capability to stabilise local climate conditions. The concept of Land Degradation Neutrality (LDN) and the method of using remote sensing for monitoring land degradation are tools to identify the need for local planning processes. This showcase describes the LDN monitoring concept, national targets and the technology to assess indicators, mechanism and incentives for LDN.
2.2 ການອະທິບາຍ ລາຍລະອຽດ ຂອງເຕັກໂນໂລຢີ
ການພັນລະນາ:
Purpose
The continuing global degradation of land resources threatens food security and the functioning of ecosystem services by reducing or losing their biological or economic productivity. Unsustainable land-use practices such as deforestation, overgrazing and inappropriate agricultural management systems trigger the loss and degradation of valuable land resources in Georgia. These effects are visible in all countries of the South Caucasus. About 35% of the agricultural land in Georgia is severely degraded, 60% is of low to middle production quality.
Land Degradation Neutrality (LDN)
LDN is a new international concept to combat the ongoing degradation of valuable soil resources. The LDN concept was developed by the UNCCD to encourage countries to take measures to avoid, reduce or reverse land degradation, with the vision of achieving a zero-net loss of productive land. To combat land degradation in Georgia, in 2017, the national LDN Working Group set voluntary national targets to address specific aspects of LDN, and submitted them to the UNCCD Secretariat.
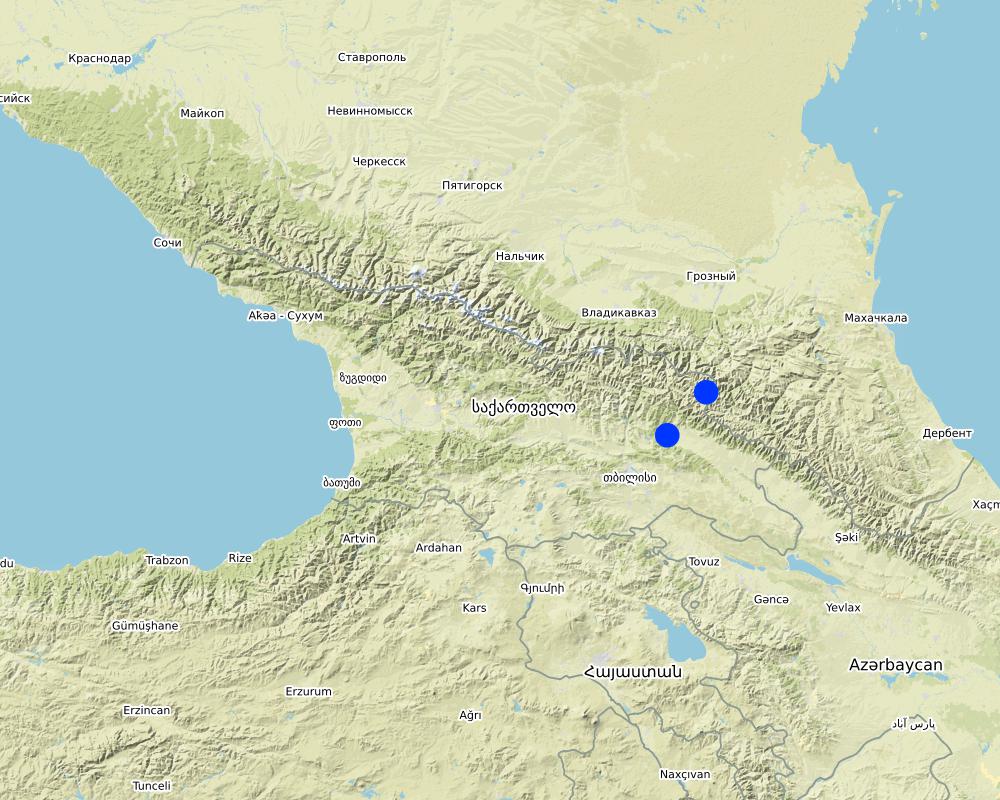
To effectively set up counter measures to combat land degradation it is important to have detailed spatial information on land cover and land cover changes as well as on trends in degradation (like size of areas effected by erosion). Therefore a remote sensing toolset was developed and tested in the pilot are of Tusheti protected landscapes in the High Caucasus in Georgia. This region shows increasing soil erosion problems by uneven distribution of grazing activities and was selected for developing erosion control measures within the Integrated Biodiversity Management in the South Caucasus Program (IBiS) funded by the Deutsche Gesellschaft für internationale Zusammenarbeit (GIZ).
Sensitivity Model
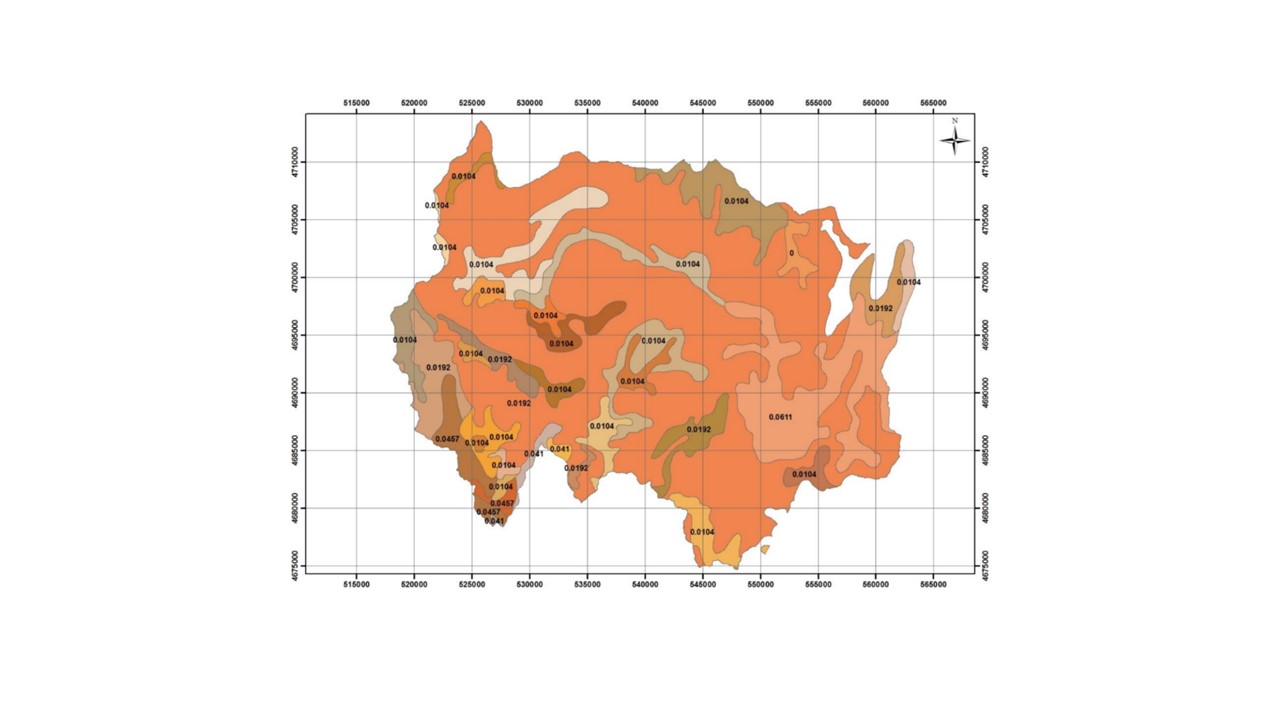
The Integrated Biodiversity Management in the South Caucasus (IBiS) project in cooperation with national experts in Georgia, developed and applied a remote sensing toolset called "Erosion Sensitivity Model". This remote sensing toolset helps to assess the current state and the general erosion risk. The sensitivity model is based on the RUSLE – Revised Universal Soil Loss Equation. The tool allows the calculation of erosion caused by rainfall and surface run-off. The RUSLE equation incorporates a combination of different input factors such as precipitation (R), soil type (K), slope (LS), vegetation cover (C) and protection measures (P). In this way, the estimated average soil loss in tonnes per acre per year (A) can be calculated as follows: A = R * K * LS * C * P.
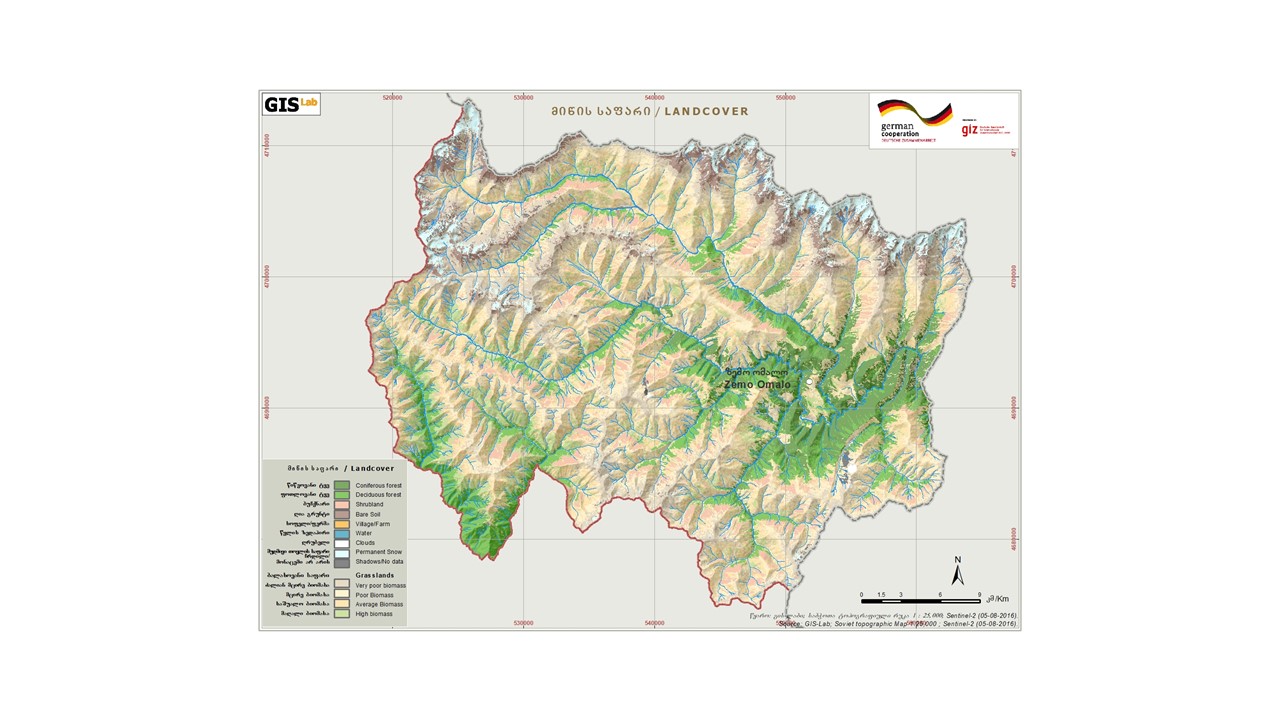
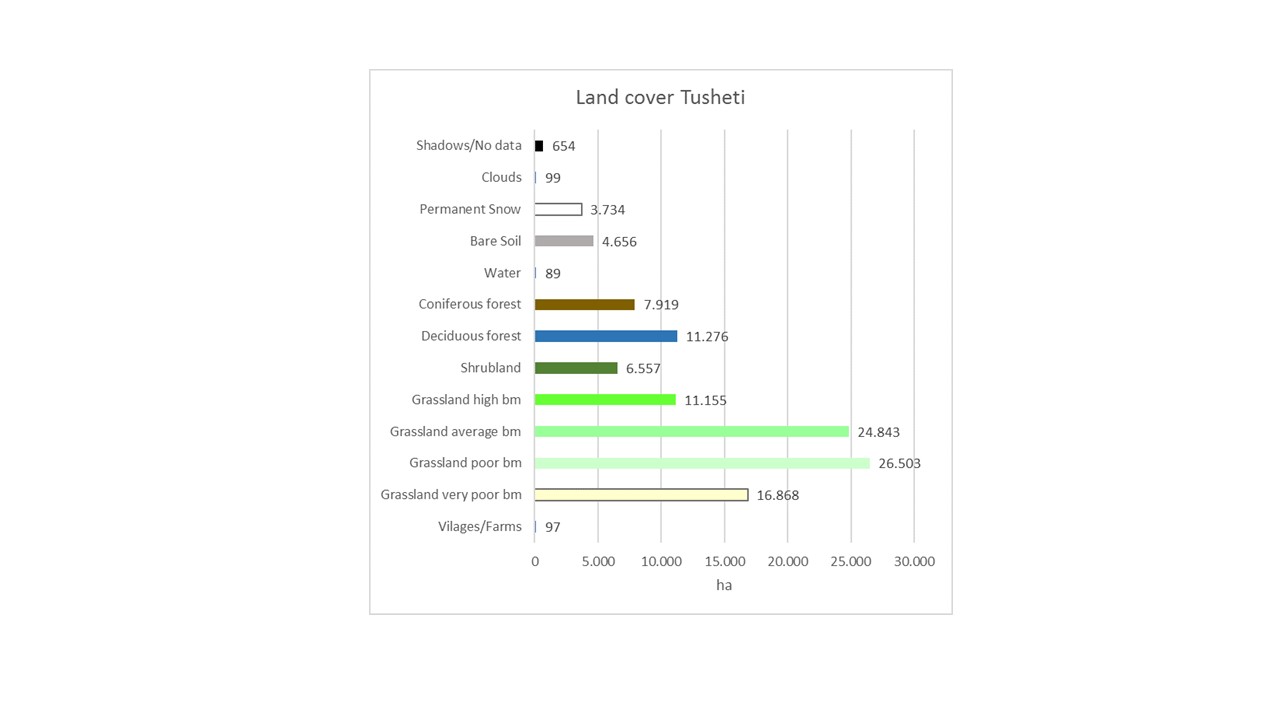
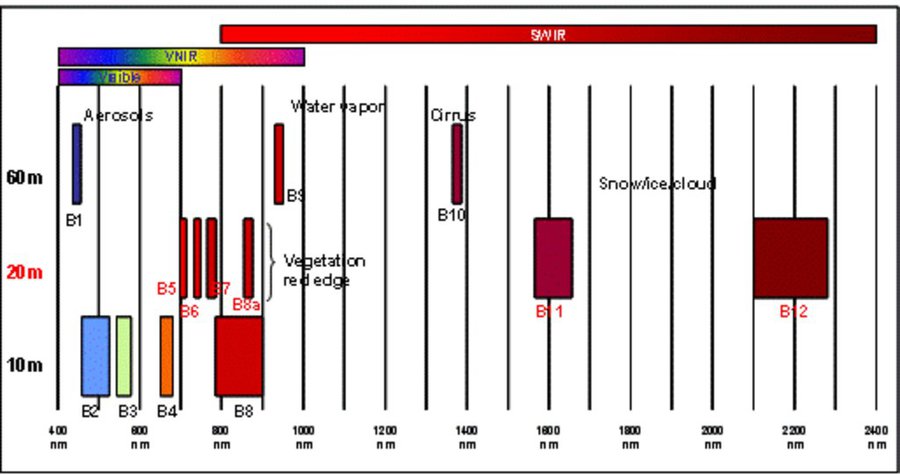
The rainfall factor (R) results from a quotient from the monthly and annual mean value of precipitation. The data come from the data platform “CHELSA – Climatologies at high resolution for the earth’s land surface areas”. For the soil type factor (K), a soil map of 1:200,000 was taken. Then, depending on the soil type, different contents of sand, silt, loam and clay were used to calculate the K factor. The slope length and steepness factor (LS) is calculated from a digital elevation model (DEM) with a raster resolution of 10x10m. The DEM is derived from the topographic map 1:25,000. The global elevation model derived from SRTM data (Shuttle Radar Topography Mission) has a resolution of 30x30 m and is available worldwide free of charge. The land cover factor (C) describes the vegetation cover that protects the soil from erosion. The vegetation cover slows down the speed of the raindrops and reduces the erosive effect of the rain. It slows down surface water runoff and stabilises the soil through root systems. The main indicators, land cover and productivity, can be assessed by remote sensing. The data from satellites need to be classified and calibrated by field data (ground truthing). The technology for the assessment of these indicators with Sentinel 2 satellite images was developed and applied in 2016 to 2018 in the Tusheti region (Akhmeta municipality) in the framework of the GIZ-IBiS project. Based on spectral information from airborne or satellite images, the density of the vegetation was calculated and mapped. There are well developed vegetation indices and classification systems to derive different land cover types and vegetation densities (mainly described by the Leaf Area Index LAI or biomass indices). The LAI is the area of the leaf surface (in square meters) per square meter ground surface. Since the real surface area of the leaves is hardly measurable, the amount of biomass is a proxy for the LAI. The P-factor is rarely considered in large-scale modelling of soil erosion risk as it is difficult to estimate it with very high accuracy. Therefore, to refine the model, a more detailed DEM (digital elevation model) is required (e.g., from satellite images). Based on the input factors, a soil erosion risk map was calculated for the whole territory of the Tusheti Protected Areas (113,660 ha). Based on the different spectral bands of the Sentinel 2 satellite image, a land cover map was calculated using the Support Vector Machine (SVM) technology and spectral image information.
The results have been integrated in the development of pasture management plans ("pasture passports"). This maps and documents are indicating areas of high erosion risk that need to be excluded from grazing and the maximum number of livestock has been calculated based on the biomass maps and will be integrated into the lease contracts.
The repetition of the remote sensing after some years (e.g. 5 years) will help to evaluate, if the measures in the pasture management have been successful to stop the degradation processes.
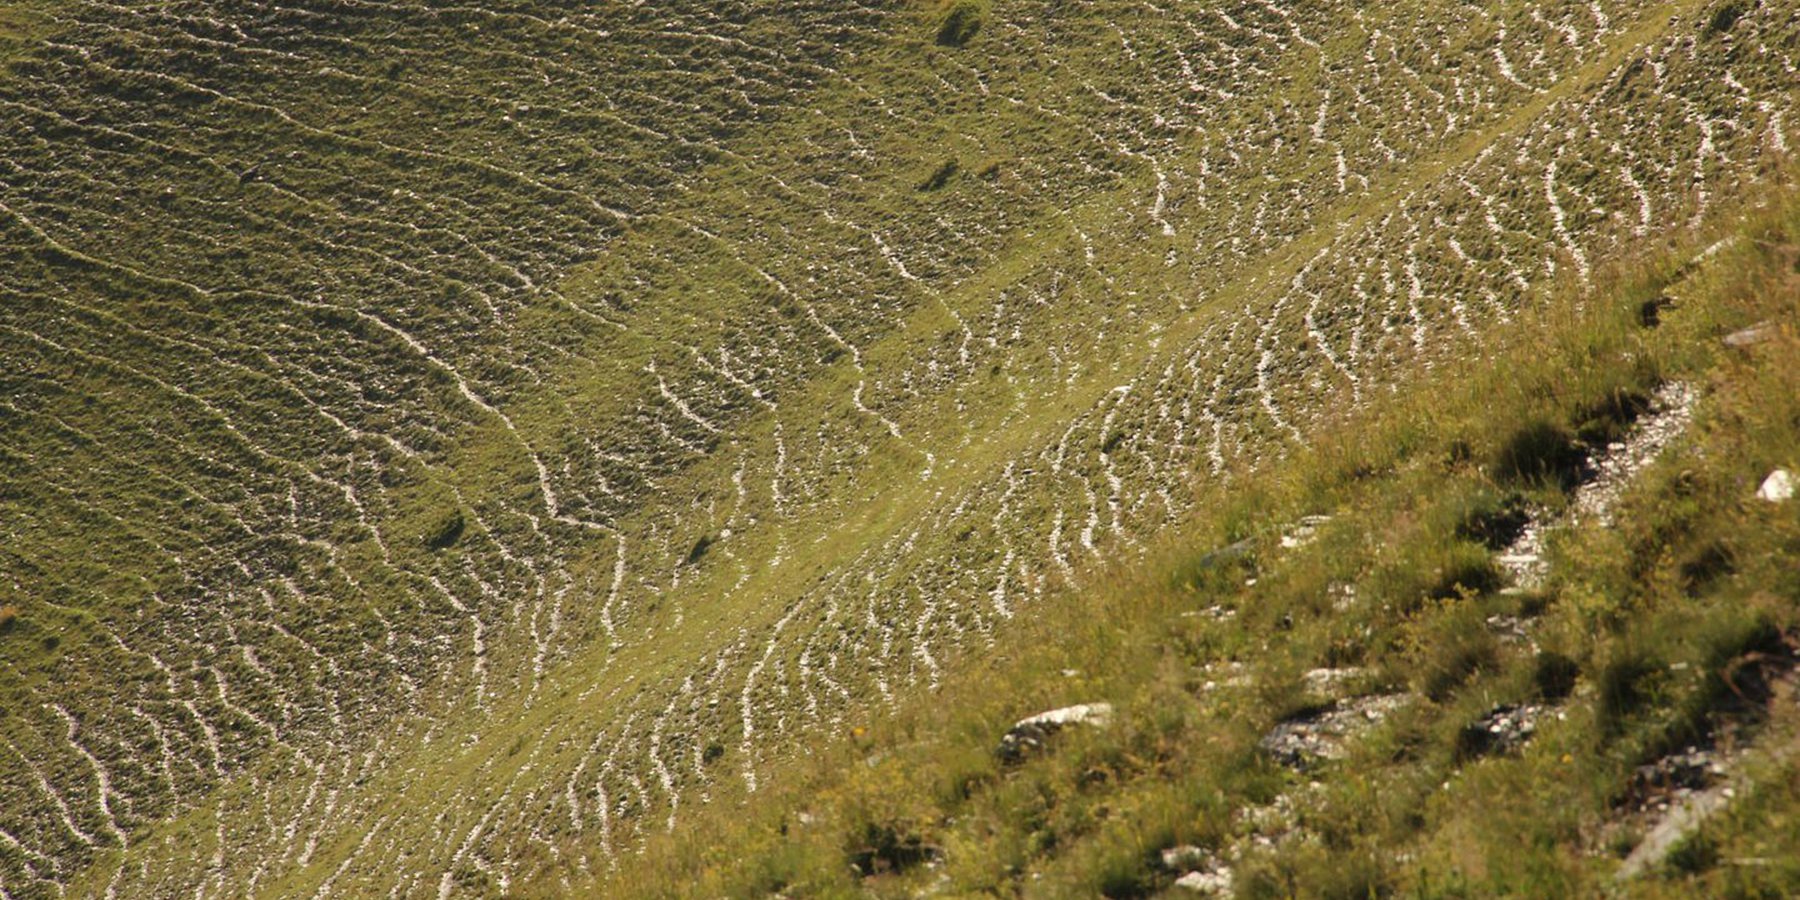
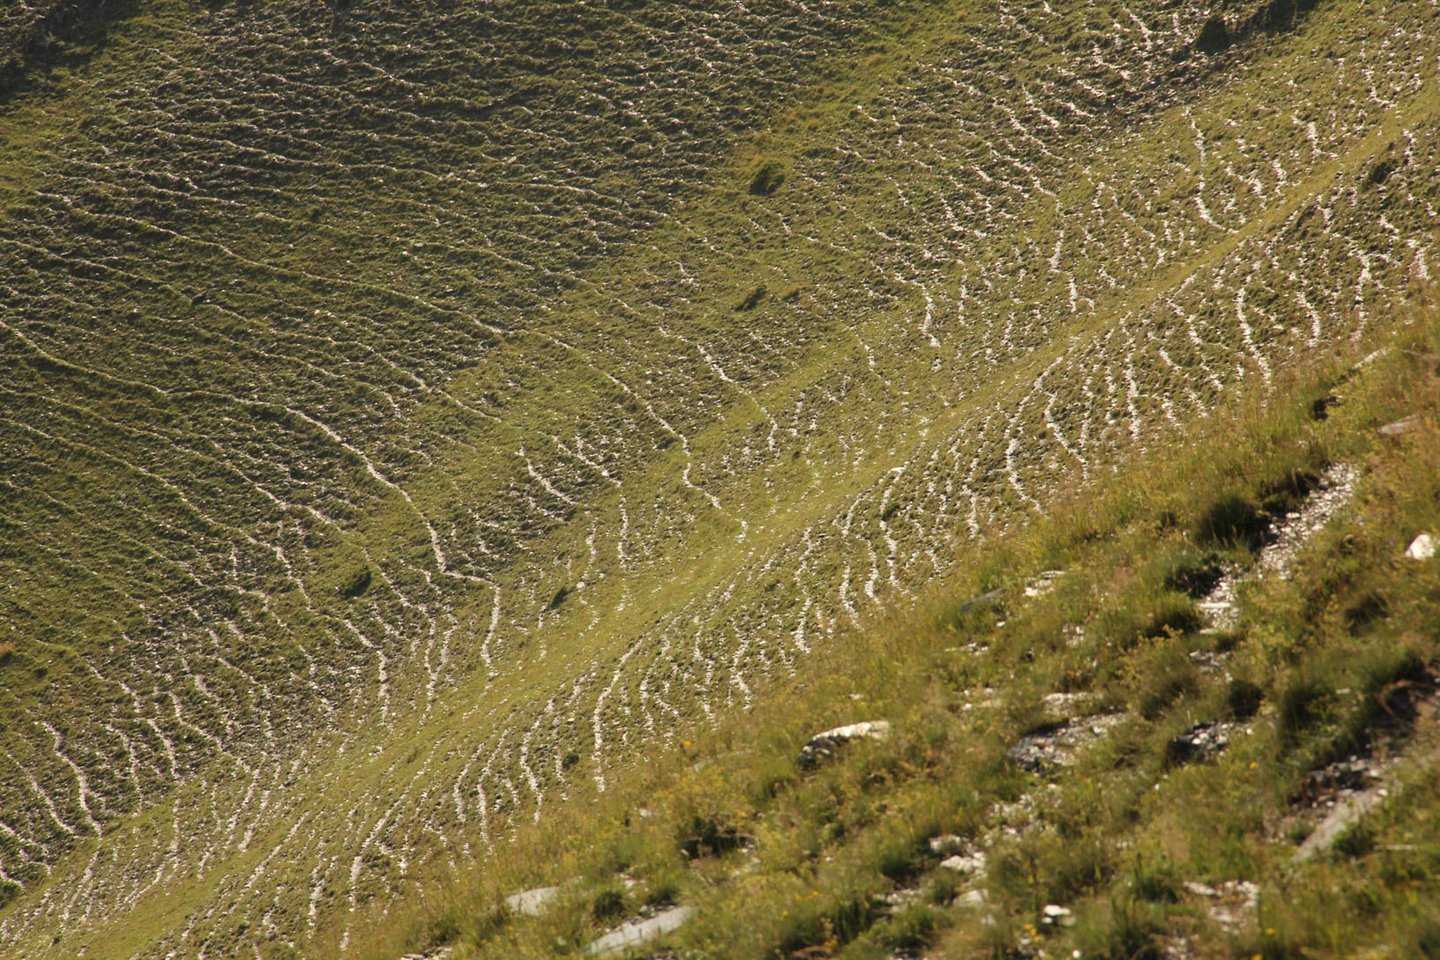
2.3 ຮູບພາບຂອງເຕັກໂນໂລຢີ
ສື່ຮູບພາບ
2.5 ປະເທດ / ເຂດ / ສະຖານທີ່ບ່ອນທີ່ ເຕັກໂນໂລຢີ ໄດ້ຮັບການນໍາໃຊ້ ແລະ ທີ່ຖືກປົກຄຸມດ້ວຍການປະເມີນຜົນ
ປະເທດ:
ຈີອໍເຈຍ
ພາກພື້ນ / ລັດ / ແຂວງ:
Tusheti region, Akhmeta municipality
ໃຫ້ລະບຸ ການແຜ່ຂະຫຍາຍ ເຕັກໂນໂລຢີ:
- ແຜ່ຂະຫຍາຍຢ່າງໄວວາໃນພື້ນທີ່
ຖ້າຫາກວ່າເຕັກໂນໂລຢີ ໄດ້ກະຈາຍໄປທົ່ວພື້ນທີ່, ໃຫ້ລະບຸເນື້ອທີ່ ທີ່ຖືກປົກຄຸມ (ເປັນ ກິໂລຕາແມັດ):
1000.0
ສ່ວນຫຼາຍສະຖານທີ່ຕັ້ງຂອງເຕັກໂນໂລຢີ ແມ່ນ ຢູ່ໃນເຂດພື້ນທີ່ສະຫງວນບໍ?
ແມ່ນ
ຖ້າແມ່ນ, ໃຫ້ລະບຸແຈ້ງ:
The area is in the Tusheti Protected Areas (Tusheti Strict Nature Reserve, Tusheti National Park, Tusheti Protected Landscape).
ຄວາມຄິດເຫັນ:
The whole territory was analysed by remote sensing and field records for calibration were collected on sample plots from different places in Tusheti.
Map
×2.6 ວັນທີໃນການຈັດຕັ້ງປະຕິບັດ
ໃຫ້ລະບຸປີ ໃນການຈັດຕັ້ງປະຕິບັດ:
2016
2.7 ການນໍາສະເໜີ ເຕັກໂນໂລຢີ
ໃຫ້ລະບຸ ເຕັກໂນໂລຢີ ໄດ້ຖືກຈັດຕັ້ງປະຕິບັດຄືແນວໃດ?
- ໂດຍຜ່ານໂຄງການ / ການຊ່ວຍເຫຼືອຈາກພາຍນອກ
3. ການໃຈ້ແຍກ ເຕັກໂນໂລຢີ ໃນການຄຸ້ມຄອງ ດິນແບບຍືນຍົງ
3.1 ຈຸດປະສົງຫຼັກ (ຫຼາຍ) ຂອງເຕັກໂນໂລຢີ
- ປັບປຸງ ການຜະລິດ
- ຫຼຸດຜ່ອນ, ປ້ອງກັນ, ຟື້ນຟູ ການເຊື່ອມໂຊມຂອງດິນ
- ປົກປັກຮັກສາ / ການປັບປຸງຊີວະນາໆພັນ
- provide information to make a spatial-territorial planning
3.2 ປະເພດການນໍາໃຊ້ທີ່ດິນ ໃນປະຈຸບັນ() ທີ່ເຕັກໂນໂລຢີ ໄດ້ຖືກນໍາໃຊ້
ການນຳໃຊ້ທີ່ດິນ ປະສົມພາຍໃນພື້ນທີ່ດຽວກັນ:
ແມ່ນ
ລະບຸການນຳໃຊ້ທີ່ດິນແບບປະສົມ (ຜົນລະປູກ / ທົ່ງຫຍ້າລ້ຽງສັດ / ຕົ້ນໄມ້):
- ກະສິກໍາແບບປະສົມປະສານ (ລວມທັງ ການລ້ຽງສັດ-ປຸກຝັງ)

ດິນທີ່ປູກພືດ
- ການປູກພືດປະຈໍາປີ
ການປູກພືດປະຈຳປີ - ລະບຸປະເພດພືດ:
- ທັນຍາພືດ-ເຂົ້າບາເລ້
- ການປູກພືດໃຫ້ຮາກ / ຫົວ - ມັນຝລັ່ງ
ຈໍານວນ ລະດູການ ປູກໃນປີໜຶ່ງ:
- 1
ມີການເຝືກປູກພືດແບບສັບຫວ່າງບໍ່?
ບໍ່ແມ່ນ
ມີການເຝືກປູກພືດແບບໝູນວຽນບໍ່?
ບໍ່ແມ່ນ

ທົ່ງຫຍ້າລ້ຽງສັດ
ການລ້ຽງສັດແບບປ່ອຍ ຕາມທຳມະຊາດ:
- ການລ້ຽງສັດແບບເຄື່ອນທີ່
ປະເພດສັດ:
- cattle - dairy and beef (e.g. zebu)
- ແກະ
ແມ່ນການເຝືກຄຸ້ມຄອງ ການປູກພືດປະສົມປະສານ ກັບການລ້ຽງສັດບໍ່?
ບໍ່ແມ່ນ
3.3 ການນຳໃຊ້ທີ່ດິນ ມີການປ່ຽນແປງຍ້ອນການຈັດຕັ້ງທົດລອງເຕັກໂນໂລຢີ ແມ່ນບໍ່?
ການນຳໃຊ້ທີ່ດິນ ມີການປ່ຽນແປງຍ້ອນການຈັດຕັ້ງທົດລອງເຕັກໂນໂລຢີ ແມ່ນບໍ່?
- ບໍ່ (ຕໍ່ເໜືອງກັບ ຄຳຖາມ 3.4)
3.4 ການສະໜອງນ້ຳ
ອື່ນໆ (ຕົວຢ່າງ, ຫຼັງຈາກນໍ້າຖ້ວມ):
- rainfed and mixed rained-irrigation
3.5 ການນໍາໃຊ້ເຕັກໂນໂລຢີ ທີ່ຢູ່ໃນກຸ່ມການຄຸ້ມຄອງ ທີ່ດິນແບບຍືນຍົງ
- ການຄຸ້ມຄອງສັດລ້ຽງ ແລະ ທົ່ງຫຍ້າລ້ຽງສັດ
- ການປັບປຸງດິນ / ພືດຄຸມດິນ
3.6 ມາດຕະການ ການຄຸ້ມຄອງ ທີ່ດິນແບບຍືນຍົງ ປະກອບດ້ວຍ ເຕັກໂນໂລຢີ

ມາດຕະການ ທາງດ້ານການຄຸ້ມຄອງ
- M2: ການປ່ຽນແປງ ການຈັດການຄຸ້ມຄອງ / ລະດັບຄວາມໜາແໜ້ນ

ມາດຕະການອື່ນໆ
ລະບຸ ຊະນິດ:
It is a monitoring technology to evaluate land management activities.
ຄວາມຄິດເຫັນ:
On some pilot plots technologies to control erosion and stop land degradation have been tested. This includes fencing, rotational pasture management, mulching and installing check dams to stop gully erosion.
3.7 ປະເພດດິນເຊື່ອມໂຊມ ຫຼັກທີ່ໄດ້ນໍາໃຊ້ ເຕັກໂນໂລຢີ

ດິນເຊາະເຈື່ອນ ໂດຍນໍ້າ
- Wt: ການສູນເສຍຊັ້ນໜ້າດິນ / ການເຊາະເຈື່ອນຜິວໜ້າດິນ
- Wg: ການເຊາະເຈື່ອນຮ່ອງນ້ຳ / ຫ້ວຍ

ການເຊື່ອມໂຊມ ຂອງດິນ ທາງກາຍະພາບ
- Pc: ການອັດແໜ້ນ

ການເຊື່ອມໂຊມ ທາງຊີວະພາບ
- Bc: ການຫຼຸດຜ່ອນການປົກຫຸ້ມຂອງພືດ
- Bq: ປະລິມານ / ອິນຊີວັດຖຸຫຼຸດລົງ
ຄວາມຄິດເຫັນ:
The main drivers of land degradation in the pilot area are overgrazing and trampling, off-road driving as well as infrastructure development (especially inappropriate road construction in steep slopes).
3.8 ການປ້ອງກັນ, ການຫຼຸດຜ່ອນ, ຫຼືການຟື້ນຟູຂອງການເຊື່ອມໂຊມຂອງດິນ
ໃຫ້ລະບຸ ເປົ້າໝາຍ ເຕັກໂນໂລຢີ ທີ່ພົວພັນ ກັບຄວາມເຊື່ອມໂຊມຂອງດິນ:
- ປ້ອງກັນການເຊື່ອມໂຊມຂອງດິນ
- ຫຼຸດຜ່ອນການເຊື່ອມໂຊມຂອງດິນ
ຄວາມຄິດເຫັນ:
The monitoring tools presented here help to monitor the development of land degradation and to evaluate measures and development trends.
4. ຂໍ້ກໍາໜົດ, ກິດຈະກໍາການປະຕິບັດ, ວັດຖຸດິບ, ແລະຄ່າໃຊ້ຈ່າຍ
4.1 ເຕັກນິກ ໃນການແຕ້ມແຜນວາດ ເຕັກໂນໂລຢີ
ຄຸນລັກສະນະ ຂອງເຕັກນິກ (ທີ່ກ່ຽວຂ້ອງ ກັບການແຕ້ມແຜນວາດ ທາງດ້ານເຕັກນີກ):
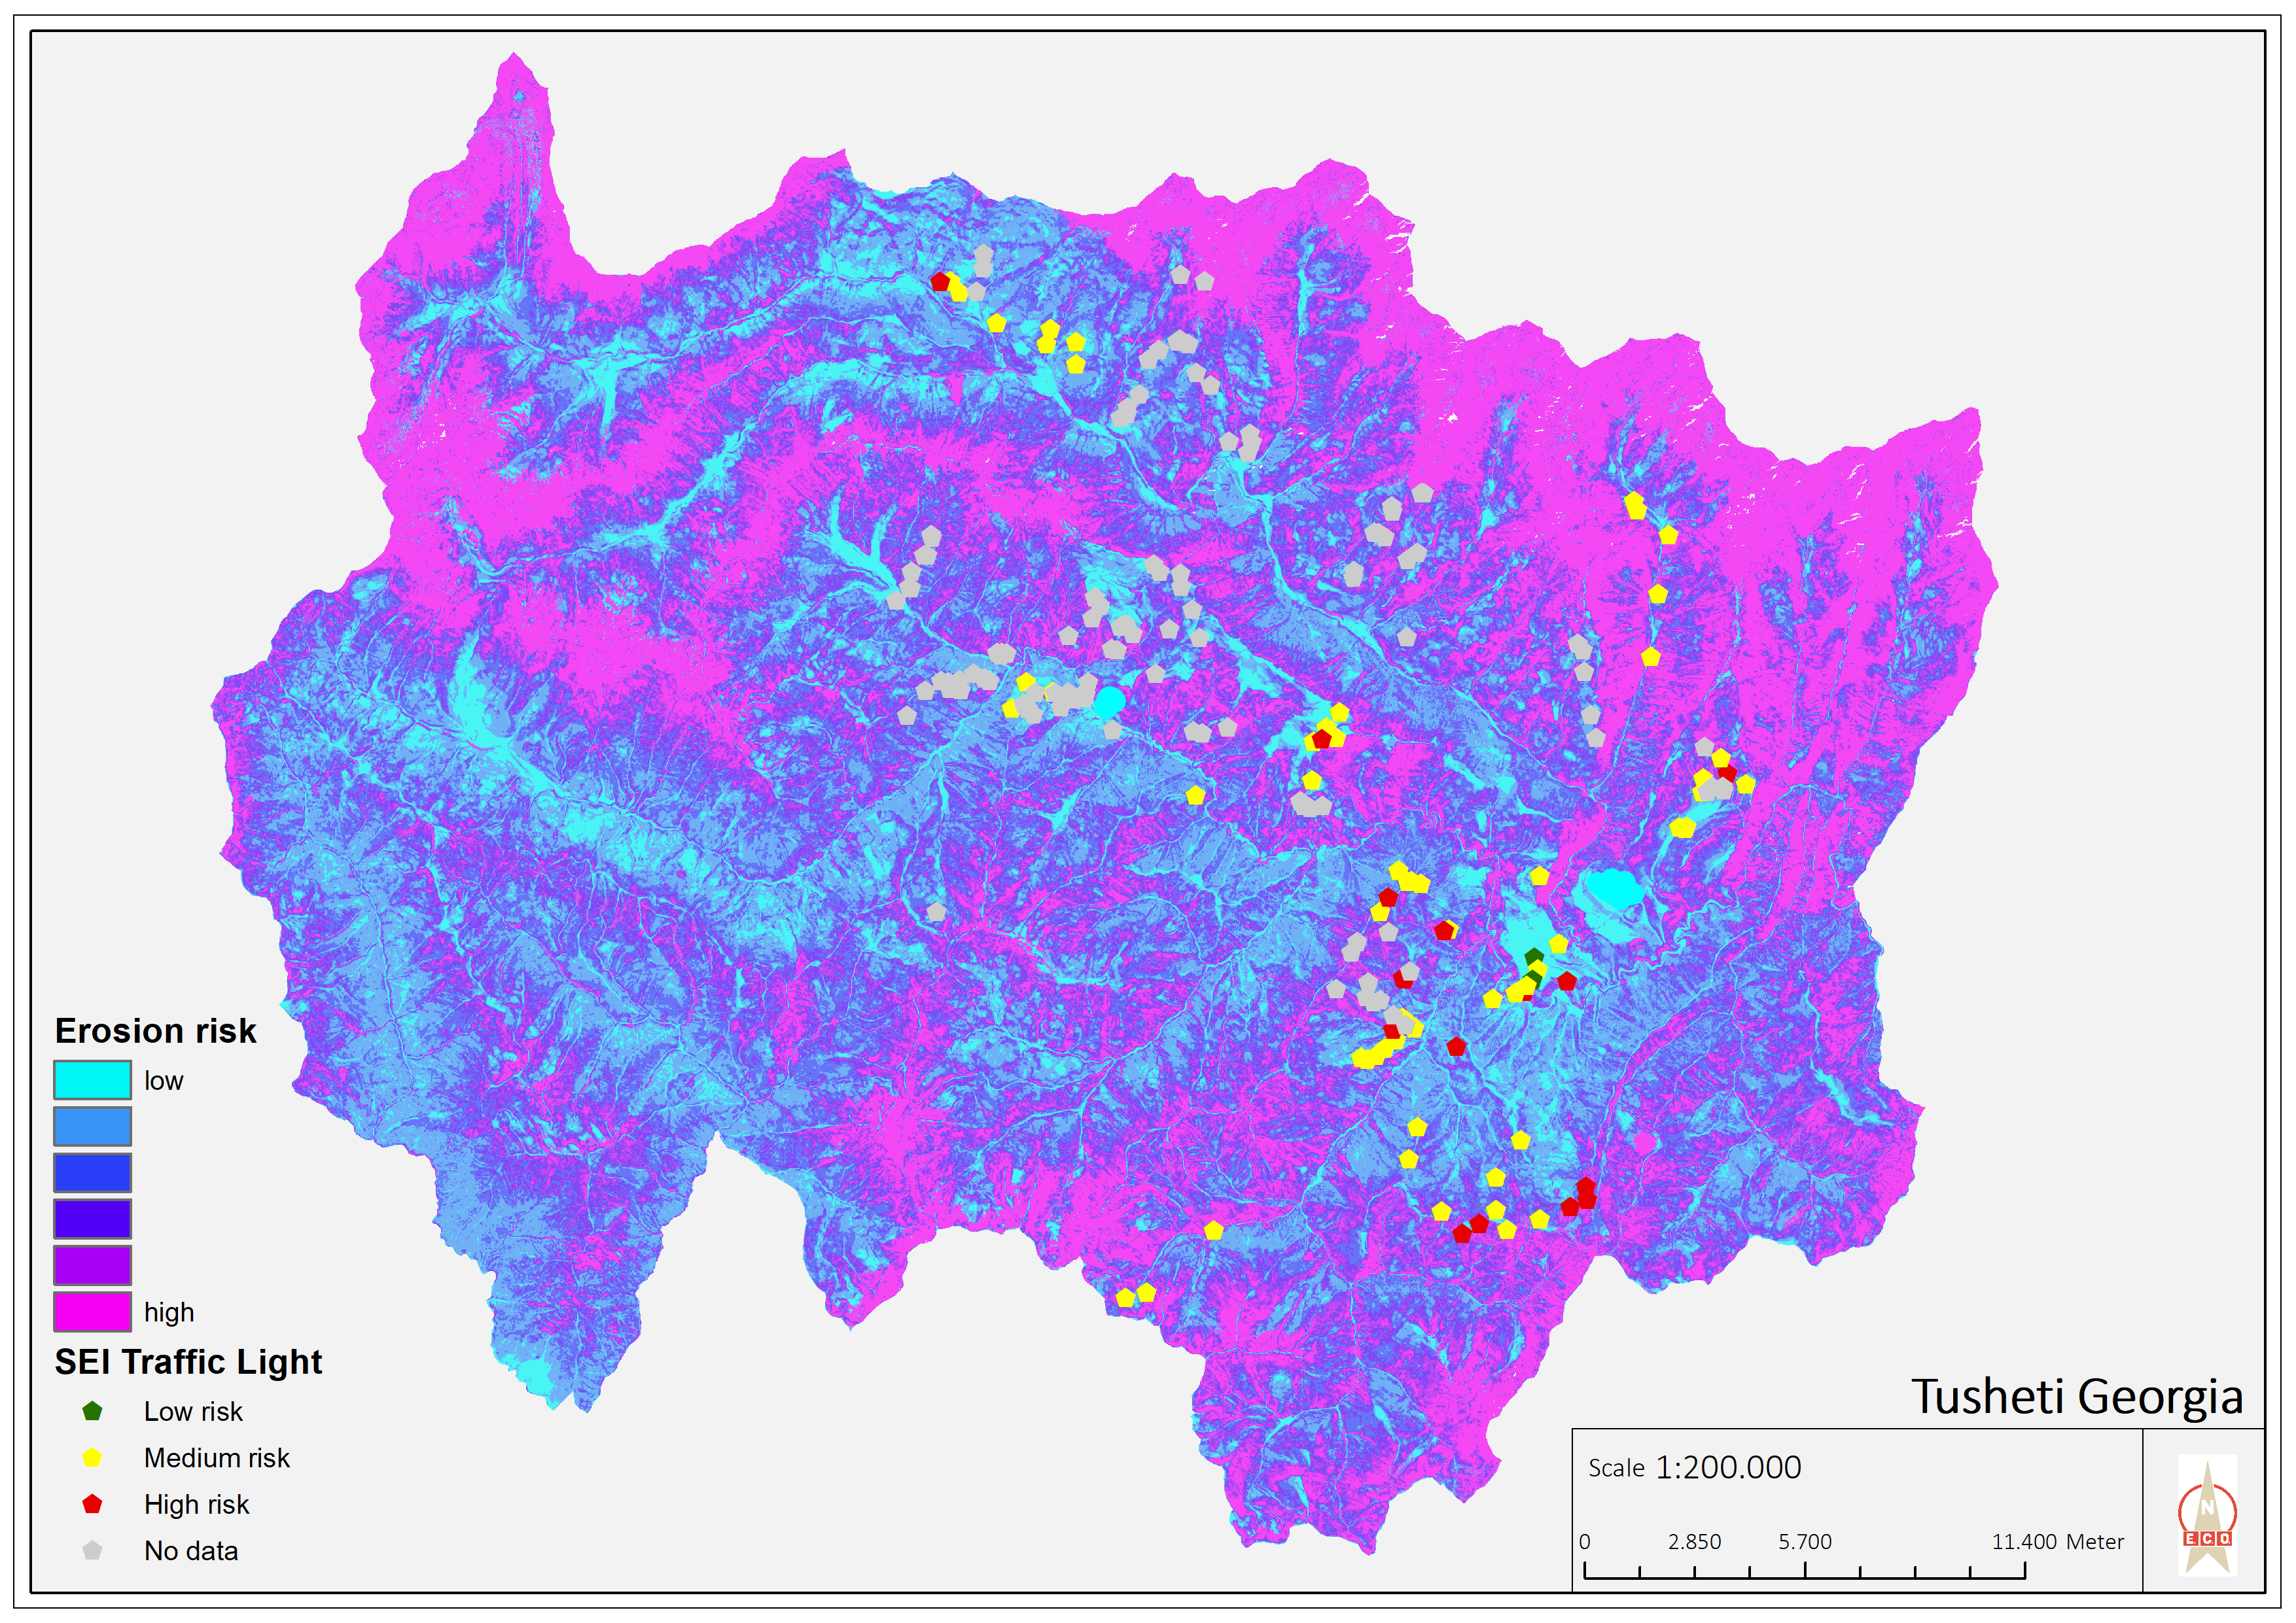
Map of erosion hot spots (pink colour) and the location of field sample plots for evaluation and ground truthing.
ຜູ້ຂຽນ:
Hanns Kirchmeir
ວັນທີ:
11/09/2019
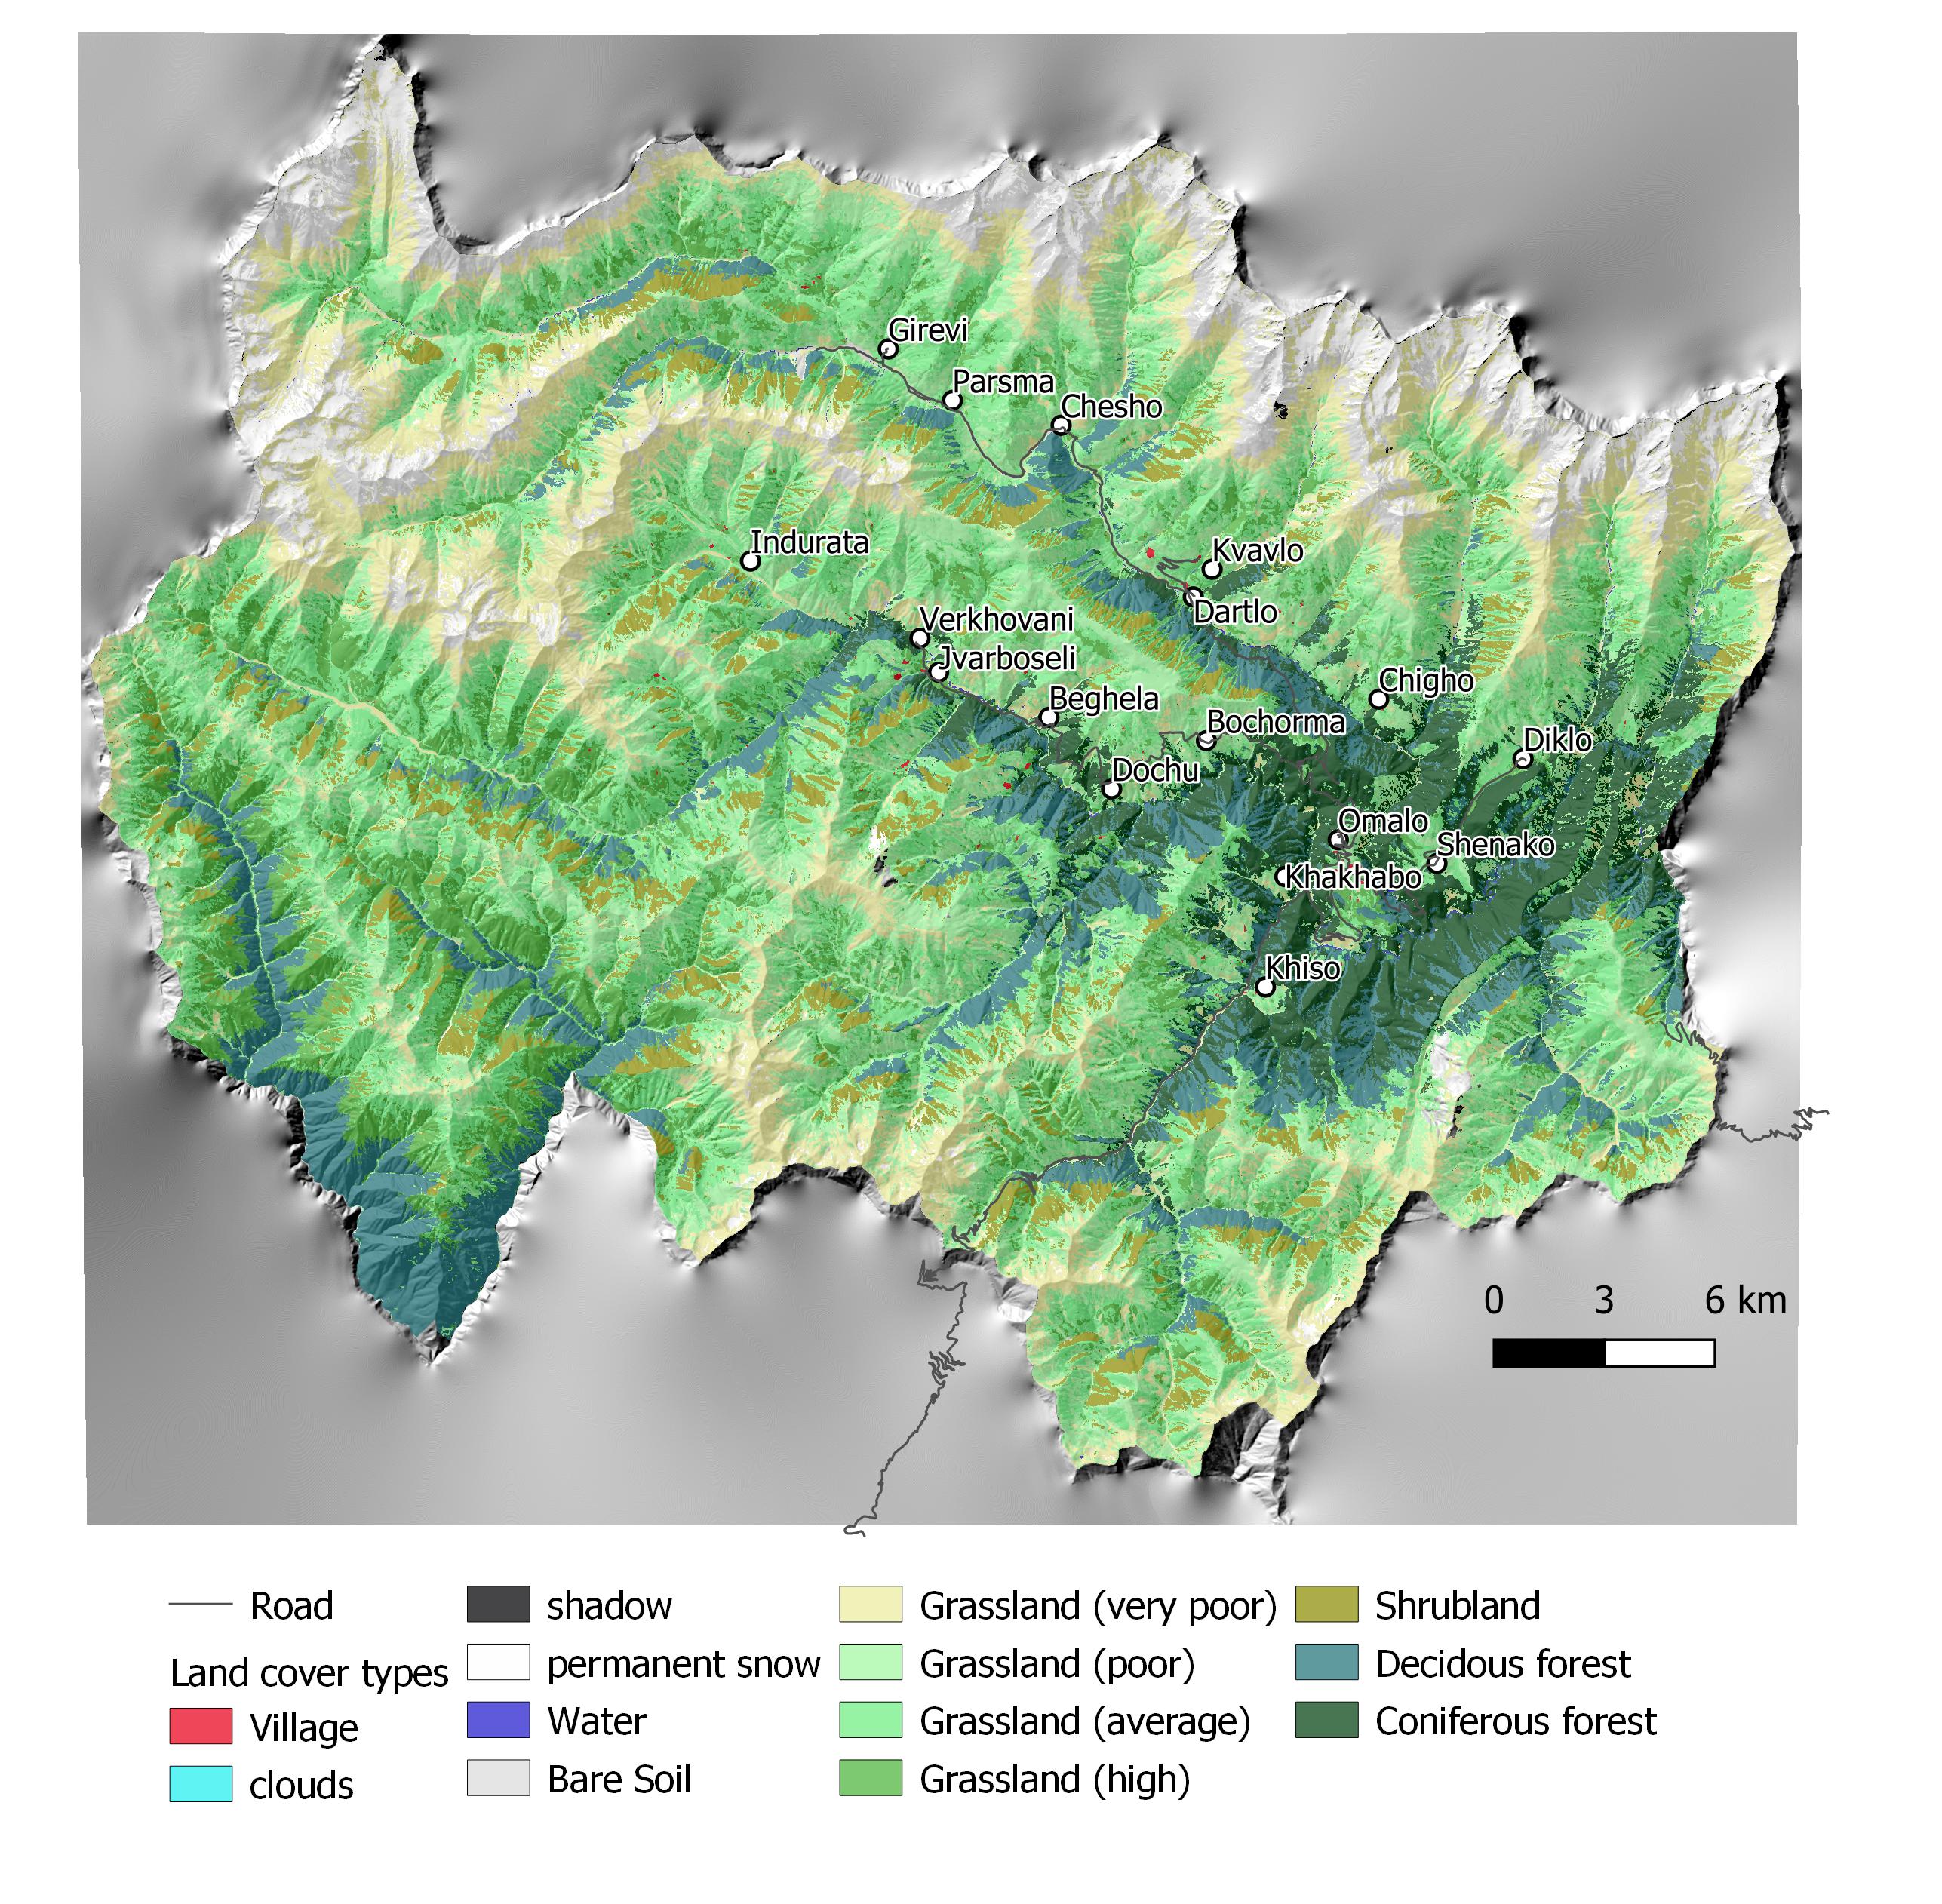
ຄຸນລັກສະນະ ຂອງເຕັກນິກ (ທີ່ກ່ຽວຂ້ອງ ກັບການແຕ້ມແຜນວາດ ທາງດ້ານເຕັກນີກ):
Map of land cover classification derived from satellite images. The different grassland types are classified by their biomass as an indicator of productivity and current state. Repeating the satellite image classification with the same parameters after 5 or 10 years can give a clear picture of changes in the land cover.
ຜູ້ຂຽນ:
Hanns Kirchmeir
ວັນທີ:
11/09/2019
4.2 ຂໍ້ມູນທົ່ວໄປກ່ຽວກັບການຄິດໄລ່ປັດໃຈຂາເຂົ້າໃນການຜະລິດ ແລະ ມູນຄ່າອື່ນໆ
ລະບຸ ວິທີການ ຄຳໃຊ້ຈ່າຍ ແລະ ປັດໄຈນໍາເຂົ້າ ທີ່ໄດ້ຄິດໄລ່:
- ຕໍ່ພື້ນທີ່ ທີ່ໄດ້ຈັດຕັ້ງປະຕິບັດ ເຕັກໂນໂລຢີ
ໃຫ້ລະບຸຫົວໜ່ວຍ ຂະໜາດ ແລະ ເນື້ອທີ່:
1000 km2
ລະບຸ ສະກຸນເງິນທີ່ໃຊ້ສໍາລັບ ການຄິດໄລ່ຄ່າໃຊ້ຈ່າຍ:
- USA
ລະບຸ ຄ່າຈ້າງ ຄ່າແຮງງານສະເລ່ຍ ຕໍ່ ວັນ:
100
4.3 ການສ້າງຕັ້ງກິດຈະກໍາ
| ກິດຈະກໍາ | Timing (season) | |
|---|---|---|
| 1. | National level. Baseline: Field assessment for remote sensing calibration (1x/20 years) | 2017 |
| 2. | Sentinel satellite image classification (multi temporal data from 2017) | 2017 |
| 3. | Statistical data from GEOSTAT Agricultural census | 2014-2016 |
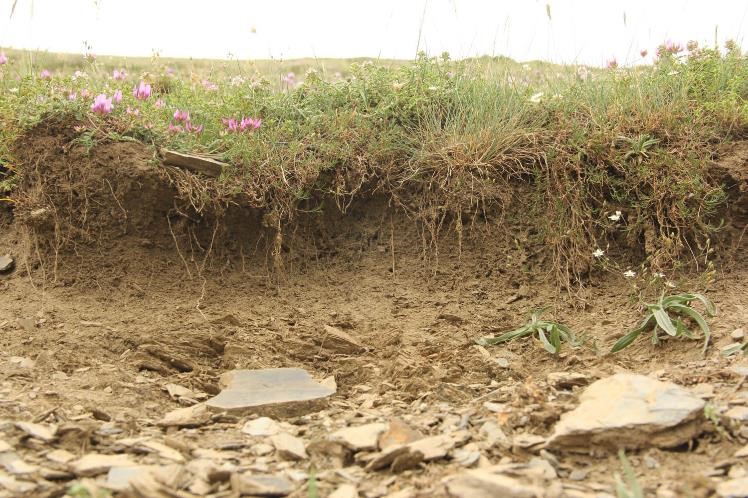
| 4. | Analysis of soil carbon content from existing profiles | 2003 - 2006 |
| 5. | Conduct ongoing monitoring | 5 years intervals |
| 6. | Update sentinel satellite image classification | 1x year |
| 7. | Update statistical data from GEOSTAT Agricultural census | 4x/year |
| 8. | Resampling of soil carbon content near existing profiles | 1x/5 years |
| 9. | Municipal level. Spatial planning: Assessment of current stage of land degradation, anticipated gains and losses | 1x/10 years |
| 10. | Revision of spatial planning on Municipal level. | 1x / 5 years |
4.4 ຕົ້ນທຶນ ແລະ ປັດໄຈຂາເຂົ້າທີ່ຈໍາເປັນໃນຈັດຕັ້ງປະຕິບັດ
| ລະບຸ ປັດໃຈ ນໍາເຂົ້າ ໃນການຜະລີດ | ຫົວໜ່ວຍ | ປະລິມານ | ຕົ້ນທຶນ ຕໍ່ຫົວໜ່ວຍ | ຕົ້ນທຶນທັງໝົດ ຂອງປັດໃຈຂາເຂົ້າ ໃນການຜະລິດ | % ຂອງຕົ້ນທຶນທັງໝົດ ທີ່ຜູ້ນໍາໃຊ້ທີ່ດິນ ໃຊ້ຈ່າຍເອງ | |
|---|---|---|---|---|---|---|
| ແຮງງານ | Remote Sensing analysis by Sentinel Satellite data | person days | 50.0 | 200.0 | 10000.0 | |
| ແຮງງານ | Collecting field data for satellite image callibration | person days | 40.0 | 200.0 | 8000.0 | |
| ແຮງງານ | Soil sampling (for carbon content) | person days | 20.0 | 200.0 | 4000.0 | |
| ແຮງງານ | Including results in spatial planning | person days | 10.0 | 200.0 | 2000.0 | |
| ຕົ້ນທຶນທັງໝົດ ໃນການຈັດຕັ້ງປະຕິບັດ ເຕັກໂນໂລຢີ | 24000.0 | |||||
| ຄ່າໃຊ້ຈ່າຍທັງໝົດ ສຳລັບການສ້າງຕັ້ງເຕັກໂນໂລຢີ ເປັນສະກຸນເງີນໂດລາ | 24000.0 | |||||
ຄວາມຄິດເຫັນ:
This covers the implementation of the baseline. Calibrating the model for erosion risk and land cover classification is an big investment but can be extended to larger areas than 1000 km² with similar resources.
4.5 ບໍາລຸງຮັກສາ / ແຜນຈັດຕັ້ງປະຕິບັດ ກິດຈະກໍາ
| ກິດຈະກໍາ | ໄລຍະເວລາ / ຄວາມຖີ່ | |
|---|---|---|
| 1. | Repeating the application of the calibrated remote sensing model for monitoring repitition | with 5 years interval |
| 2. | Repetition of soil samples for assessing soil carbon content | with 5 years interval |
| 3. | Analysing the results and integrate them in spatial planning and policy making | with 5 years interval |
4.6 ຄ່າໃຊ້ຈ່າຍ ແລະ ປັດໄຈນໍາເຂົ້າທີ່ຈໍາເປັນສໍາລັບການບໍາລຸງຮັກສາກິດຈະກໍາ / ແຜນປະຕິບັດ (ຕໍ່ປີ)
| ລະບຸ ປັດໃຈ ນໍາເຂົ້າ ໃນການຜະລີດ | ຫົວໜ່ວຍ | ປະລິມານ | ຕົ້ນທຶນ ຕໍ່ຫົວໜ່ວຍ | ຕົ້ນທຶນທັງໝົດ ຂອງປັດໃຈຂາເຂົ້າ ໃນການຜະລິດ | % ຂອງຕົ້ນທຶນທັງໝົດ ທີ່ຜູ້ນໍາໃຊ້ທີ່ດິນ ໃຊ້ຈ່າຍເອງ | |
|---|---|---|---|---|---|---|
| ແຮງງານ | Applying the calibrated remote sensing model for monitoring repetition | person days | 20.0 | 200.0 | 4000.0 | |
| ແຮງງານ | Repetition of soil samples for assessing soil carbon content | person days | 10.0 | 200.0 | 2000.0 | |
| ແຮງງານ | Analysing results and integrating in spatial planning | person days | 10.0 | 200.0 | 2000.0 | |
| ຕົ້ນທຶນທັງໝົດ ທີ່ໃຊ້ໃນການບໍາລຸງຮັກສາ ເຕັກໂນໂລຢີ | 8000.0 | |||||
| ຄ່າໃຊ້ຈ່າຍທັງໝົດ ສຳລັບການບົວລະບັດຮກສາເຕັກໂນໂລຢີ ເປັນສະກຸນເງີນໂດລາ | 8000.0 | |||||
ຄວາມຄິດເຫັນ:
For the repetition of the remote sensing no new calibration of the GIS-model is needed. Only the field samples for soil carbon need to be repeated.
4.7 ປັດໄຈ ທີ່ສໍາຄັນ ທີ່ສົ່ງຜົນກະທົບ ຕໍ່ຄ່າໃຊ້ຈ່າຍ
ໃຫ້ອະທິບາຍ ປັດໃຈ ທີ່ສົ່ງຜົນກະທົບ ຕໍ່ຕົ້ນທຶນ ໃນການຈັດຕັ້ງປະຕິບັດ:
Field sample collection;
Remote sensing experts.
5. ສະພາບແວດລ້ອມທໍາມະຊາດ ແລະ ມະນຸດ
5.1 ອາກາດ
ປະລິມານນໍ້າຝົນປະຈໍາປີ
- < 250 ມີລິແມັດ
- 251-500 ມີລິແມັດ
- 501-750 ມີລິແມັດ
- 751-1,000 ມີລິແມັດ
- 1,001-1,500 ມີລິແມັດ
- 1,501-2,000 ມີລິແມັດ
- 2,001-3,000 ມີລິແມັດ
- 3,001-4,000 ມີລິແມັດ
- > 4,000 ມີລິແມັດ
ໃຫ້ລະບຸສະເລ່ຍ ປະລິມານນໍ້າຝົນຕົກປະຈໍາປີ ເປັນມິນລິແມັດ (ຖ້າຫາກຮູ້ຈັກ):
800.00
ຂໍ້ມູນສະເພາະ / ຄວາມເຫັນກ່ຽວກັບ ປະລິມານນໍ້າຝົນ:
The climate is generally suitable for agriculture with an annual precipitation of up to 800 mm, with hot and humid springs, rainfall peaks in May and June with hot and dry summers.
ເຂດສະພາບອາກາດກະສິກໍາ
- ເຄີ່ງຄວາມຊຸ່ມ
- ເຄິ່ງແຫ້ງແລ້ງ
5.2 ພູມິປະເທດ
ຄ່າສະເລ່ຍ ຄວາມຄ້ອຍຊັນ:
- ພື້ນທີ່ຮາບພຽງ (0-2%)
- ອ່ອນ (3-5 %)
- ປານກາງ (6-10 %)
- ມ້ວນ (11-15 %)
- ເນີນ(16-30%)
- ໍຊັນ (31-60%)
- ຊັນຫຼາຍ (>60%)
ຮູບແບບຂອງດິນ:
- ພູພຽງ / ທົ່ງພຽງ
- ສັນພູ
- ເປີ້ນພູ
- ເນີນພູ
- ຕີນພູ
- ຮ່ອມພູ
ເຂດລະດັບສູງ:
- 0-100 ແມັດ a.s.l.
- 101-500 ແມັດ a.s.l.
- 501-1,000 ແມັດ a.s.l.
- 1,001-1,500 ແມັດ a.s.l.
- 1,501-2,000 ແມັດ a.s.l.
- 2,001-2,500 ແມັດ a.s.l.
- 2,501-3,000 ແມັດ a.s.l.
- 3,001-4,000 ແມັດ a.s.l.
- > 4,000 ແມັດ a.s.l.
ໃຫ້ລະບຸ ເຕັກໂນໂລຢີ ທີ່ໄດ້ຖືກນຳໃຊ້:
- ບໍ່ກ່ຽວຂ້ອງ
ຄຳເຫັນ ແລະ ຂໍ້ມູນສະເພາະ ເພີ່ມເຕີມ ກ່ຽວກັບ ພູມີປະເທດ:
The remote sensing approach was applied for the total landscape of Tusheti, including a great variety of land-forms, altitudes ranging from 1600-4000 m a.s.l.
5.3 ດິນ
ຄວາມເລິກ ຂອງດິນສະເລ່ຍ:
- ຕື້ນຫຼາຍ (0-20 ຊັງຕີແມັດ)
- ຕື້ນ (21-50 ຊຕມ)
- ເລີກປານກາງ (51-80 ຊຕມ)
- ເລິກ (81-120 ຊມ)
- ເລິກຫຼາຍ (> 120 cm)
ເນື້ອດິນ (ໜ້າດິນ):
- ປານກາງ (ດິນໜຽວ, ດິນໂຄນ)
ເນື້ອດິນ (ເລິກຈາກໜ້າດິນ ລົງໄປຫຼາຍກວ່າ 20 ຊັງຕິແມັດ):
- ປານກາງ (ດິນໜຽວ, ດິນໂຄນ)
ຊັ້ນອິນຊີວັດຖຸ ເທິງໜ້າດິນ:
- ປານກາງ (1-3 %)
5.4 ມີນໍ້າ ແລະ ຄຸນນະພາບ
ລະດັບ ນໍ້າໃຕ້ດິນ:
ເທິງຊັ້ນໜ້າດິນ
ການມີນໍ້າ ເທິງໜ້າດິນ:
ປານກາງ
ຄຸນນະພາບນໍ້າ (ບໍ່ມີການບໍາບັດ):
ບໍ່ມີນໍ້າດື່ມ (ຮຽກຮ້ອງໃຫ້ມີການບຳບັດນ້ຳ)
ຄຸນນະພາບນ້ຳ ໝາຍເຖີງ:
ທັງນ້ຳໃຕ້ດິນ ແລະ ນ້ຳໜ້າດິນ
ມີບັນຫາ ກ່ຽວກັບນໍ້າເຄັມບໍ່?
ບໍ່ແມ່ນ
ເກີດມີນໍ້າຖ້ວມ ໃນພື້ນທີ່ບໍ່?
ບໍ່ແມ່ນ
5.5 ຊີວະນາໆພັນ
ຄວາມຫຼາກຫຼາຍ ທາງສາຍພັນ:
- ປານກາງ
ຄວາມຫຼາກຫຼາຍ ທາງດ້ານ ທີ່ຢູ່ອາໃສ ຂອງສິ່ງທີ່ມີຊີວິດ:
- ສູງ
5.6 ຄຸນລັກສະນະ ຂອງຜູ້ນໍາໃຊ້ທີ່ດິນ ທີ່ໄດ້ນໍາໃຊ້ເຕັກໂນໂລຢີ
ຢູ່ປະຈຳ ຫຼື ເຄື່ອນຍ້າຍຕະຫຼອດ:
- ແບບເຄີ່ງຂັງ-ເຄີ່ງປ່ອຍ
ລະບົບ ການຕະຫຼາດ ແລະ ຜົນຜະລິດ:
- ປະສົມປົນເປ( ກຸ້ມຕົນເອງ/ເປັນສິນຄ້າ)
ລາຍຮັບ ທີ່ບໍ່ໄດ້ມາຈາກ ການຜະລິດ ກະສິກໍາ:
- ໜ້ອຍກ່ວາ 10 % ຂອງລາຍຮັບທັງໝົດ
ລະດັບຄວາມຮັ່ງມີ:
- ທຸກຍາກ
ບຸກຄົນ ຫຼື ກຸ່ມ:
- ບຸກຄົນ / ຄົວເຮືອນ
ລະດັບ ການຫັນເປັນກົນຈັກ:
- ການໃຊ້ແຮງງານຄົນ
- ສັດລາກແກ່
ເພດ:
- ຜູ້ຍິງ
- ຜູ້ຊາຍ
ອາຍຸ ຂອງຜູ້ນໍາໃຊ້ທີ່ດິນ:
- ໄວກາງຄົນ
ໃຫ້ລະບຸ ຄຸນລັກສະນະ ຂອງຜູ້ນໍາໃຊ້ທີ່ດິນ:
The technology is applied by the Government.
5.7 ເນື້ອທີ່ສະເລ່ຍຂອງດິນ ທີ່ຜູ້ນຳໃຊ້ທີ່ດິນ ໃຊ້ເຮັດເຕັກໂນໂລຢີ
- <0.5 ເຮັກຕາ
- 0.5-1 ເຮັກຕາ
- 1-2 ເຮັກຕາ
- 2-5 ເຮັກຕາ
- 5-15 ເຮັກຕາ
- 15-50 ເຮັກຕາ
- 50-100 ເຮັກຕາ
- 100-500 ເຮັກຕາ
- 500-1,000 ເຮັກຕາ
- 1,000-10,000 ເຮັກຕາ
- > 10,000 ເຮັກຕາ
ຖືໄດ້ວ່າ ເປັນຂະໜາດນ້ອຍ, ກາງ ຫຼື ໃຫຍ່ (ອີງຕາມເງື່ອນໄຂ ສະພາບຄວາມເປັນຈິງ ຂອງທ້ອງຖີ່ນ)? :
- ຂະໜາດກາງ
ຄວາມຄິດເຫັນ:
The pasture units are fom 200 to 600 hectares and are based on the old Soviet grazing scheme.
5.8 ເຈົ້າຂອງທີ່ດິນ, ສິດໃຊ້ທີ່ດິນ, ແລະ ສິດທິການນໍາໃຊ້ນໍ້າ
ເຈົ້າຂອງດິນ:
- ລັດ
ສິດທິ ໃນການນໍາໃຊ້ທີ່ດິນ:
- ຊຸມຊົນ (ທີ່ມີການຈັດຕັ້ງ)
- ເຊົ່າ
ສິດທິ ໃນການນໍາໃຊ້ນໍ້າ:
- ເປີດກວ້າງ (ບໍ່ມີການຈັດຕັ້ງ)
ສິດນຳໃຊ້ທີ່ດິນ ແມ່ນ ອີງໃສ່ລະບົບກົດໝາຍແບບດັ້ງເດີມບໍ?
ບໍ່ແມ່ນ
5.9 ການເຂົ້າເຖິງການບໍລິການ ແລະ ພື້ນຖານໂຄງລ່າງ
ສຸຂະພາບ:
- ທຸກຍາກ
- ປານກາງ
- ດີ
ການສຶກສາ:
- ທຸກຍາກ
- ປານກາງ
- ດີ
ການຊ່ວຍເຫຼືອ ດ້ານວິຊາການ:
- ທຸກຍາກ
- ປານກາງ
- ດີ
ການຈ້າງງານ (ຕົວຢ່າງ, ການເຮັດກິດຈະກໍາອື່ນ ທີ່ບໍ່ແມ່ນ ການຜະລິດກະສິກໍາ):
- ທຸກຍາກ
- ປານກາງ
- ດີ
ຕະຫຼາດ:
- ທຸກຍາກ
- ປານກາງ
- ດີ
ພະລັງງານ:
- ທຸກຍາກ
- ປານກາງ
- ດີ
ຖະໜົນຫົນທາງ ແລະ ການຂົນສົ່ງ:
- ທຸກຍາກ
- ປານກາງ
- ດີ
ການດື່ມນໍ້າ ແລະ ສຸຂາພິບານ:
- ທຸກຍາກ
- ປານກາງ
- ດີ
ການບໍລິການ ທາງດ້ານການເງິນ:
- ທຸກຍາກ
- ປານກາງ
- ດີ
6. ຜົນກະທົບ ແລະ ລາຍງານສະຫຼຸບ
6.1 ການສະແດງຜົນກະທົບ ພາຍໃນພື້ນທີ່ ທີ່ໄດ້ຈັດຕັ້ງປະຕິບັດ ເຕັກໂນໂລຢີ
ຜົນກະທົບຕໍ່ລະບົບນິເວດ
ດິນ
ການປົກຄຸມຂອງດິນ
ຄວາມຄິດເຫັນ / ລະບຸແຈ້ງ:
Within the timeframe until 2030, specific process indicators to assess the progress will be done.
ຜົນກະທົບຕໍ່ລະບົບນິເວດອື່ນໆ
Changes in the quality of forests
ຄວາມຄິດເຫັນ / ລະບຸແຈ້ງ:
tree height, stand density
Changes of the quality of pastures
ຄວາມຄິດເຫັນ / ລະບຸແຈ້ງ:
biomass production
Changes in the quality of arable land
ຄວາມຄິດເຫັນ / ລະບຸແຈ້ງ:
yield
ລະບຸ ການປະເມີນຜົນກະທົບ ຕໍ່ສະຖານທີ່ (ການວັດແທກ):
The monitoring technology was applied for the first time to draw a baseline. Based on the results, activities have been planned and pilot measures have been implemented (exclusion from grazing, reforestation, regulation of grazing intensity). Future replications of the monitoring will show changes and evaluate success of measures. The technologies to control erosion are described separately in the WOCAT database (Community-based Erosion Control [Azerbaijan]; Pasture-weed control by thistle cutting [Georgia]; High-altitude afforestation for erosion control [Armenia]; Slope erosion control using wooden pile walls [Armenia])
6.2 ຜົນກະທົບທາງອ້ອມ ຈາກການນໍາໃຊ້ເຕັກໂນໂລຢີ
ກໍານົດ ການປະເມີນ ຜົນກະທົບທາງນອກ (ການວັດແທກ):
The technology is only about the monitoring (see above).
6.3 ການປ້ອງກັນ ແລະ ຄວາມບອບບາງ ຂອງເຕັກໂນໂລຢິ ໃນການປ່ຽນແປງສະພາບດິນຟ້າອາກາດ ແລະ ກ່ຽວຂ້ອງກັບອາກາດທີ່ມີການປ່ຽນແປງທີ່ຮຸນແຮງ / ໄພພິບັດທາງທໍາມະຊາດ (ຮັບຮູ້ໄດ້ໂດຍຜູ້ນໍາໃຊ້ທີ່ດິນ)
ການປ່ຽນແປງດິນຟ້າອາກາດ ເທື່ອລະກ້າວ
ການປ່ຽນແປງດິນຟ້າອາກາດ ເທື່ອລະກ້າວ
| ລະດູການ | ເພີ່ມຂື້ນ ຫຼື ຫຼຸດລົງ | ການນໍາໃຊ້ ເຕັກໂນໂລຢີ ສາມາດ ຮັບມື ໄດ້ຄືແນວໃດ? | |
|---|---|---|---|
| ປະລິມານນໍ້າຝົນຕາມລະດູການ | ລະດູຮ້ອນ | ຫຼຸດລົງ | ດີຫຼາຍ |
ຄວາມຄິດເຫັນ:
Technology is sensitive, it shows the climate change, the impact of the global change locally. The technology itself is not affected by climatic changes.
6.4 ການວິເຄາະຕົ້ນທຶນ ແລະ ຜົນປະໂຫຍດ
ຈະເຮັດປະໂຫຍດເພື່ອປຽບທຽບກັບຄ່າໃຊ້ຈ່າຍກັບສິ່ງກໍ່ສ້າງ (ຈາກທັດສະນະຂອງຜູ້ນຳໃຊ້ທີ່ດິນ) ໄດ້ແນວໃດ?
ຜົນຕອບແທນ ໃນໄລຍະສັ້ນ:
ປານກາງ
ຜົນຕອບແທນ ໃນໄລຍະຍາວ:
ຜົນກະທົບທາງບວກ
ຈະໄດ້ຮັບຜົນປະໂຫຍດເມື່ອປຽບທຽບກັບ / ຄ່າໃຊ້ຈ່າຍໃນການບຳລຸງຮັກສາທີເ່ກີດຂື້ນອິກ (ຈາກທັດສະນະຄະຕິຂອງຜູ້ນຳໃຊ້ທີ່ດິນ) ໄດ້ແນວໃດ?
ຜົນຕອບແທນ ໃນໄລຍະສັ້ນ:
ປານກາງ
ຜົນຕອບແທນ ໃນໄລຍະຍາວ:
ຜົນກະທົບທາງບວກເລັກນ້ອຍ
ຄວາມຄິດເຫັນ:
The monitoring technology was applied for the first time to draw a baseline. Based on the results, activities have been planned and pilot measures have been implemented (exclusion from grazing, reforestation, regulation of grazing intensity). Future replications of the monitoring will show changes and evaluate success of measures. The technologies to control erosion are described separately in the WOCAT database (Community-based Erosion Control [Azerbaijan]; Pasture-weed control by thistle cutting [Georgia]; High-altitude afforestation for erosion control [Armenia]; Slope erosion control using wooden pile walls [Armenia]).
The costs of the remote sensing approach have not been invested by the land owners but by GIZ and the Ministry. Therefore there are no direct negative impact caused by the investment. The maintenance will be covered by public authorities as well. The positive impact for the land users are the clearly delineated pasture unit giving the exact area of grassland and the accessible amount of fodder biomass. By this, the lease-rate can be found according to the productivity and the number of livestock can be adapted to the carrying capacity of the land within the lease contract.
6.5 ການປັບຕົວຮັບເອົາເຕັກໂນໂລຢີ
- ກໍລະນີດຽວ / ການທົດລອງ
ຖ້າຫາກວ່າມີ, ປະລິມານ (ຈໍານວນຂອງຄົວເຮືອນ / ເນື້ອທີ່ການຄຸ້ມຄອງ):
The technology is desigend to be applied by national or regional addministrations and not by land owners themselves.
6.6 ການປັບຕົວ
ໄດ້ມີການດັດປັບ ເຕັກໂນໂລຢີ ເພື່ອໃຫ້ແທດເໝາະກັບເງື່ອນໄຂ ການປ່ຽນແປງບໍ?
ບໍ່ແມ່ນ
6.7 ຈຸດແຂງ / ຂໍ້ດີ / ໂອກາດ ໃນການນໍາໃຊ້ ເຕັກໂນໂລຢີ
| ຈຸດແຂງ / ຂໍ້ດີ / ໂອກາດໃນການນໍາໃຊ້ທີ່ດິນ |
|---|
| The monitoring technology can help to find erosion and degradation hot spots and based on this spatial information counter measures can be applied to save the productivity of land. As the income from agricultural activities and livestock breeding is of high priority in this pilot region, the protection of the productivity of land is of high importance to the local land users. |
| ຈຸດແຂງ / ຈຸດດີ / ໂອກາດ ຈາກທັດສະນະຂອງຜູ້ປ້ອນຂໍ້ມູນ ຫຼື ບຸກຄົນສຳຄັນ |
|---|
| The presented remote sensing technologies are a cost efficient and objective way to monitor land degradation and land use changes on large areas on long time periods. Based on this spatial data, land use regulations can be integrated in spatial planning and other legal and practical frameworks (e.g. pasture lease contracts) to counter act the degradation processes. The success of the measures and the development of degradation and rehabilitation can be monitored by the same toolset. |
6.8 ຈຸດອ່ອນ / ຂໍ້ເສຍ / ຄວາມສ່ຽງ ໃນການນໍາໃຊ້ ເຕັກໂນໂລຢີ ແລະ ວິທີການແກ້ໄຂບັນຫາ
| ຈຸດອ່ອນ / ຂໍ້ເສຍ / ຄວາມສ່ຽງໃນມຸມມອງຂອງຜູ້ນໍາໃຊ້ທີ່ດິນ | ມີວິທີການແກ້ໄຂຄືແນວໃດ? |
|---|---|
| The technology is complex and cannot be applied by the land user her-/himself and is sometimes hard to understand. Therefore they might mistrust in the results and are not eager to accept regulations and measures to stop degradation. | Transparent documentation of the technology and regular field visits to evaluate together with the land owners and users the remote sensing results in the field. |
| ຈຸດອ່ອນ/ຂໍ້ບົກຜ່ອງ/ຄວາມສ່ຽງ ຈາກທັດສະນະຂອງຜູ້ປ້ອນຂໍ້ມູນ ຫຼື ບຸກຄົນສຳຄັນ | ມີວິທີການແກ້ໄຂຄືແນວໃດ? |
|---|---|
| The institutional setup on the national level for the regular application of the remote sensing technology and the storage and management of the monitoring data is not established yet. GIS, remote sensing and soil experts are of limited availability. | Institutional capacity building and academic training courses provided at the Georgian universities can help to overcome these limitations. |
| Field data for calibration of satellite images (biomass volumes, classified land cover types, soil types, land management types) with exact information on the spatial location are rare and costly to be created. | Such data and information should be organised and gathered on national level across different sectors (agriculture, forestry, spatial planing, nature conservation ...). This would help to reduce significantly the costs and remote sensing could be applied on much larger areas. |
7. ເອກະສານອ້າງອີງ ແລະ ການເຊື່ອມຕໍ່
7.1 ວິທີການ / ແຫຼ່ງຂໍ້ມູນ
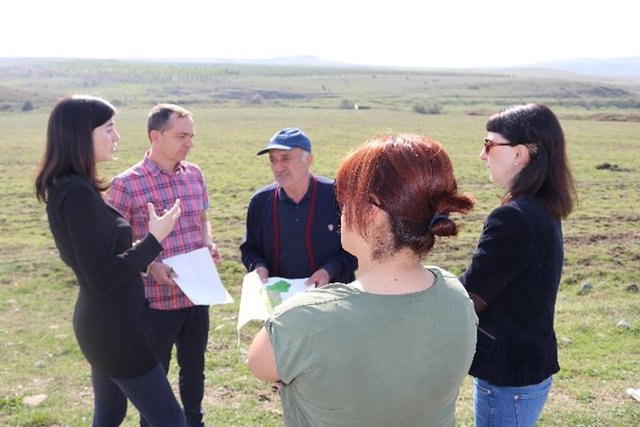
- ການໄປຢ້ຽມຢາມພາກສະໜາມ, ການສໍາຫຼວດພາກສະໜາມ
Three field visits with national and international experts as well as representatives of administrations and local stakeholders.
- ການສໍາພາດ ຜູ້ນໍາໃຊ້ທີ່ດິນ
Meeting with cooperation partners, key village stakeholders from three pilot municipalities.
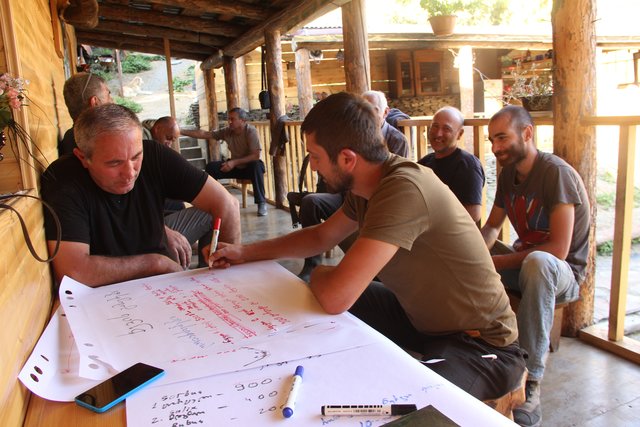
- ສໍາພາດ ຊ່ຽວຊານ ການຄຸ້ມຄອງ ດິນແບບຍືນຍົງ
Three mission meetings with 35 experts.
- ການລວບລວມ ບົດລາຍງານ ແລະ ເອກະສານ ອື່ນໆ ທີ່ມີຢູ່ແລ້ວ
Pilot project on land degradation neutrality in Georgia Final Report. 20.10.2017.
GISLab 2016: Development of Land Cover and Erosion Risk Map based on remote sensing for Tusheti Protected Areas. Study within the frame of GIZ-IBIS.
7.2 ເອກກະສານອ້າງອີງທີ່ເປັນບົດລາຍງານ
ຫົວຂໍ້, ຜູ້ຂຽນ, ປີ, ISBN:
Land Degradation Neutrality 25.10.2017
ມີຢູ່ໃສ?ມູນຄ່າເທົ່າໃດ?
https://e-c-o.at/files/publications/downloads/D00813_ECO_policy_brief_LDN_Georgia_171025.pdf
7.3 ເຊື່ອມຕໍ່ກັບຂໍ້ມູນທີ່ກ່ຽວຂ້ອງໂດຍກົງ
ຫົວຂໍ້ / ພັນລະນາ:
Tools for satellite image analysis
URL:
http://step.esa.int/main/snap-2-0-out-now/
ຫົວຂໍ້ / ພັນລະນາ:
UNCCD Good Practice Guidance on SDG Indicator 15.31. (Sims et al. 2017)
URL:
https://www.unccd.int/sites/default/files/relevant-links/2017-10/Good%20Practice%20Guidance_SDG%20Indicator%2015.3.1_Version%201.0.pdf
7.4 ຄຳຄິດຄຳເຫັນທົ່ວໄປ
UNCCD Good Practice Guidance on SDG Indicator 15.31. (Sims et al. 2017) gives a detailed technical overview on methods and approaches to calculate LDN indicators by means of remote sensing data.
ຂໍ້ມູນການເຊື່ອມຕໍ່ ແລະ ເນື້ອໃນ
ຂະຫຍາຍທັງໝົດ ຍຸບທັງໝົດການເຊື່ອມຕໍ່
Land Degradation Neutrality Transformative Projects and Programmes (LDN-TPP) … [ຈີອໍເຈຍ]
In the framework of the project ‘Generating Economic and Environmental Benefits from Sustainable Land Management for Vulnerable Rural Communities of Georgia’, Land Degradation Neutrality Transformative Projects and Programmes (LDN-TPP) were developed to implement the LDN targets at municipal level. The approach defines the process to break down global and international …
- ຜູ້ສັງລວມຂໍ້ມູນ: Daniel Zollner
Integrated Pasture Management Planning in Mountainous Regions [ຈີອໍເຈຍ]
The unsustainable use of pastures and forest areas has led to soil erosion, degradation, desertification and loss of biodiversity in the high mountain areas of the South Caucasus. The development of pasture passports is part of a broader approach to a strategic pasture management plan for Tusheti. This showcase includes …
- ຜູ້ສັງລວມຂໍ້ມູນ: Hanns Kirchmeir
ເນື້ອໃນ
ບໍ່ມີເນື້ອໃນ