Application of balanced fertiliser to improve soil productivity [Bangladesh]
- Creation:
- Update:
- Compiler: Md Babul Hossain
- Editor: –
- Reviewer: Alexandra Gavilano
Shumo shar babohar
technologies_3852 - Bangladesh
View sections
Expand all Collapse all1. General information
1.2 Contact details of resource persons and institutions involved in the assessment and documentation of the Technology
Key resource person(s)
land user:
Alam Khorshed
+8801857412268
Village- South Dhalla, PS-Singair
Bangladesh
land user:
Jainul Abedin
+8801823014214
Village-South Dhalla, PS-Singair
Bangladesh
1.3 Conditions regarding the use of data documented through WOCAT
When were the data compiled (in the field)?
15/05/2018
The compiler and key resource person(s) accept the conditions regarding the use of data documented through WOCAT:
Ja
1.4 Declaration on sustainability of the described Technology
Is the Technology described here problematic with regard to land degradation, so that it cannot be declared a sustainable land management technology?
Nee
Comments:
It reduces fertility decline
2. Description of the SLM Technology
2.1 Short description of the Technology
Definition of the Technology:
To avoid fertility decline through balanced fertiliser
2.2 Detailed description of the Technology
Description:
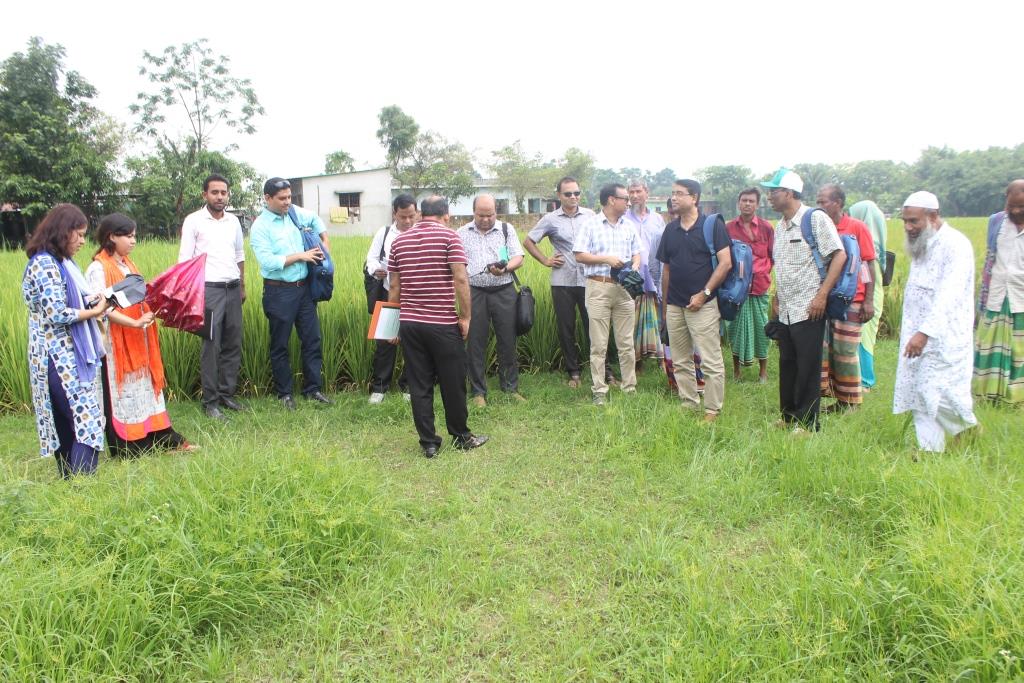
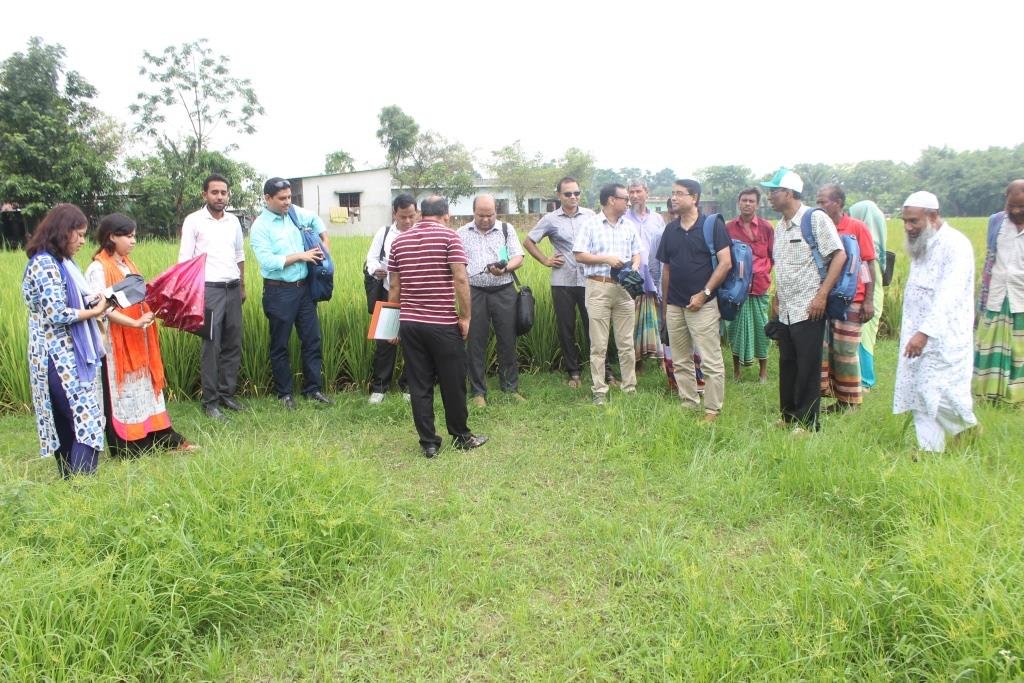
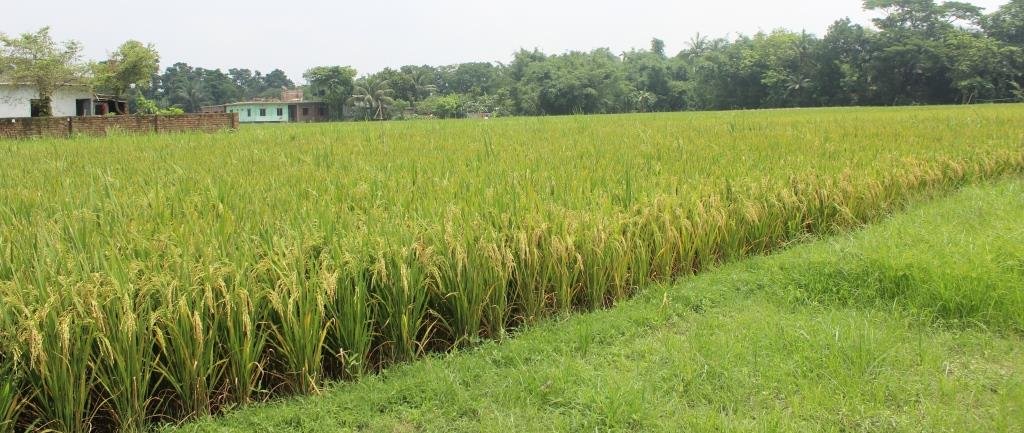
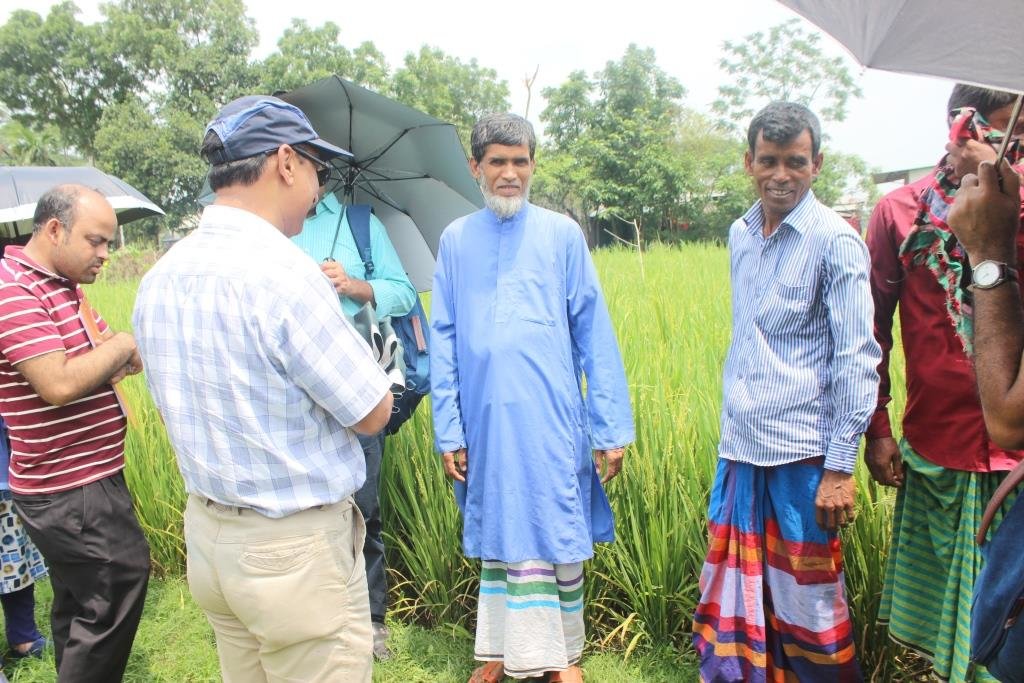
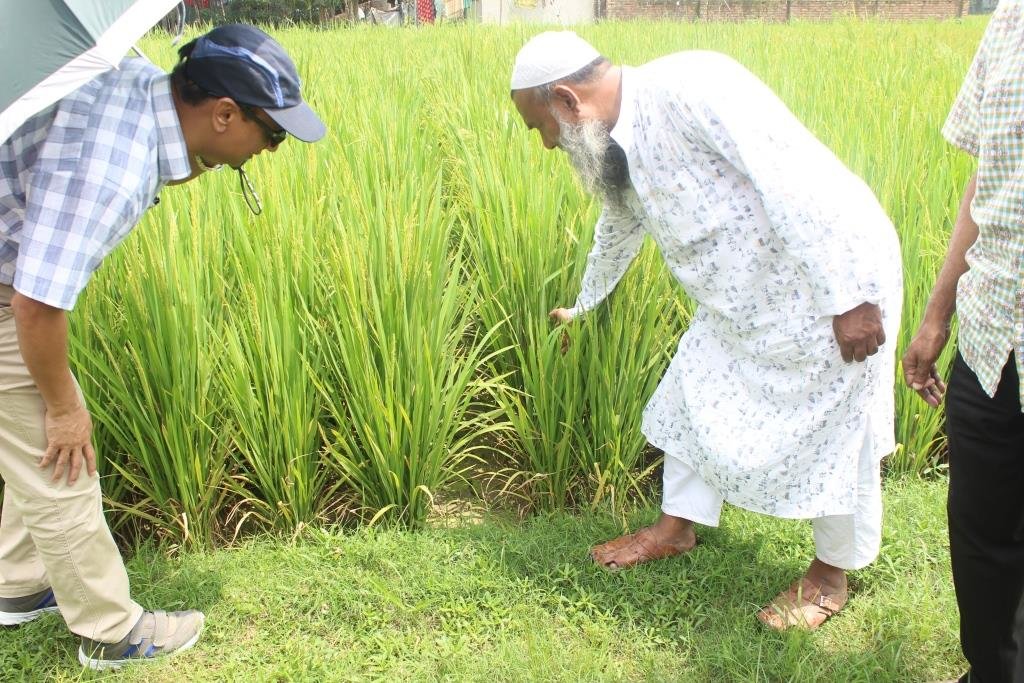
The SLM technology named ' Application of balanced fertiliser to improve soil productivity' has been introduced in Dhalla union of Singair upazila under Manikgong district of Bangladesh. The technology included applying different types of fertiliser like compost, Urea, TSP, MOP, Zypsum, Zinc Sulphate, boron etc. Compost, Urea, TSP, MOP, Zypsum , Zinc Sulphate and Boron are applied at the rate of 5 ton, 45kg, 65kg, 40 kg, 45 kg, 2 kg respectively. The main purpose of the technology was to improve soil nutrient status by using balanced fertiliser along with organic farming. The advantages achieved by the technology included nutrient mining decline, crop productivity increase and improvement of socio-economic conditions of the land users. The farmers community have accepted the well established methods of balanced fertiliser use. Because they are absolutely benefitted by this technology and it wIll mitigate the climate change impacts by reducing land degradation problem throughout the country.
2.3 Photos of the Technology
2.5 Country/ region/ locations where the Technology has been applied and which are covered by this assessment
Country:
Bangladesh
Region/ State/ Province:
Manikgong
Map
×2.6 Date of implementation
Indicate year of implementation:
1900
If precise year is not known, indicate approximate date:
- less than 10 years ago (recently)
2.7 Introduction of the Technology
- Advisory services of DAE
Comments (type of project, etc.):
SFFP project of DAE
3. Classification of the SLM Technology
3.1 Main purpose(s) of the Technology
- improve production
- reduce, prevent, restore land degradation
- conserve ecosystem
- preserve/ improve biodiversity
- adapt to climate change/ extremes and its impacts
- create beneficial social impact
3.2 Current land use type(s) where the Technology is applied

Cropland
- Annual cropping
Main crops (cash and food crops):
rice
If land use has changed due to the implementation of the Technology, indicate land use before implementation of the Technology:
rice-fallow-fallow
3.3 Further information about land use
Water supply for the land on which the Technology is applied:
- mixed rainfed-irrigated
Number of growing seasons per year:
- 3
Specify:
Rabi vegetables-irrigated rice- Rain fed rice AMAN
3.4 SLM group to which the Technology belongs
- integrated soil fertility management
3.5 Spread of the Technology
Specify the spread of the Technology:
- applied at specific points/ concentrated on a small area
Comments:
It was started in a small area but now it is spreading surrounding locations
3.6 SLM measures comprising the Technology
management measures
- M2: Change of management/ intensity level
3.7 Main types of land degradation addressed by the Technology
chemical soil deterioration
- Cn: fertility decline and reduced organic matter content (not caused by erosion)
3.8 Prevention, reduction, or restoration of land degradation
Specify the goal of the Technology with regard to land degradation:
- reduce land degradation
4. Technical specifications, implementation activities, inputs, and costs
4.1 Technical drawing of the Technology
4.2 Technical specifications/ explanations of technical drawing
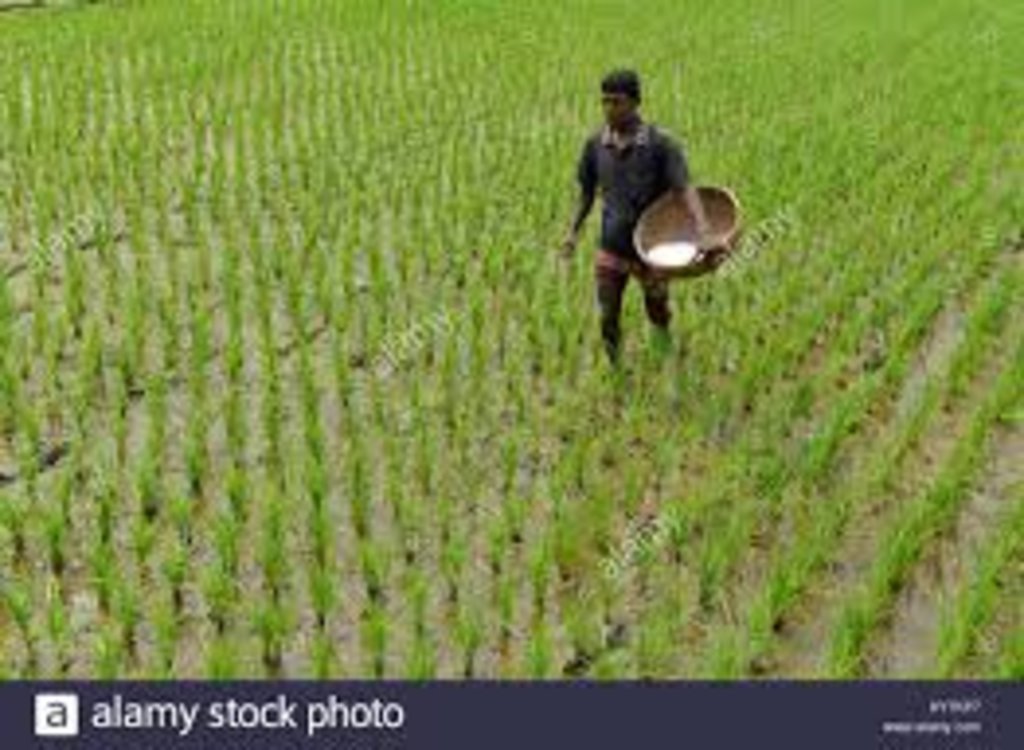
A farmer is broadcasting Urea in the paddy field. He is maintaining proper fertiliser application rate for rice field. All the fertilisers except Urea have been incorporated in the soil during final land preparation. But, Urea is being broadcasted two times after rice transplanting in the main paddy field.
4.3 General information regarding the calculation of inputs and costs
Specify how costs and inputs were calculated:
- per Technology unit
Specify unit:
1 hectare
Indicate exchange rate from USD to local currency (if relevant): 1 USD =:
83.0
Indicate average wage cost of hired labour per day:
500 TAKA
4.4 Establishment activities
| Activity | Type of measure | Timing | |
|---|---|---|---|
| 1. | Balanced fertilisers like compost,urea, TSP, MOP, Zypsum,Zinc sulphate and boron fertiliser application | Management | After final land preparation, urea, TSP,MOP and zinc sulphate fertilisers were used. Again, urea was broadcast at the age of 30 days of transplanted crop. |
| 2. | Broadcasting of Urea | Agronomic | After 30 days of transplanting |
4.5 Costs and inputs needed for establishment
| Specify input | Unit | Quantity | Costs per Unit | Total costs per input | % of costs borne by land users | |
|---|---|---|---|---|---|---|
| Labour | Farmer | person per day | 5.0 | 500.0 | 2500.0 | 80.0 |
| Fertilizers and biocides | compost | Kg/ha | 5000.0 | 5.0 | 25000.0 | 100.0 |
| Fertilizers and biocides | ||||||
| Fertilizers and biocides | TSP | Kg/ha | 65.0 | 26.0 | 1690.0 | 80.0 |
| Fertilizers and biocides | MOP | Kg/ha | 45.0 | 14.0 | 630.0 | 80.0 |
| Fertilizers and biocides | Zypsum | Kg/ha | 45.0 | 12.0 | 540.0 | 80.0 |
| Fertilizers and biocides | Zinc sulphate | Kg/ha | 40.0 | 190.0 | 7600.0 | 80.0 |
| Fertilizers and biocides | Boron | Kg/ha | 2.0 | 320.0 | 640.0 | 100.0 |
| Fertilizers and biocides | pesticides | tk/ha | 3.03 | 3000.0 | 9090.0 | 100.0 |
| Construction material | timber | |||||
| Total costs for establishment of the Technology | 47690.0 | |||||
If land user bore less than 100% of costs, indicate who covered the remaining costs:
Agricultural Extension department as government subsidy for input cost
4.6 Maintenance/ recurrent activities
| Activity | Type of measure | Timing/ frequency | |
|---|---|---|---|
| 1. | Weeding | Agronomic | During vegetative stage/3 |
| 2. | Broad casting fertiliser | Agronomic | 2 |
| 3. | watering | Agronomic | 3 |
| 4. | pesticide application | Agronomic | if necessary |
4.7 Costs and inputs needed for maintenance/ recurrent activities (per year)
| Specify input | Unit | Quantity | Costs per Unit | Total costs per input | % of costs borne by land users | |
|---|---|---|---|---|---|---|
| Labour | farmers | person -per day | 3.0 | 500.0 | 1500.0 | 100.0 |
| Fertilizers and biocides | Urea broadcasting | KG/HA | 90.0 | 16.0 | 1440.0 | 100.0 |
| Other | Watering | litre/hectare | 10000.0 | 3.0 | 30000.0 | 100.0 |
| Other | pesticide | kg/ha | 20.0 | 200.0 | 4000.0 | 100.0 |
| Total costs for maintenance of the Technology | 36940.0 | |||||
5. Natural and human environment
5.1 Climate
Annual rainfall
- < 250 mm
- 251-500 mm
- 501-750 mm
- 751-1,000 mm
- 1,001-1,500 mm
- 1,501-2,000 mm
- 2,001-3,000 mm
- 3,001-4,000 mm
- > 4,000 mm
Specify average annual rainfall (if known), in mm:
1900.00
Indicate the name of the reference meteorological station considered:
Dhaka
Agro-climatic zone
- humid
5.2 Topography
Slopes on average:
- flat (0-2%)
- gentle (3-5%)
- moderate (6-10%)
- rolling (11-15%)
- hilly (16-30%)
- steep (31-60%)
- very steep (>60%)
Landforms:
- plateau/plains
- ridges
- mountain slopes
- hill slopes
- footslopes
- valley floors
Altitudinal zone:
- 0-100 m a.s.l.
- 101-500 m a.s.l.
- 501-1,000 m a.s.l.
- 1,001-1,500 m a.s.l.
- 1,501-2,000 m a.s.l.
- 2,001-2,500 m a.s.l.
- 2,501-3,000 m a.s.l.
- 3,001-4,000 m a.s.l.
- > 4,000 m a.s.l.
Indicate if the Technology is specifically applied in:
- not relevant
5.3 Soils
Soil depth on average:
- very shallow (0-20 cm)
- shallow (21-50 cm)
- moderately deep (51-80 cm)
- deep (81-120 cm)
- very deep (> 120 cm)
Soil texture (topsoil):
- medium (loamy, silty)
Soil texture (> 20 cm below surface):
- medium (loamy, silty)
Topsoil organic matter:
- low (<1%)
If available, attach full soil description or specify the available information, e.g. soil type, soil PH/ acidity, Cation Exchange Capacity, nitrogen, salinity etc.
Medium high land, silt loam, silmondi soil series, soil ph-6.6, organic matter -0.88, CEC-0.25,Nitrogen-0.13%
5.4 Water availability and quality
Ground water table:
5-50 m
Availability of surface water:
poor/ none
Water quality (untreated):
good drinking water
Is water salinity a problem?
Nee
Is flooding of the area occurring?
Ja
Comments and further specifications on water quality and quantity:
episodically
5.5 Biodiversity
Species diversity:
- medium
Habitat diversity:
- medium
5.6 Characteristics of land users applying the Technology
Sedentary or nomadic:
- Sedentary
Market orientation of production system:
- mixed (subsistence/ commercial
Off-farm income:
- 10-50% of all income
Relative level of wealth:
- average
Individuals or groups:
- individual/ household
Level of mechanization:
- manual work
Gender:
- men
Age of land users:
- middle-aged
- elderly
5.7 Average area of land owned or leased by land users applying the Technology
- < 0.5 ha
- 0.5-1 ha
- 1-2 ha
- 2-5 ha
- 5-15 ha
- 15-50 ha
- 50-100 ha
- 100-500 ha
- 500-1,000 ha
- 1,000-10,000 ha
- > 10,000 ha
Is this considered small-, medium- or large-scale (referring to local context)?
- small-scale
5.8 Land ownership, land use rights, and water use rights
Land ownership:
- individual, not titled
- individual, titled
Land use rights:
- individual
Water use rights:
- individual
5.9 Access to services and infrastructure
health:
- poor
- moderate
- good
education:
- poor
- moderate
- good
technical assistance:
- poor
- moderate
- good
employment (e.g. off-farm):
- poor
- moderate
- good
markets:
- poor
- moderate
- good
energy:
- poor
- moderate
- good
roads and transport:
- poor
- moderate
- good
drinking water and sanitation:
- poor
- moderate
- good
financial services:
- poor
- moderate
- good
6. Impacts and concluding statements
6.1 On-site impacts the Technology has shown
Socio-economic impacts
Production
crop production
crop quality
land management
Water availability and quality
drinking water availability
drinking water quality
water availability for livestock
water quality for livestock
irrigation water availability
irrigation water quality
demand for irrigation water
Income and costs
expenses on agricultural inputs
farm income
diversity of income sources
Socio-cultural impacts
food security/ self-sufficiency
health situation
land use/ water rights
cultural opportunities
recreational opportunities
community institutions
national institutions
SLM/ land degradation knowledge
situation of socially and economically disadvantaged groups
Ecological impacts
Water cycle/ runoff
water quantity
Soil
soil moisture
soil cover
soil loss
soil accumulation
soil crusting/ sealing
soil compaction
nutrient cycling/ recharge
salinity
Quantity before SLM:
not relevant
soil organic matter/ below ground C
acidity
Biodiversity: vegetation, animals
Vegetation cover
biomass/ above ground C
plant diversity
invasive alien species
animal diversity
beneficial species
habitat diversity
pest/ disease control
Climate and disaster risk reduction
flood impacts
drought impacts
emission of carbon and greenhouse gases
micro-climate
Other ecological impacts
6.2 Off-site impacts the Technology has shown
water availability
groundwater/ river pollution
impact of greenhouse gases
6.3 Exposure and sensitivity of the Technology to gradual climate change and climate-related extremes/ disasters (as perceived by land users)
Gradual climate change
Gradual climate change
| Season | Type of climatic change/ extreme | How does the Technology cope with it? | |
|---|---|---|---|
| annual temperature | decrease | moderately |
Climate-related extremes (disasters)
Climatological disasters
| How does the Technology cope with it? | |
|---|---|
| drought | well |
Biological disasters
| How does the Technology cope with it? | |
|---|---|
| epidemic diseases | very well |
| insect/ worm infestation | very well |
6.4 Cost-benefit analysis
How do the benefits compare with the establishment costs (from land users’ perspective)?
Short-term returns:
very positive
Long-term returns:
positive
How do the benefits compare with the maintenance/ recurrent costs (from land users' perspective)?
Short-term returns:
positive
Long-term returns:
positive
6.5 Adoption of the Technology
- more than 50%
Of all those who have adopted the Technology, how many have did so spontaneously, i.e. without receiving any material incentives/ payments?
- 10-50%
6.6 Adaptation
Has the Technology been modified recently to adapt to changing conditions?
Nee
6.7 Strengths/ advantages/ opportunities of the Technology
| Strengths/ advantages/ opportunities in the land user’s view |
|---|
| It reduces soil nutrient mining |
| Production cost decreased |
| Crop production increased more than two times |
| Soil moisture holding capacity increased |
| Strengths/ advantages/ opportunities in the compiler’s or other key resource person’s view |
|---|
| Sustainable soil management technology developed |
| Soil health improved |
| judicious use of natural resources |
7. References and links
7.1 Methods/ sources of information
- field visits, field surveys
Ten local people
- interviews with land users
Twenty land users
7.2 References to available publications
Title, author, year, ISBN:
Rahman, M. R. 1990. Country report, Bangladesh. In: Problem Soils of Asia and the Pacific. Report of the Expert Consultation of the Asian Network on Problem soils. Bangkok, Thailand, 29 August-1 September 1989
Links and modules
Expand all Collapse allLinks
No links
Modules
No modules


