Small constructed wetland [Norway]
- Creation:
- Update:
- Compiler: Dominika Krzeminska
- Editor: Anne-Grete Buseth Blankenberg
- Reviewers: Rima Mekdaschi Studer, William Critchley, Tatenda Lemann
Fangdam
technologies_5940 - Norway
View sections
Expand all Collapse all1. معلومات عامة
1.2 Contact details of resource persons and institutions involved in the assessment and documentation of the Technology
SLM specialist:
Name of project which facilitated the documentation/ evaluation of the Technology (if relevant)
OPtimal strategies to retAIN and re-use water and nutrients in small agricultural catchments across different soil-climatic regions in Europe (OPTAIN)Name of the institution(s) which facilitated the documentation/ evaluation of the Technology (if relevant)
Norwegian Institute of Bioeconomy Research (NIBIO) - Norway1.3 Conditions regarding the use of data documented through WOCAT
The compiler and key resource person(s) accept the conditions regarding the use of data documented through WOCAT:
نعم
1.4 Declaration on sustainability of the described Technology
Is the Technology described here problematic with regard to land degradation, so that it cannot be declared a sustainable land management technology?
لا
1.5 Reference to Questionnaire(s) on SLM Approaches (documented using WOCAT)
Regional Environmental program [Norway]
Regulations and financial grants for reduction of pollution and promotion of the cultural landscape.
- Compiler: Kamilla Skaalsveen
2. Description of the SLM Technology
2.1 Short description of the Technology
Definition of the Technology:
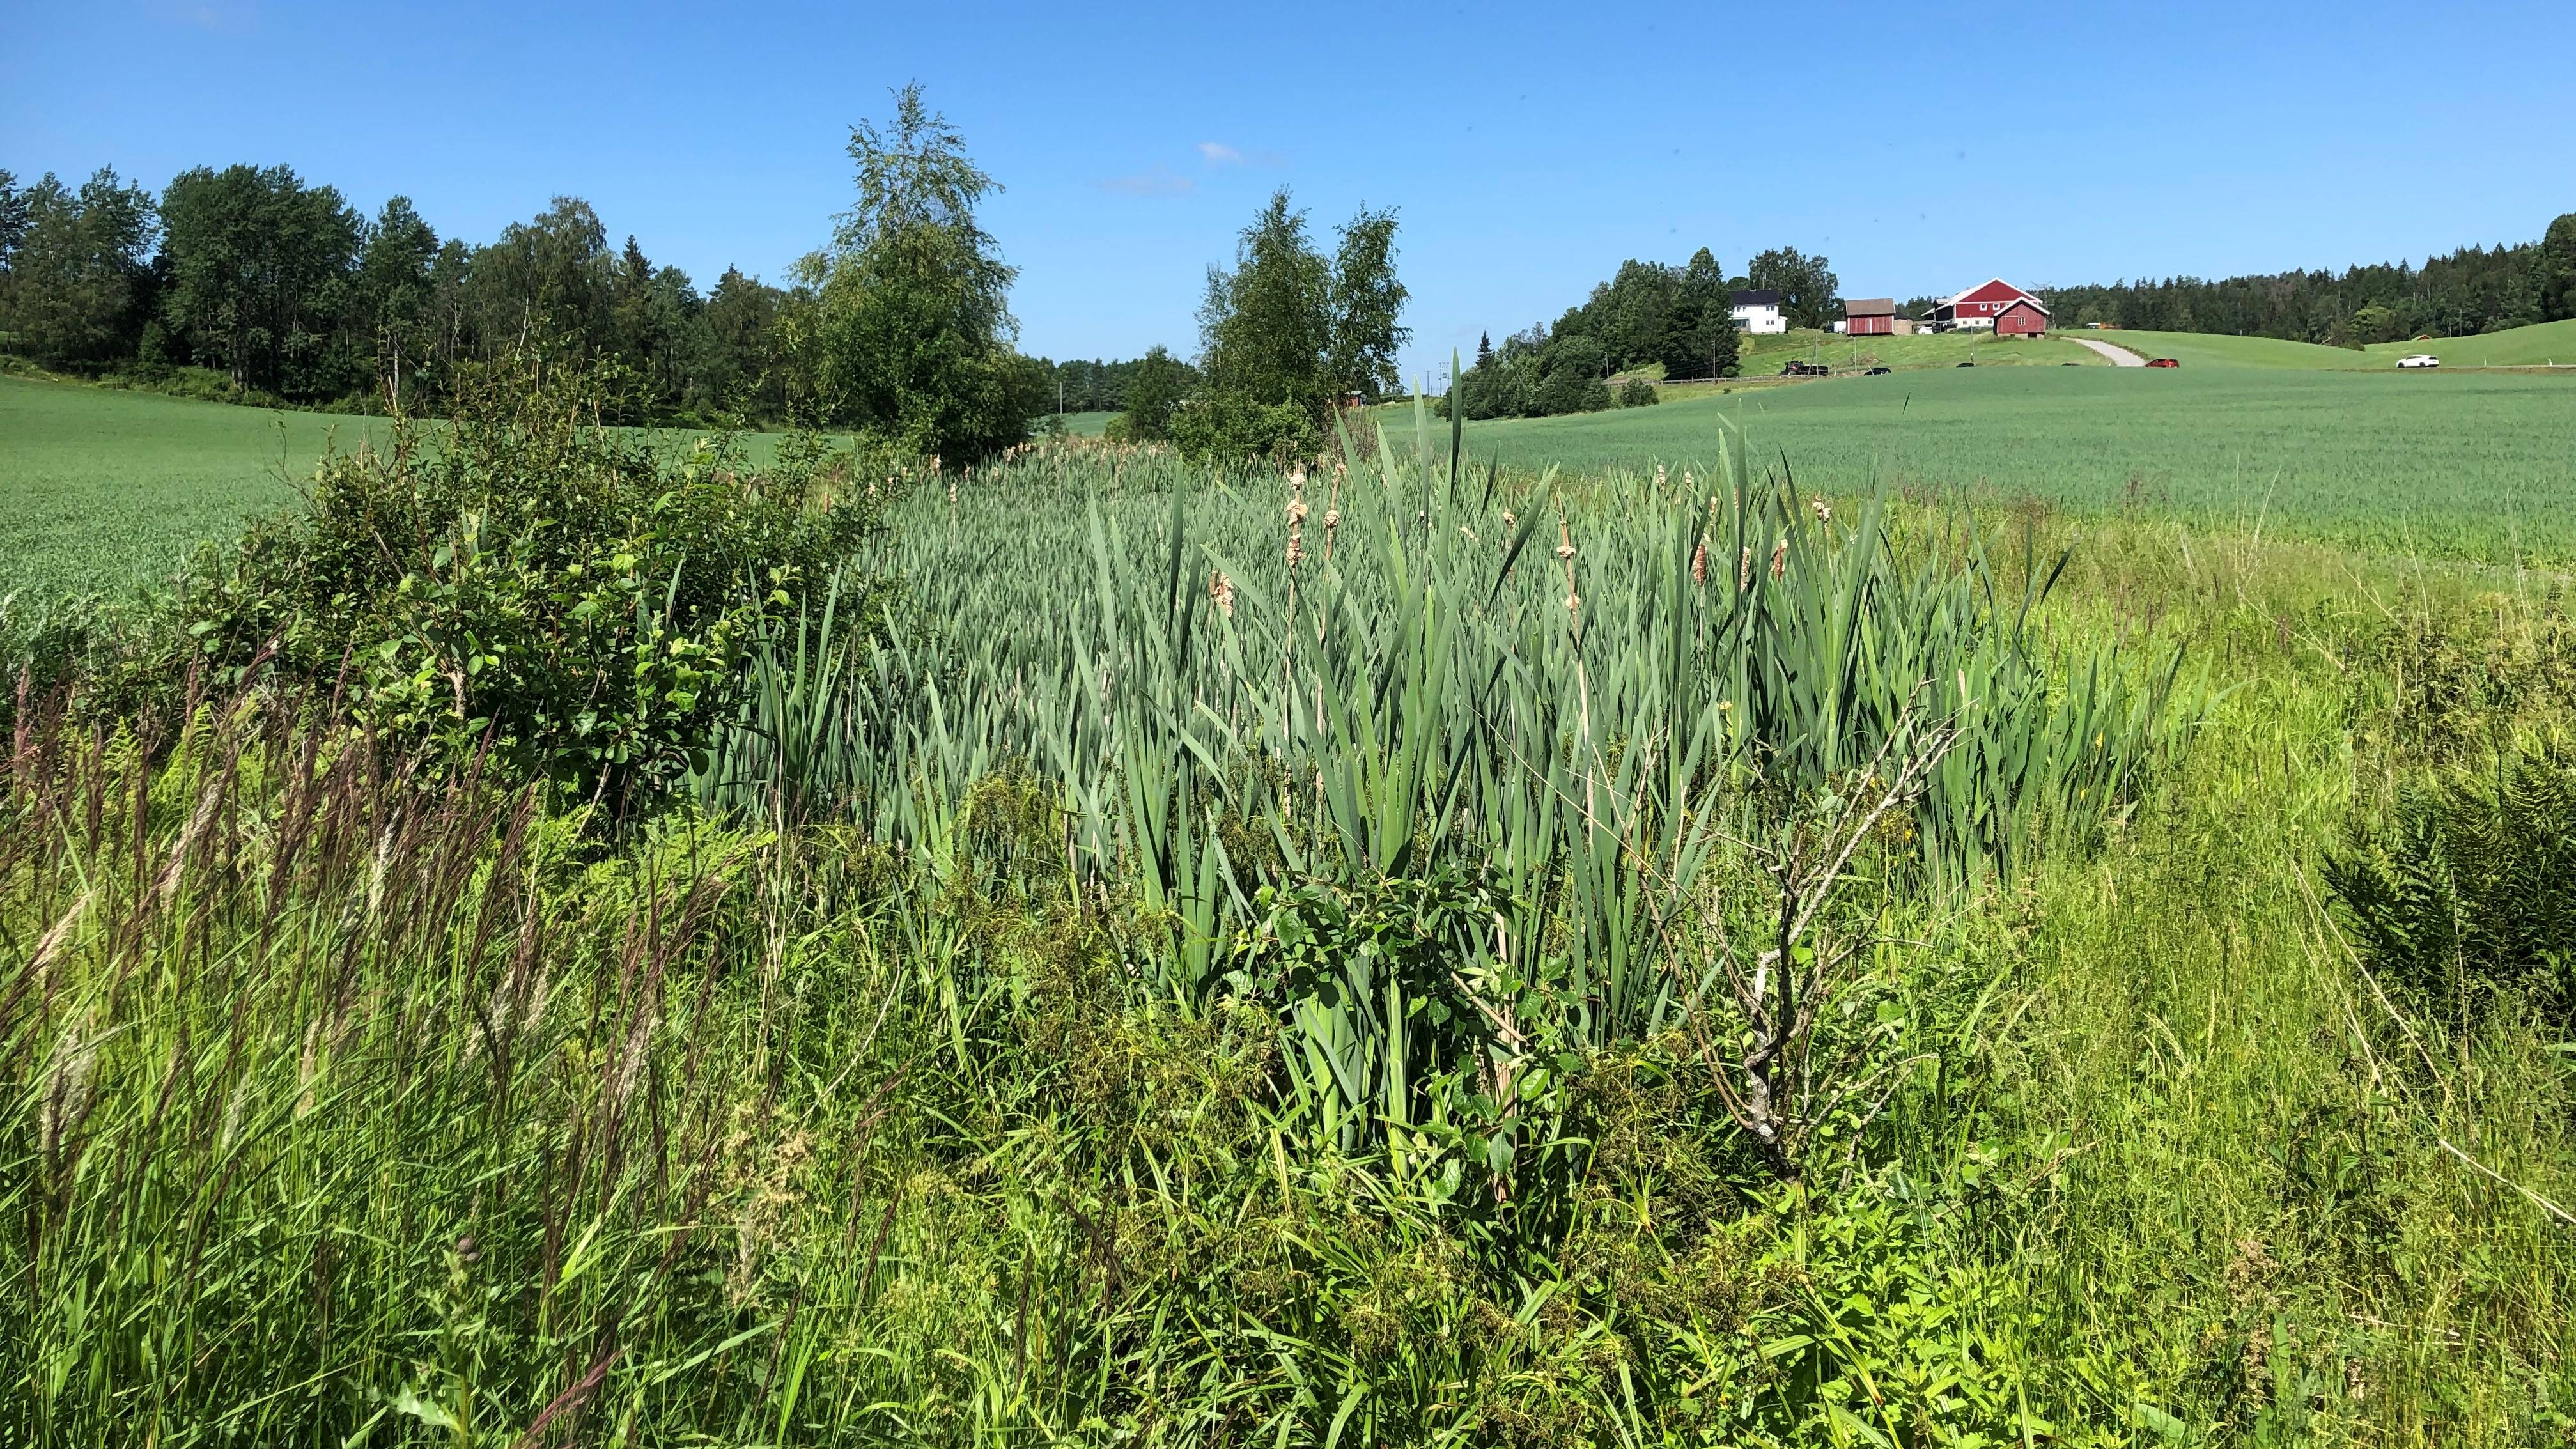
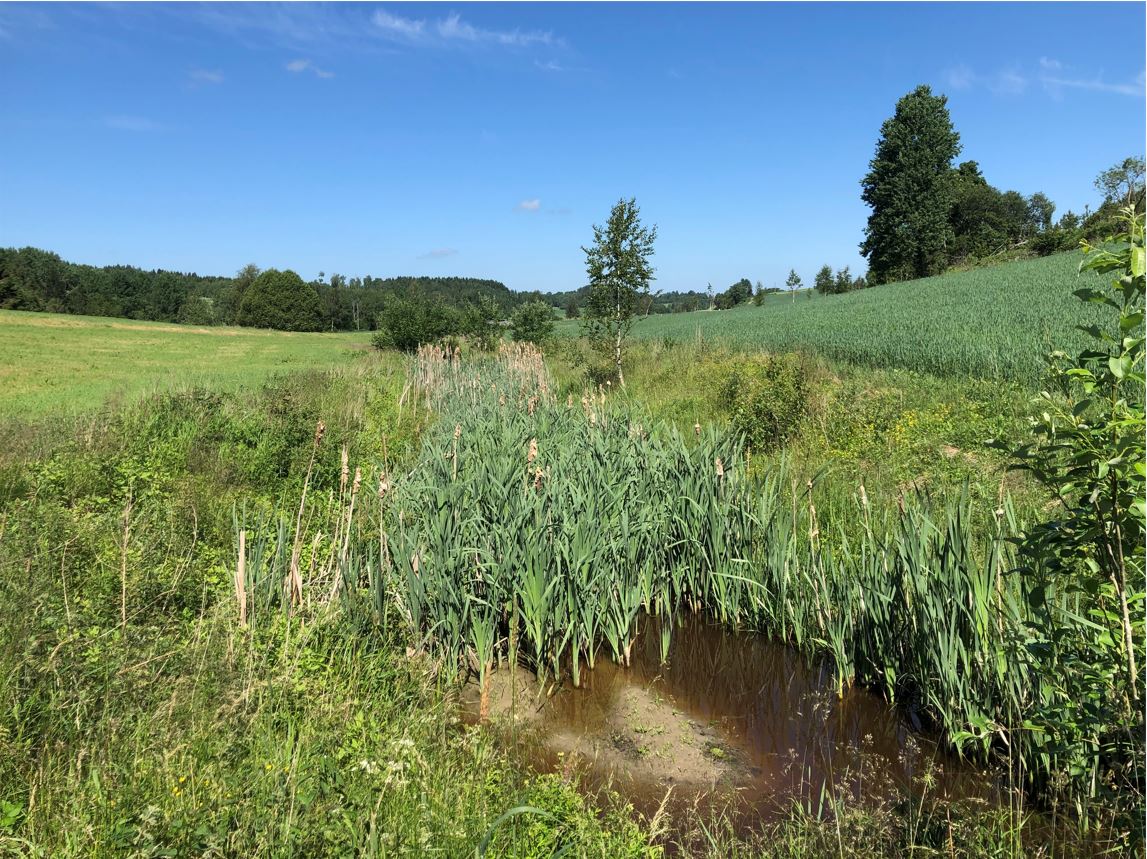
A small constructed wetland is a combination of ponds and vegetation filters, designed mainly to remove sediment and nutrients from streams. It is usually located in first and second order streams in agricultural landscapes.
2.2 Detailed description of the Technology
Description:
Purpose/aim: Small constructed wetlands (CWs) are designed to improve water quality in streams and thus downstream water quality as well. The shape of the constructed wetlands can differ and include different components. Generally, they include a deeper sedimentation pond at the inlet (depth 1.5-2 m), followed by one or more shallow vegetated zones (depth 0.5 m). The sedimentation pond decreases the water velocity to allow particles to settle, while the vegetated, shallower zones act as filters for particles passing the sedimentation pond and protect trapped sediments from re-suspension by stabilizing them with their roots.
Small constructed wetlands treating agricultural runoff have been in operation in Norway since the early 1990s. From 1994-2020, more than 1200 CWs have been established across the country, with the aim of reducing sediment, nutrients, pesticides and other pollutants in agricultural runoff.
Establishment/maintenance: Norwegian CW are designed mainly to remove phosphorus and particles (suspended sediment) with main removal mechanism being sedimentation and filtration, and (to a lesser extent) plant uptake. The CWs treating agricultural runoff are usually constructed by expanding the width of natural streams. At the inlet of the CW, the stream water flows into a sedimentation pond. From the sedimentation pond, water passes through a sprinkling zone, and then through one or more vegetated wetland filters. Due to the typical small-scale Norwegian agriculture and the landscape with rough topography, CWs are often quite small (<0.1 % of the catchment area). The size of CWs is one of the crucial factors limiting overall treatment efficiency.
Over the years, the CW will fill up with sediments, and to maintain good treatment efficiency, it is necessary to empty the CWs periodically (Blankenberg et al. 2013 ).
Benefits/impacts: Norwegian studies show that retention of total phosphorus (TP), both particulate P and dissolved P, increase with increasing area of the CW (Braskerud et al. 2005 ). The retention of sediments, nutrients and pesticides in different CWs also varies due to other factors like design principles, soil types in the catchment, hydraulic loads, and locations along the streams (Braskerud and Blankenberg 2005 ; Blankenberg et al. 2007 , 2008 ; Elsaesser et al. 2011 ). Braskerud ( 2001 ) showed that average retention in six CWs in Norway varied from 45% to 74% for soil particles and 21%–44% for TP. For CW in Skuterud catchment Krzeminska et al (2021) showed that average efficiency of removal was 36% of sediment, 19% of phosphorus and 3% of nitrogen .
Natural / human environment: The information presented here is based on the investigations and/or reports from different part of Norway. For the purpose of OPTAIN project, the technology is further presented in the natural and human environment context of the Kråkstad River catchment - a Norwegian Case Study catchment within OPTAIN project.
The Kråkstad River is mainly situated in Ski commune in South-Eastern parts of Norway. The river catchment is a western tributary of the Vannsjø-Hobøl watercourse, also known as the Morsa watercourse. The Kråkstad River catchment area is c.a 51 km², 43% of which is agricultural land, where mostly cereals are produced on heavy clays soils. The main environmental challenge in the area is water quality (incl. high phosphorus pollution) and soil erosion (incl. riverbank erosion and quick-clay landslides).
2.3 Photos of the Technology
Media Gallery
2.5 Country/ region/ locations where the Technology has been applied and which are covered by this assessment
بلد:
Norway
Region/ State/ Province:
Viken county
Further specification of location:
The Vansø - Hobøl catchment
Specify the spread of the Technology:
- applied at specific points/ concentrated on a small area
Is/are the technology site(s) located in a permanently protected area?
لا
Comments:
Here we show only some example locations within the Kråkstad catchment
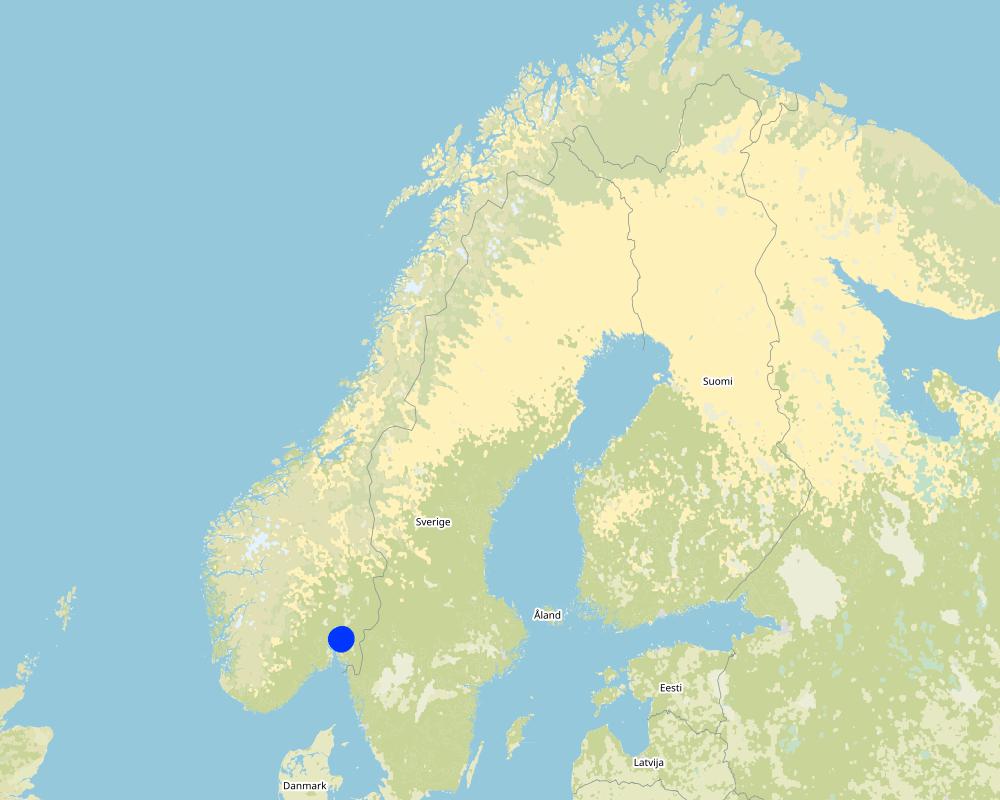
Map
×2.6 Date of implementation
If precise year is not known, indicate approximate date:
- 10-50 years ago
2.7 Introduction of the Technology
Specify how the Technology was introduced:
- during experiments/ research
- SMIL (Special Environmental measures in agriculture)
Comments (type of project, etc.):
Constructed wetlands are part of SMIL subsidy system (Special Environmental measures in Agriculture)
3. Classification of the SLM Technology
3.1 Main purpose(s) of the Technology
- protect a watershed/ downstream areas – in combination with other Technologies
- adapt to climate change/ extremes and its impacts
- mitigate climate change and its impacts
3.2 Current land use type(s) where the Technology is applied
Land use mixed within the same land unit:
لا

الأراضي الزراعية
- Annual cropping
Annual cropping - Specify crops:
- cereals - other
- small grains
Number of growing seasons per year:
- 1
حددها:
Longest growing period in days: 135. Longest growing period from month to month: May to mid September
Is intercropping practiced?
لا
Is crop rotation practiced?
لا

Forest/ woodlands
- Natrual forest

Waterways, waterbodies, wetlands
- Drainage lines, waterways
3.3 Has land use changed due to the implementation of the Technology?
Has land use changed due to the implementation of the Technology?
- No (Continue with question 3.4)
Waterways, waterbodies, wetlands
- Ponds, dams
- Swamps, wetlands
3.4 Water supply
Water supply for the land on which the Technology is applied:
- rainfed
3.5 SLM group to which the Technology belongs
- surface water management (spring, river, lakes, sea)
- wetland protection/ management
3.6 SLM measures comprising the Technology
structural measures
- S5: Dams, pans, ponds
3.7 Main types of land degradation addressed by the Technology
water degradation
- Hp: decline of surface water quality
3.8 Prevention, reduction, or restoration of land degradation
Specify the goal of the Technology with regard to land degradation:
- prevent land degradation
- reduce land degradation
4. Technical specifications, implementation activities, inputs, and costs
4.1 Technical drawing of the Technology
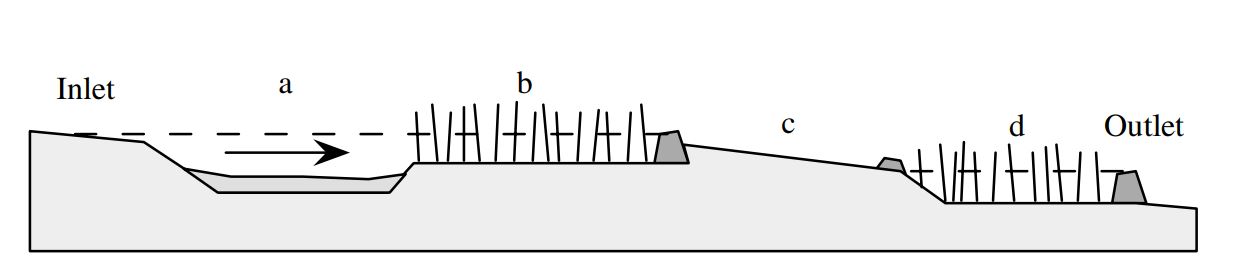
Technical specifications (related to technical drawing):
Components of typical constructed wetland in Norway: (a) sedimentation pond, (b) wetland filter, (c) overflow zone covered with vegetation or stones and (d) outlet basin.
Author:
B.C. Braskerud (2002)
Date:
26/01/2022
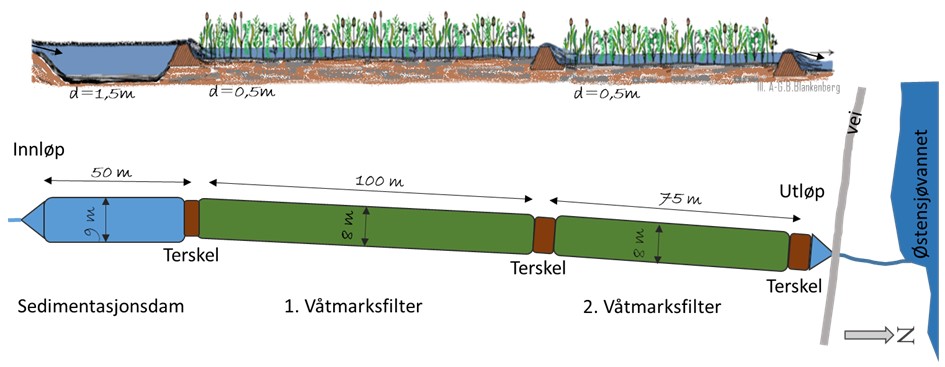
Technical specifications (related to technical drawing):
Schematic representation of constructed wetland in Skuterud catchment.
Author:
Anne-Grete Buseth Blankenberg (e.g. in the report from 2021)
Date:
26/01/2022
4.2 General information regarding the calculation of inputs and costs
Specify how costs and inputs were calculated:
- per Technology unit
Specify unit:
constructed wetland - area of water surface
Specify dimensions of unit (if relevant):
<0.1 % of the catchment area. For Skuterud wetland it is 2300 m2
other/ national currency (specify):
NOK
If relevant, indicate exchange rate from USD to local currency (e.g. 1 USD = 79.9 Brazilian Real): 1 USD =:
8,89
Indicate average wage cost of hired labour per day:
1440
4.3 Establishment activities
| Activity | Timing (season) | |
|---|---|---|
| 1. | Construction of the wetland |
4.4 Costs and inputs needed for establishment
If you are unable to break down the costs in the table above, give an estimation of the total costs of establishing the Technology:
87500,0
If land user bore less than 100% of costs, indicate who covered the remaining costs:
The landowners can apply for subsidies to establish and maintenance constructed wetland (70% support of the cost), within SMIL system (Special Environmental measures in Agriculture). Local county authorities are responsible for the administration of these schemes.
Comments:
The information about cost are coming from Blankenber et al (2016):
During a period of 20 years (1994 - 2014) the government has spent in total about 88 million Norwegian crowns (NOK) to subsidize the CWs for agricultural runoff, and total
costs are assumed to be about 150 mill NOK. Costs per CW varies from about 26.000 NOK to 124.000 NOK, and average cost per CW is approximately 87.500 NOK.
4.5 Maintenance/ recurrent activities
| Activity | Timing/ frequency | |
|---|---|---|
| 1. | Maintenance - emptying the ponds | every 5-20 years depending on dimensions of the ponds. |
| 2. | Maintenance of the damming/barriers | when needed |
| 3. | Maintenance of stream banks | when needed |
4.6 Costs and inputs needed for maintenance/ recurrent activities (per year)
If you are unable to break down the costs in the table above, give an estimation of the total costs of maintaining the Technology:
41000,0
If land user bore less than 100% of costs, indicate who covered the remaining costs:
The landowners can apply for subsidies to establish and maintenance constructed wetland (70 % support of the cost), within SMIL system (Special Environmental measures in Agriculture). Local county authorities are responsible for the administration of these schemes.
Comments:
The information is coming from (Hauge et al 2008):
The cost of maintenance of CWs estimated based n data from 2008 from 16 ponds established or planned in Morsa water region (that includes Kråkstad catchment). The (estimated) costs varied from 5,67 NOK/m2 of water surface area up to 49 NOK/m2 of water surface area
Given number of 41000 NOK is calculated for SKuterud CW (2300 m2 of water surface area).
4.7 Most important factors affecting the costs
Describe the most determinate factors affecting the costs:
The most important factor affecting the costs of constructed wetland is the size. Larger constructed wetlands have lower establishment costs per m2 of water surface area. In terms of operating costs for capture ponds - mainly emptying the sedimentation pond - it is assumed that the cost per emptying is more or less independent of the size of the sedimentation pond. This is because a large component in the emptying cost is assumed to be the transport of the machinery and the removal of the excavated mass.
The landowners can apply for subsidies to establish and maintenance constructed wetland (70% support of the cost), within SMIL system (Special Environmental measures in Agriculture). Local county authorities are responsible for the administration of these schemes.
5. Natural and human environment
5.1 Climate
Annual rainfall
- < 250 mm
- 251-500 mm
- 501-750 mm
- 751-1,000 mm
- 1,001-1,500 mm
- 1,501-2,000 mm
- 2,001-3,000 mm
- 3,001-4,000 mm
- > 4,000 mm
Agro-climatic zone
- sub-humid
- semi-arid
5.2 Topography
Slopes on average:
- flat (0-2%)
- gentle (3-5%)
- moderate (6-10%)
- rolling (11-15%)
- hilly (16-30%)
- steep (31-60%)
- very steep (>60%)
Landforms:
- plateau/plains
- ridges
- mountain slopes
- hill slopes
- footslopes
- valley floors
Altitudinal zone:
- 0-100 m a.s.l.
- 101-500 m a.s.l.
- 501-1,000 m a.s.l.
- 1,001-1,500 m a.s.l.
- 1,501-2,000 m a.s.l.
- 2,001-2,500 m a.s.l.
- 2,501-3,000 m a.s.l.
- 3,001-4,000 m a.s.l.
- > 4,000 m a.s.l.
Indicate if the Technology is specifically applied in:
- not relevant
5.3 Soils
Soil depth on average:
- very shallow (0-20 cm)
- shallow (21-50 cm)
- moderately deep (51-80 cm)
- deep (81-120 cm)
- very deep (> 120 cm)
Soil texture (topsoil):
- medium (loamy, silty)
- fine/ heavy (clay)
Soil texture (> 20 cm below surface):
- medium (loamy, silty)
- fine/ heavy (clay)
Topsoil organic matter:
- medium (1-3%)
5.4 Water availability and quality
Ground water table:
< 5 m
Availability of surface water:
good
Water quality (untreated):
for agricultural use only (irrigation)
Water quality refers to:
both ground and surface water
Is water salinity a problem?
لا
Is flooding of the area occurring?
نعم
Regularity:
frequently
5.5 Biodiversity
Species diversity:
- low
Habitat diversity:
- low
5.6 Characteristics of land users applying the Technology
Sedentary or nomadic:
- Sedentary
Market orientation of production system:
- mixed (subsistence/ commercial)
- commercial/ market
Off-farm income:
- 10-50% of all income
- > 50% of all income
Relative level of wealth:
- average
- rich
Individuals or groups:
- individual/ household
Level of mechanization:
- mechanized/ motorized
Gender:
- women
- men
Age of land users:
- youth
- middle-aged
Indicate other relevant characteristics of the land users:
Population density: < 10 persons/km2
Annual population growth: < 0.5%
10% of the land users are rich and own 10% of the land.
90% of the land users are average wealthy and own 90% of the land.
5.7 Average area of land used by land users applying the Technology
- < 0.5 ha
- 0.5-1 ha
- 1-2 ha
- 2-5 ha
- 5-15 ha
- 15-50 ha
- 50-100 ha
- 100-500 ha
- 500-1,000 ha
- 1,000-10,000 ha
- > 10,000 ha
Is this considered small-, medium- or large-scale (referring to local context)?
- medium-scale
5.8 Land ownership, land use rights, and water use rights
Land ownership:
- individual, titled
Land use rights:
- communal (organized)
- individual
Water use rights:
- open access (unorganized)
5.9 Access to services and infrastructure
health:
- poor
- moderate
- good
education:
- poor
- moderate
- good
technical assistance:
- poor
- moderate
- good
employment (e.g. off-farm):
- poor
- moderate
- good
markets:
- poor
- moderate
- good
energy:
- poor
- moderate
- good
roads and transport:
- poor
- moderate
- good
drinking water and sanitation:
- poor
- moderate
- good
financial services:
- poor
- moderate
- good
6. Impacts and concluding statements
6.1 On-site impacts the Technology has shown
Socio-economic impacts
Production
production area
Ecological impacts
Water cycle/ runoff
water quality
Soil
soil loss
Comments/ specify:
The sediment taken out from the sedimentation pond can be distributed on the agricultural field - soil recovery.
nutrient cycling/ recharge
Comments/ specify:
The sediment taken out from the sedimentation pond can be distributed on the agricultural field - nutrient recovery.
Biodiversity: vegetation, animals
plant diversity
animal diversity
habitat diversity
6.2 Off-site impacts the Technology has shown
downstream siltation
Comments/ specify:
Better water quality downstream
buffering/ filtering capacity
6.3 Exposure and sensitivity of the Technology to gradual climate change and climate-related extremes/ disasters (as perceived by land users)
Gradual climate change
Gradual climate change
| Season | increase or decrease | How does the Technology cope with it? | |
|---|---|---|---|
| annual temperature | increase | well | |
| annual rainfall | increase | well |
Climate-related extremes (disasters)
Hydrological disasters
| How does the Technology cope with it? | |
|---|---|
| general (river) flood | well |
6.4 Cost-benefit analysis
How do the benefits compare with the establishment costs (from land users’ perspective)?
Short-term returns:
slightly positive
Long-term returns:
slightly positive
How do the benefits compare with the maintenance/ recurrent costs (from land users' perspective)?
Short-term returns:
slightly positive
Long-term returns:
slightly positive
6.5 Adoption of the Technology
- 1-10%
Of all those who have adopted the Technology, how many did so spontaneously, i.e. without receiving any material incentives/ payments?
- 0-10%
Comments:
Adaptation of technology is stimulated by subsidies scheme.
Subsidies for the establishment of constructed wetlands are part of the SMIL system (Special Environmental Measures in Agriculture). Both the initial investment for construction and
subsequent maintenance may be paid by subsidies (70% support of the cost). During the period from 1994 to 2012 subsidies for in total 941 sedimentation ponds and constructed wetlands were given in Norway (Greipsland, 2016)
6.6 التكيف
Has the Technology been modified recently to adapt to changing conditions?
لا
6.7 Strengths/ advantages/ opportunities of the Technology
| Strengths/ advantages/ opportunities in the land user’s view |
|---|
| Improvement of water quality downstream |
| Strengths/ advantages/ opportunities in the compiler’s or other key resource person’s view |
|---|
| Improve of water quality downstream |
| Resource recovery |
6.8 Weaknesses/ disadvantages/ risks of the Technology and ways of overcoming them
| Weaknesses/ disadvantages/ risks in the land user’s view | How can they be overcome? |
|---|---|
| Loss of productive cropland | |
| Need for maintenance |
7. References and links
7.1 Methods/ sources of information
- field visits, field surveys
Several in different areas in Norway. See for example:
- Hauge et al (2008) Bioforsk Report vol 3 Nr 140 (in Norwegian)
- Krzeminska et al (2021) Nibio Report 7(101) (in Norwegian)
- interviews with SLM specialists/ experts
NIBIO, and its SLM specialists, has been conducting many national projects related to monitoring constructed wetlands in agricultural catchments.
- compilation from reports and other existing documentation
There are several reports and research publication available. Some examples below:
- Braskerud, B.C et al (2001) Dr. Scient. Theses 2001:10,
Agriculture University of Norway, Ås, Norway.
- Braskerud, B. C. (2002). Water Science and Technology Vol 45 No 9 pp 77–85.
- Braskerud, B.C et al (2005).Journal of Environmental Quality , 34(6), 2145–2155.
- Braskerud B.C. and Blankenberg A-G. B (2005) Jordforsk book nr. 48/05. 145: 126–128.
- Blankenberg, A.-G. B et al. (2007) Water Science and Technology, 55(3), 37–44.
- Blankenberg, A.-G. B et al. (2008) Desalination, 226, 114–120.
- Hauge et al (2008) Bioforsk Report vol 3 Nr 140 (in Norwegian)
- Blankenberg et al (2016) in Natural and Constructed Wetlands. DOI 10.1007/978-3-319-38927-1_2
- Krzeminska et al (2021) Nibio Report 7(101) (in Norwegian)
When were the data compiled (in the field)?
26/01/2022
7.2 References to available publications
Title, author, year, ISBN:
Hauge A., Blankenberg A-G. B., Hanserud O.H. 2008. Evaluering av fangdammer som miljøtiltak i SMIL. Bioforsk Rapport Vol. 3 Nr. 140 2008.
Available from where? Costs?
https://evalueringsportalen.no/
Title, author, year, ISBN:
Blankenberg A-G.B., Paruch A.M., Paruch L., Deelstra J., Haarstad K. 2016. Nutrients tracking and removal in constructed wetlands treating catchment runoff in Norway. In: Vymazal J. (ed) Natural and Constructed Wetlands. Springer International Publishing Switzerland, pp. 23-40. DOI 10.1007/978-3-319-38927-1_2
Available from where? Costs?
Springer Book
Title, author, year, ISBN:
Krzeminska D., Blankenberg A-G., Bechmann M. Deelstra J. 2021. Effekt av fangdam i et endret klima. NIBIO-rapport;7(101)2021
Available from where? Costs?
NIBIO website
Title, author, year, ISBN:
Greipsland I.2016. Norwegian policy and practices regarding mitigation measures in agriculture.
Available from where? Costs?
NIBIO website
7.3 Links to relevant online information
Title/ description:
Hauge A., Blankenberg A-G. B., Hanserud O.H. 2008. Evaluering av fangdammer som miljøtiltak i SMIL. Bioforsk Rapport Vol. 3 Nr. 140 2008.
URL:
https://evalueringsportalen.no/evaluering/evalueringen-av-fangdammer-som-miljotiltak-i-smil/Rapport%20Evaluering%20av%20fangdammer%20-%20Bioforsk%20Jord%20og%20Milj%C3%B8.pdf/@@inline
Title/ description:
Krzeminska D., Blankenberg A-G., Bechmann M. Deelstra J. 2021. Effekt av fangdam i et endret klima. NIBIO-rapport;7(101)2021
URL:
https://nibio.brage.unit.no/nibio-xmlui/bitstream/handle/11250/2757116/NIBIO_RAPPORT_2021_7_101.pdf?sequence=4&isAllowed=y
Title/ description:
Greipsland I.2016. Norwegian policy and practices regarding mitigation measures in agriculture.
URL:
https://nibio.brage.unit.no/nibio-xmlui/bitstream/handle/11250/2387569/NIBIO_POP_2016_2_21.pdf?sequence=3&isAllowed=y
Links and modules
Expand all Collapse allLinks
Regional Environmental program [Norway]
Regulations and financial grants for reduction of pollution and promotion of the cultural landscape.
- Compiler: Kamilla Skaalsveen
Modules
No modules