Vegetated buffer strips [Italy]
- Creation:
- Update:
- Compiler: Nicola Dal Ferro
- Editor: –
- Reviewers: Fabian Ottiger, Alexandra Gavilano
Fasce tampone boscate
technologies_1646 - Italy
View sections
Expand all Collapse all1. General information
1.2 Contact details of resource persons and institutions involved in the assessment and documentation of the Technology
SLM specialist:
Morari Francesco
University of Padova
Italy
Name of project which facilitated the documentation/ evaluation of the Technology (if relevant)
Preventing and Remediating degradation of soils in Europe through Land Care (EU-RECARE )Name of the institution(s) which facilitated the documentation/ evaluation of the Technology (if relevant)
University of Padova (UNIPD) - Italy1.3 Conditions regarding the use of data documented through WOCAT
The compiler and key resource person(s) accept the conditions regarding the use of data documented through WOCAT:
Yes
1.5 Reference to Questionnaire(s) on SLM Approaches (documented using WOCAT)
Rural development programme in the Veneto region [Italy]
Developing rural areas in the Veneto region through sustainable land management policies
- Compiler: Nicola Dal Ferro
2. Description of the SLM Technology
2.1 Short description of the Technology
Definition of the Technology:
Buffer vegetation of agricultural land bordering to prevent nonpoint surface water pollution and soil erosion
2.2 Detailed description of the Technology
Description:
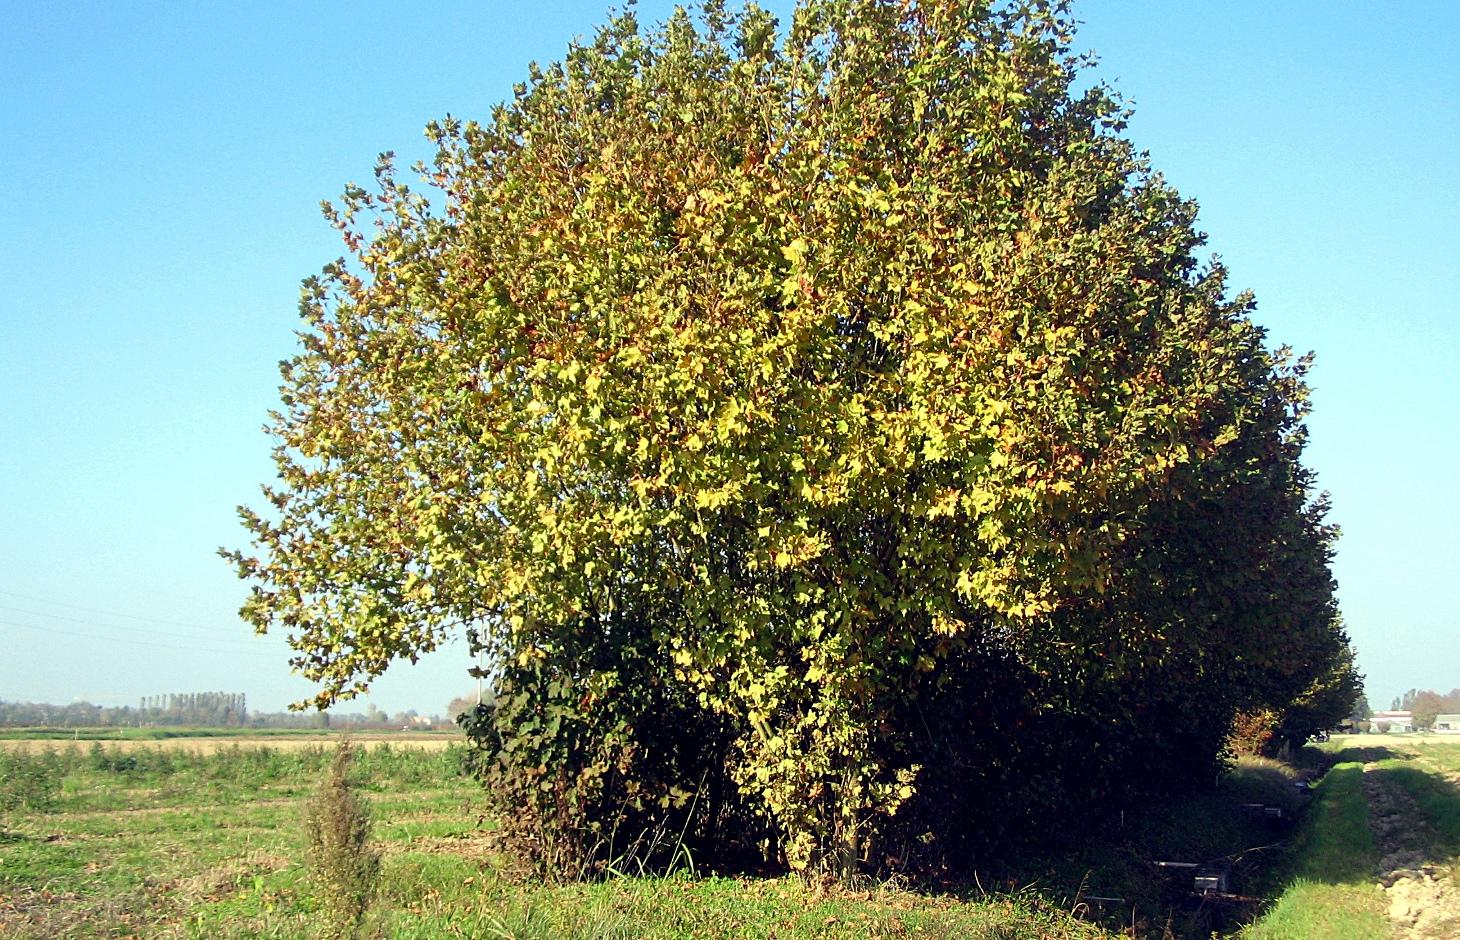
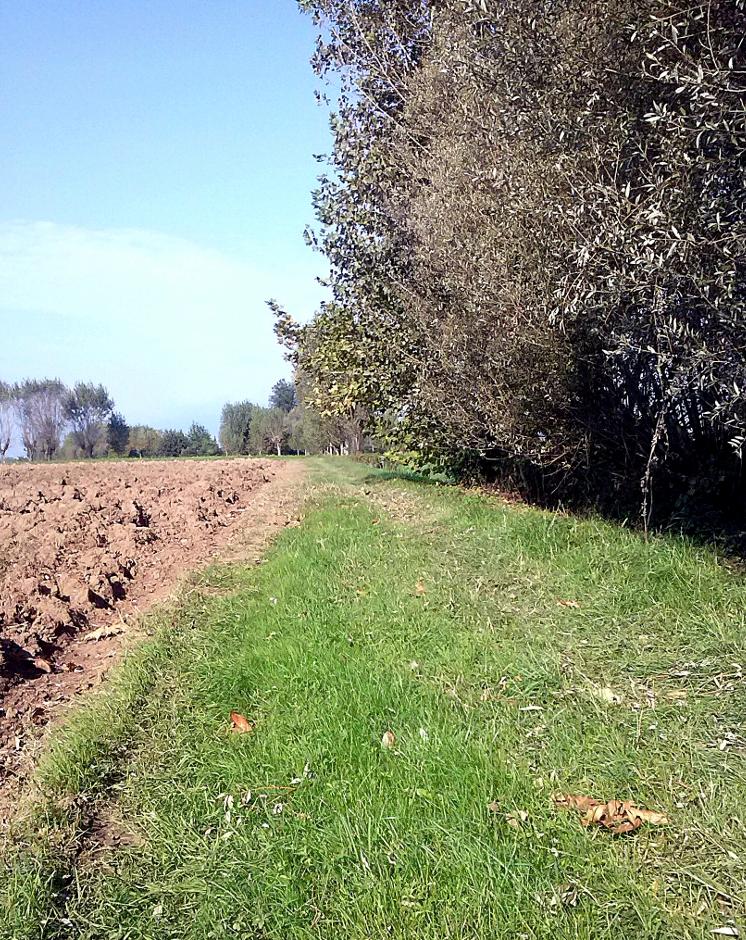
Vegetated buffer strips are agricultural areas with permanent vegetation designed to prevent surface water pollution and minimize soil erosion. In the Veneto region they are generally used along streams, canals and roads and can be composed of grass, hedges, trees or their combination. Buffer strips were a major component of agricultural landscape that has been replaced by intensive monoculture practices by increasing tillable areas. In recent years, the re-introduction of buffer zones in the Venetian plain (and generally in the whole territory of the region) has been supported as an agri-environmental measure for a sustainable land management.
Purpose of the Technology: Vegetated buffer strips, recently promoted by the regional government, are an efficient and economical way to improve surface water quality by agricultural nonpoint source pollution. Farmers take advantage of using buffer strips to help control soil erosion and sediment loss, stabilize riverbanks and reduce flood damage to crops. The continuous soil cover and diversification of habitats improve agroecosystem biodiversity and diversification of farmers income.
Establishment / maintenance activities and inputs: Vegetated buffer strips are generally composed of a shrub or tree belt of 1 m combined with an herbaceous band of 5 m, usually placed on the sides of cultivated fields in order to maximise their depuration efficacy as well as ensure crop production. Their function to reduce water pollution is optimal if arranged along a water course in order to intercept suspended solids and sediment-bound nutrients.
Natural / human environment: Adopting vegetated buffer strips achieves several environmental benefits with a low initial economic investment. The agroecosystem biodiversity is improved by the creation of continuous buffers that provide food, nesting cover, shaded environment and connecting corridors from one habitat to another to wildlife species, while the continuous soil cover with herbaceous and woody plants enhances soil protection and below-ground biodiversity. Water resources benefit from reduced nutrient supply and sediments that cause excessive growth of algae and diminish oxygen level of the water. Vegetated buffer strips, thanks to the maintenance and differentiation of species in the territory, enhance the quality of life through the improvement of agricultural landscape.
2.3 Photos of the Technology
Media Gallery
2.5 Country/ region/ locations where the Technology has been applied and which are covered by this assessment
Country:
Italy
Region/ State/ Province:
Italy
Further specification of location:
Veneto region
Specify the spread of the Technology:
- evenly spread over an area
If precise area is not known, indicate approximate area covered:
- 100-1,000 km2
2.6 Date of implementation
If precise year is not known, indicate approximate date:
- 10-50 years ago
2.7 Introduction of the Technology
Specify how the Technology was introduced:
- during experiments/ research
3. Classification of the SLM Technology
3.1 Main purpose(s) of the Technology
- reduce, prevent, restore land degradation
3.2 Current land use type(s) where the Technology is applied
Land use mixed within the same land unit:
No

Cropland
- Annual cropping
- Tree and shrub cropping
Annual cropping - Specify crops:
- cereals - maize
- legumes and pulses - soya
- wheat, oak, maple, hornbeam, willow
- oak , maple, hornbeam, willow
Number of growing seasons per year:
- 1
Specify:
Longest growing period in days: 210 Longest growing period from month to month: March to OctoberSecond longest growing period in days: 180
Comments:
Major land use problems (compiler’s opinion): Soils in the low Venetian plain of the Veneto region generally suffer from a loss of soil organic matter (SOM) that is strongly affected by their natural texture and climatic conditions. Moreover, in the last 50 years intensive tillage practices contributed to a further SOM decrease, estimated at 0.02-0.58 t/ha/y of carbon. The introduction of monoculture worsened the agro-ecosystem habitats and reduced soil biodiversity.
Major land use problems (land users’ perception): Decrease of productivity and the need of higher inputs of fertiliser.
3.4 Water supply
Water supply for the land on which the Technology is applied:
- mixed rainfed-irrigated
Comments:
Water supply: rainfed, full irrigation
3.5 SLM group to which the Technology belongs
- cross-slope measure
3.6 SLM measures comprising the Technology

vegetative measures
- V1: Tree and shrub cover
Comments:
Main measures: vegetative measures
Type of vegetative measures: aligned: -linear
3.7 Main types of land degradation addressed by the Technology

soil erosion by water
- Wt: loss of topsoil/ surface erosion
- Wr: riverbank erosion

biological degradation
- Bh: loss of habitats
water degradation
- Hp: decline of surface water quality
Comments:
Main type of degradation addressed: Wr: riverbank erosion, Bh: loss of habitats, Hp: decline of surface water quality
Secondary types of degradation addressed: Wt: loss of topsoil / surface erosion
Main causes of degradation: soil management (lack of organic input with fertilizations), population pressure (High demand for agricultural products and competition for land in densely populated area)
Secondary causes of degradation: crop management (annual, perennial, tree/shrub) (crop monoculture instead of crop rotation), deforestation / removal of natural vegetation (incl. forest fires) (mechanisation)
3.8 Prevention, reduction, or restoration of land degradation
Specify the goal of the Technology with regard to land degradation:
- prevent land degradation
- reduce land degradation
Comments:
Main goals: prevention of land degradation
Secondary goals: mitigation / reduction of land degradation
4. Technical specifications, implementation activities, inputs, and costs
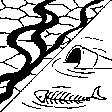
4.1 Technical drawing of the Technology
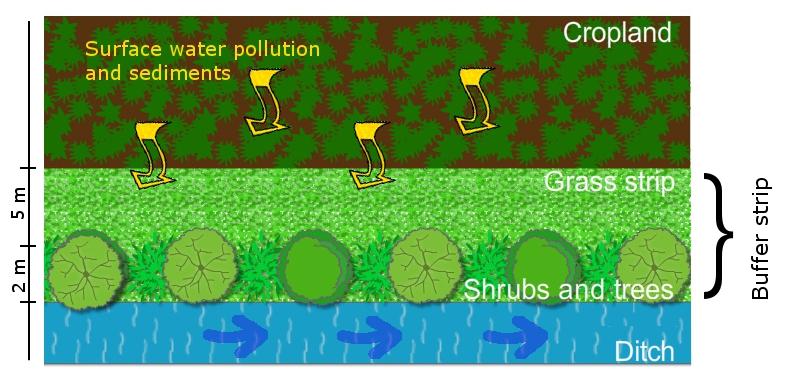
Technical specifications (related to technical drawing):
An interposed area between the cropland and a water course is designed to intercept runoff and reduce surface water pollution (suspended solids, nutrients etc.).
Location: Veneto region
Technical knowledge required for field staff / advisors: moderate
Technical knowledge required for land users: moderate
Main technical functions: control of dispersed runoff: retain / trap, control of dispersed runoff: impede / retard, stabilisation of soil (eg by tree roots against land slides), improvement of water quality, buffering / filtering water, sediment retention / trapping, sediment harvesting, spatial arrangement and diversification of land use
Secondary technical functions: control of concentrated runoff: retain / trap, control of concentrated runoff: impede / retard, improvement of ground cover, increase of surface roughness, increase in organic matter, increase in nutrient availability (supply, recycling,…)
Aligned: -linear
Vegetative material: T : trees / shrubs
Spacing between rows / strips / blocks (m): 3-5
Vertical interval within rows / strips / blocks (m): 1-3
Trees/ shrubs species: oak, maple, hornbeam, willow, etc.
Grass species: mixed species
Author:
Nicola Dal Ferro
4.2 General information regarding the calculation of inputs and costs
other/ national currency (specify):
Euro €
If relevant, indicate exchange rate from USD to local currency (e.g. 1 USD = 79.9 Brazilian Real): 1 USD =:
0.8
Indicate average wage cost of hired labour per day:
21.00
4.3 Establishment activities
| Activity | Timing (season) | |
|---|---|---|
| 1. | Planning, mulching, soli preparation, fertilisation | |
| 2. | Purchase of seedlings and planting | |
| 3. | Grass strip establishment | |
| 4. | Machinery for mowing, pruning |
4.4 Costs and inputs needed for establishment
| Specify input | Unit | Quantity | Costs per Unit | Total costs per input | % of costs borne by land users | |
|---|---|---|---|---|---|---|
| Labour | Planning, mulching, soli preparation, fertilisation | ha | 1.0 | 306.0 | 306.0 | |
| Labour | Planting | ha | 1.0 | 2.5 | 2.5 | |
| Labour | Grass strip establishment | ha | 1.0 | 152.0 | 152.0 | |
| Equipment | Machinery for mowing, pruning | ha | 1.0 | 4000.0 | 4000.0 | |
| Plant material | Seedlings | ha | 1.0 | 119.0 | 119.0 | |
| Fertilizers and biocides | Fertilizer | ha | 1.0 | 14.0 | 14.0 | |
| Total costs for establishment of the Technology | 4593.5 | |||||
| Total costs for establishment of the Technology in USD | 5741.88 | |||||
4.5 Maintenance/ recurrent activities
| Activity | Timing/ frequency | |
|---|---|---|
| 1. | Pruning, replanting, additional irrigation | |
| 2. | Grass strip maintenance |
4.6 Costs and inputs needed for maintenance/ recurrent activities (per year)
| Specify input | Unit | Quantity | Costs per Unit | Total costs per input | % of costs borne by land users | |
|---|---|---|---|---|---|---|
| Labour | Pruning, replanting, additional irrigation | ha | 1.0 | 127.0 | 127.0 | |
| Labour | Grass strip maintenance | ha | 1.0 | 127.0 | 127.0 | |
| Total costs for maintenance of the Technology | 254.0 | |||||
| Total costs for maintenance of the Technology in USD | 317.5 | |||||
4.7 Most important factors affecting the costs
Describe the most determinate factors affecting the costs:
Establishment costs (purchase of seedlings and planting) are the most important. After the establishment of buffer strip, costs are less relevant due to little work required for maintenance.
5. Natural and human environment
5.1 Climate
Annual rainfall
- < 250 mm
- 251-500 mm
- 501-750 mm
- 751-1,000 mm
- 1,001-1,500 mm
- 1,501-2,000 mm
- 2,001-3,000 mm
- 3,001-4,000 mm
- > 4,000 mm
Agro-climatic zone
- sub-humid
Thermal climate class: temperate
5.2 Topography
Slopes on average:
- flat (0-2%)
- gentle (3-5%)
- moderate (6-10%)
- rolling (11-15%)
- hilly (16-30%)
- steep (31-60%)
- very steep (>60%)
Landforms:
- plateau/plains
- ridges
- mountain slopes
- hill slopes
- footslopes
- valley floors
Altitudinal zone:
- 0-100 m a.s.l.
- 101-500 m a.s.l.
- 501-1,000 m a.s.l.
- 1,001-1,500 m a.s.l.
- 1,501-2,000 m a.s.l.
- 2,001-2,500 m a.s.l.
- 2,501-3,000 m a.s.l.
- 3,001-4,000 m a.s.l.
- > 4,000 m a.s.l.
5.3 Soils
Soil depth on average:
- very shallow (0-20 cm)
- shallow (21-50 cm)
- moderately deep (51-80 cm)
- deep (81-120 cm)
- very deep (> 120 cm)
Soil texture (topsoil):
- coarse/ light (sandy)
- medium (loamy, silty)
Topsoil organic matter:
- medium (1-3%)
- low (<1%)
If available, attach full soil description or specify the available information, e.g. soil type, soil PH/ acidity, Cation Exchange Capacity, nitrogen, salinity etc.
Soil fertility is low-medium
Soil drainage/infiltration is medium
Soil water storage capacity is medium
5.4 Water availability and quality
Ground water table:
< 5 m
Availability of surface water:
good
Water quality (untreated):
good drinking water
Comments and further specifications on water quality and quantity:
Ground water table: <5m a.s.l. (The area surrounding the Venice lagoon (1240 km2) is even below the sea level (down to -2 m) and currently cultivated due to land reclamation. As a result water table is kept artificially low)
Water quality (untreted): Good drinking water (groundwater) and for agricultural use only (surface water can be used for agricultural purposes but not as drinking water)
5.5 Biodiversity
Species diversity:
- medium
Comments and further specifications on biodiversity:
High population density, infrastructures and intensive agriculture practices affect the state of biodiversity.
5.6 Characteristics of land users applying the Technology
Market orientation of production system:
- commercial/ market
Off-farm income:
- 10-50% of all income
Relative level of wealth:
- average
Individuals or groups:
- individual/ household
Level of mechanization:
- mechanized/ motorized
Gender:
- men
Indicate other relevant characteristics of the land users:
Land users applying the Technology are mainly common / average land users
Difference in the involvement of women and men: Farmers in the Veneto region are traditionally males due to historical and cultural reasons.
Population density: 200-500 persons/km2
Annual population growth: 0.5% - 1%
5.7 Average area of land used by land users applying the Technology
- < 0.5 ha
- 0.5-1 ha
- 1-2 ha
- 2-5 ha
- 5-15 ha
- 15-50 ha
- 50-100 ha
- 100-500 ha
- 500-1,000 ha
- 1,000-10,000 ha
- > 10,000 ha
Is this considered small-, medium- or large-scale (referring to local context)?
- small-scale
5.8 Land ownership, land use rights, and water use rights
Land use rights:
- individual
5.9 Access to services and infrastructure
health:
- poor
- moderate
- good
education:
- poor
- moderate
- good
technical assistance:
- poor
- moderate
- good
employment (e.g. off-farm):
- poor
- moderate
- good
markets:
- poor
- moderate
- good
energy:
- poor
- moderate
- good
roads and transport:
- poor
- moderate
- good
drinking water and sanitation:
- poor
- moderate
- good
financial services:
- poor
- moderate
- good
6. Impacts and concluding statements
6.1 On-site impacts the Technology has shown
Socio-economic impacts
Production
crop production
wood production
Quantity before SLM:
0 t/100 linear metres
Quantity after SLM:
1-1.5/100 linear metres
product diversity
Water availability and quality
drinking water availability
Income and costs
diversity of income sources
Socio-cultural impacts
cultural opportunities
recreational opportunities
conflict mitigation
Ecological impacts
Water cycle/ runoff
water quality
surface runoff
Soil
soil cover
soil loss
nutrient cycling/ recharge
Biodiversity: vegetation, animals
biomass/ above ground C
plant diversity
habitat diversity
6.2 Off-site impacts the Technology has shown
water availability
downstream flooding
groundwater/ river pollution
buffering/ filtering capacity
damage on neighbours' fields
6.3 Exposure and sensitivity of the Technology to gradual climate change and climate-related extremes/ disasters (as perceived by land users)
Gradual climate change
Gradual climate change
| Season | increase or decrease | How does the Technology cope with it? | |
|---|---|---|---|
| annual temperature | increase | well |
Climate-related extremes (disasters)
Meteorological disasters
| How does the Technology cope with it? | |
|---|---|
| local rainstorm | well |
Climatological disasters
| How does the Technology cope with it? | |
|---|---|
| drought | not well |
6.4 Cost-benefit analysis
How do the benefits compare with the establishment costs (from land users’ perspective)?
Short-term returns:
slightly negative
Long-term returns:
positive
How do the benefits compare with the maintenance/ recurrent costs (from land users' perspective)?
Short-term returns:
positive
Long-term returns:
positive
6.5 Adoption of the Technology
Of all those who have adopted the Technology, how many did so spontaneously, i.e. without receiving any material incentives/ payments?
- 51-90%
Comments:
50% of land user families have adopted the Technology with external material support
Comments on acceptance with external material support: On average it was estimated that, among farmers adopting the technology, ca. half of them benefited of incentives.
50% of land user families have adopted the Technology without any external material support
Comments on spontaneous adoption: On average it was estimated that, among farmers adopting the technology, ca. half of them benefited of incentives.
6.7 Strengths/ advantages/ opportunities of the Technology
| Strengths/ advantages/ opportunities in the compiler’s or other key resource person’s view |
|---|
|
protects soil from water erosion How can they be sustained / enhanced? long-term maintenance of buffer zones and soil cover |
|
protects surface water quality How can they be sustained / enhanced? combination with other sustainable technologies (e.g. reduction of pesticides). Spread over larger areas |
|
enhances agro-ecosystem biodiversity How can they be sustained / enhanced? improvement of connecting corridors between habitats |
|
diversifies farmer's production How can they be sustained / enhanced? improve farmers' education |
|
little costs compared to environmenmtal benefits How can they be sustained / enhanced? support farmers on decision making |
6.8 Weaknesses/ disadvantages/ risks of the Technology and ways of overcoming them
| Weaknesses/ disadvantages/ risks in the land user’s view | How can they be overcome? |
|---|---|
| sometimes difficult to adjust crop production requirements with buffer strip occupation of space | support farmers on decision making |
| Weaknesses/ disadvantages/ risks in the compiler’s or other key resource person’s view | How can they be overcome? |
|---|---|
| time-dependent buffer performance | Monitoring saturation-effect conditions in the medium, long-term |
| low efficacy if the technology is maintained in the short-term | improve effectiveness of subsidies to keep the technology in the long-term; increase farmers awareness on soil and water benefits |
7. References and links
7.1 Methods/ sources of information
7.2 References to available publications
Title, author, year, ISBN:
Programma di sviluppo rurale per il veneto 2007-2013, Regione Veneto, 2007. Dipartimento Agricoltura e Sviluppo Rurale.
Links and modules
Expand all Collapse allLinks
Rural development programme in the Veneto region [Italy]
Developing rural areas in the Veneto region through sustainable land management policies
- Compiler: Nicola Dal Ferro
Modules
No modules