Home Gardens [Uganda]
- Creation:
- Update:
- Compiler: Bernard Fungo
- Editors: JOY TUKAHIRWA, Kamugisha Rick Nelson, betty adoch, Sunday Balla Amale
- Reviewers: Nicole Harari, Stephanie Jaquet, Udo Höggel
Yen apita gang ki nyig yat
technologies_2881 - Uganda
View sections
Expand all Collapse all1. General information
1.2 Contact details of resource persons and institutions involved in the assessment and documentation of the Technology
Name of project which facilitated the documentation/ evaluation of the Technology (if relevant)
Scaling-up SLM practices by smallholder farmers (IFAD)Name of the institution(s) which facilitated the documentation/ evaluation of the Technology (if relevant)
Uganda Landcare Network (ULN) - Uganda1.3 Conditions regarding the use of data documented through WOCAT
When were the data compiled (in the field)?
13/4/2017
The compiler and key resource person(s) accept the conditions regarding the use of data documented through WOCAT:
Yes
1.4 Declaration on sustainability of the described Technology
Is the Technology described here problematic with regard to land degradation, so that it cannot be declared a sustainable land management technology?
No
2. Description of the SLM Technology
2.1 Short description of the Technology
Definition of the Technology:
Home gardens provide low-income households with continuous food supply and increase the resilience of their livelihoods to climate change
2.2 Detailed description of the Technology
Description:
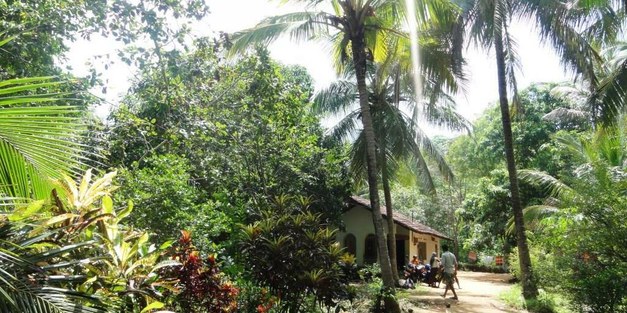
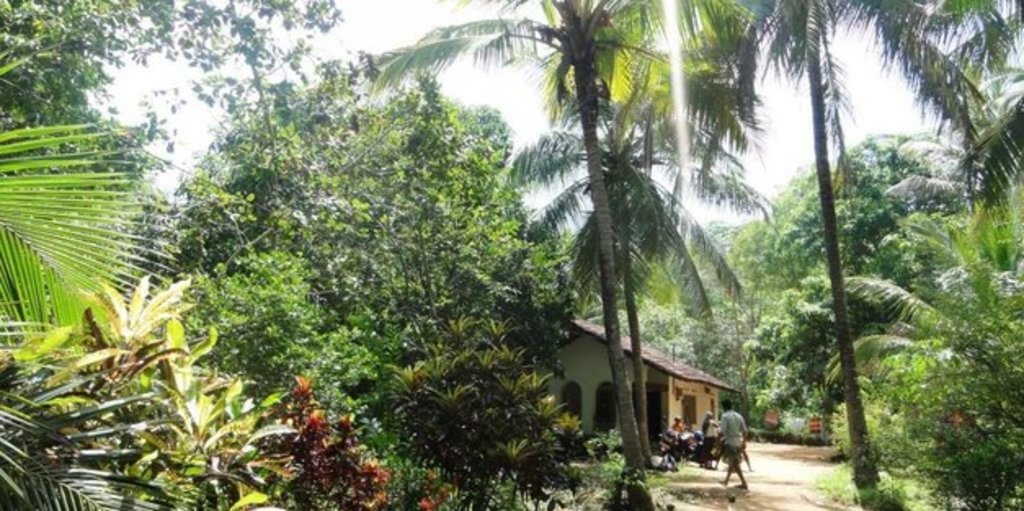
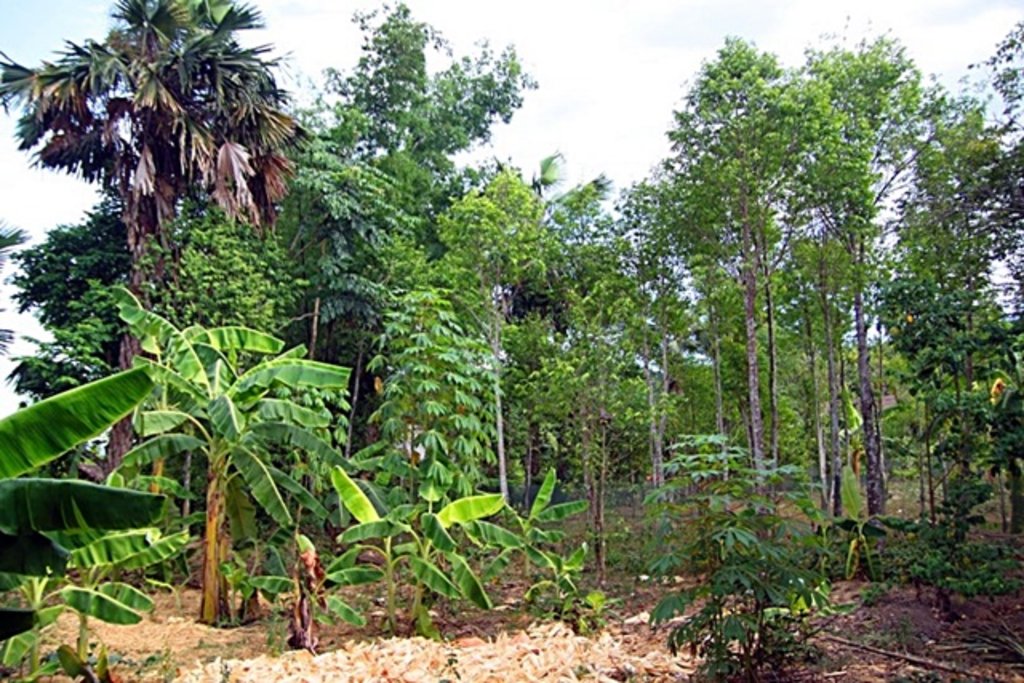
Home gardens are area where the cultivation of a small portion of land, usually around a homestead or within walking distance from the family home. Usually, a mixture of several crops that may include vegetables, fruits, plantation crops, spices, herbs, ornamental and medicinal plants as well as livestock that can serve as a supplementary source of food and income. Home gardens are a cropping system composed of soil, crops, weeds, pathogens and insects that convert resource inputs - solar energy, water, nutrients, labor, etc. - into food, feed, fuel, fiber and pharmaceuticals. Home gardens are important ways to ensure that the low-income households have access to the all the basic livelihood needs throughout the year. This is a resilience technology for resource-constrained farmers in remote parts of the world. During the wet season, farmers plant additional crops mainly vegetables to utilize the lower-storey niches because such crops are more shade tolerant. The multi-species and multi-canopy structure of the farming systems ensures stability against climate extremes such as drought, strong winds and dry spells.
The main features that characterize a home garden are (1) located near the residence; (2) containing a high diversity of plants; (3) production is supplemental rather than a main source of family consumption and income; (4) occupying a small area (~3 acres) and (5) requiring very low external inputs, relying mainly on recycling of crop residues and cow dung and seed from previous season’s harvest.
Home gardens play the role of producing subsistence items and generating additional income for the household. They are known for their stable yields, very varied products, continuous or repeated harvests during the year and low inputs. Whereas home gardens may not be the major sources of livelihood, they are known to contribute 10-35 percent of livelihoods of farmers and their productivity is reported to be up to 20 times that of other land uses such as irrigated fields, rise fields and fish ponds. home gardens are also an important source of nutrients providing approximately 10, 12, 150, 16, 31, 25 and 113 percent of the minimum daily requirement of protein, calcium, carotene, thiamine, riboflavin, niacin and ascorbic acid, respectively.
A large proportion of the products of home gardens is consumed by farmer families especially due to the remoteness of the area where a market economy has not yet developed. Home gardens also play sociol-cultural functions and provide products for religious rituals and ceremonies. The aesthetic role of home gardens is also considered important especially during the dry season when people spend evenings out in the garden. Hence, paying attention solely to the tangible economic and nutritional gains of home gardens, and agroforestry in general misses the various intangible ecological and social values.
2.3 Photos of the Technology
2.4 Videos of the Technology
Date:
13/2017
Location:
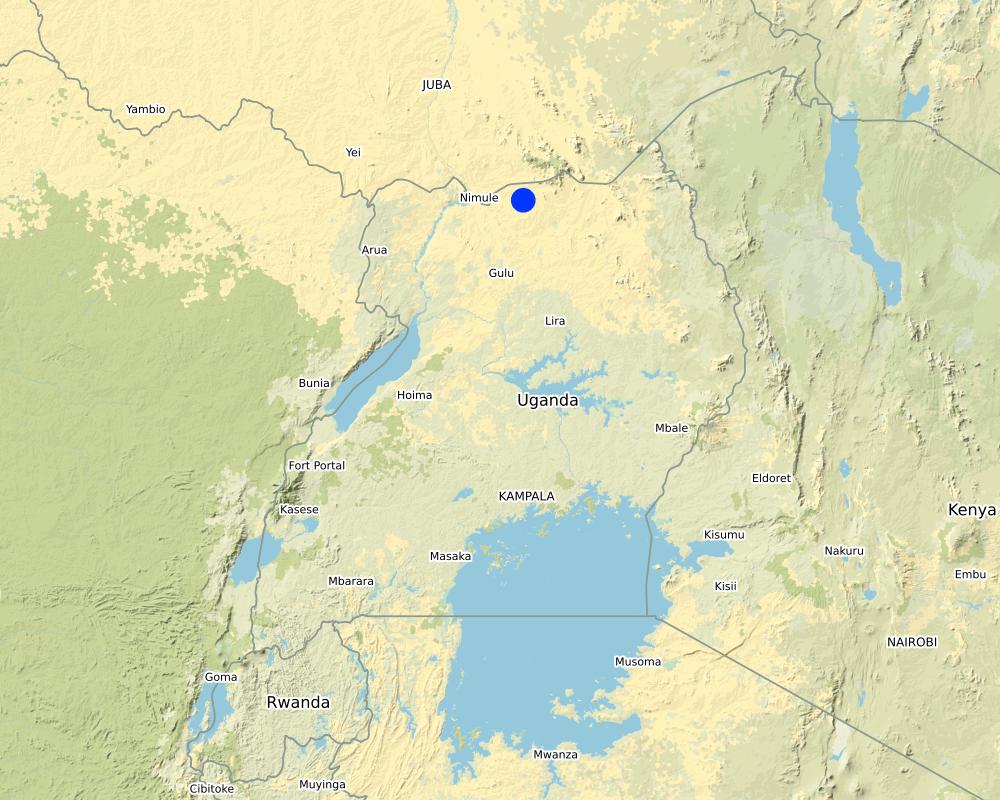
Lamwo District , Northern Uganda
Name of videographer:
Issa Aliga
2.5 Country/ region/ locations where the Technology has been applied and which are covered by this assessment
Country:
Uganda
Region/ State/ Province:
Lamwo District, Northern Uganda
Comments:
Coordinates of only one location are indicated but there were several sites with home gardens.
Map
×2.6 Date of implementation
Indicate year of implementation:
2008
2.7 Introduction of the Technology
Specify how the Technology was introduced:
- as part of a traditional system (> 50 years)
3. Classification of the SLM Technology
3.1 Main purpose(s) of the Technology
- improve production
- conserve ecosystem
- reduce risk of disasters
- adapt to climate change/ extremes and its impacts
- create beneficial economic impact
- create beneficial social impact
3.2 Current land use type(s) where the Technology is applied
Mixed (crops/ grazing/ trees), incl. agroforestry
- Agroforestry
- Agro-pastoralism
- Agro-silvopastoralism
- Silvo-pastoralism
Comments:
All elements of agroforoestry are present in the home gardens
3.3 Further information about land use
Water supply for the land on which the Technology is applied:
- rainfed
Number of growing seasons per year:
- 2
Specify:
March to May and September to November
3.4 SLM group to which the Technology belongs
- agroforestry
- home gardens
3.5 Spread of the Technology
Specify the spread of the Technology:
- evenly spread over an area
If the Technology is evenly spread over an area, indicate approximate area covered:
- < 0.1 km2 (10 ha)
Comments:
Home gardens are usually smaller than 3 acres
3.6 SLM measures comprising the Technology
agronomic measures
- A1: Vegetation/ soil cover
vegetative measures
- V1: Tree and shrub cover
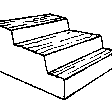
structural measures
- S9: Shelters for plants and animals
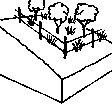
management measures
- M5: Control/ change of species composition
3.7 Main types of land degradation addressed by the Technology

biological degradation
- Bc: reduction of vegetation cover
- Bh: loss of habitats
3.8 Prevention, reduction, or restoration of land degradation
Specify the goal of the Technology with regard to land degradation:
- prevent land degradation
- adapt to land degradation
4. Technical specifications, implementation activities, inputs, and costs
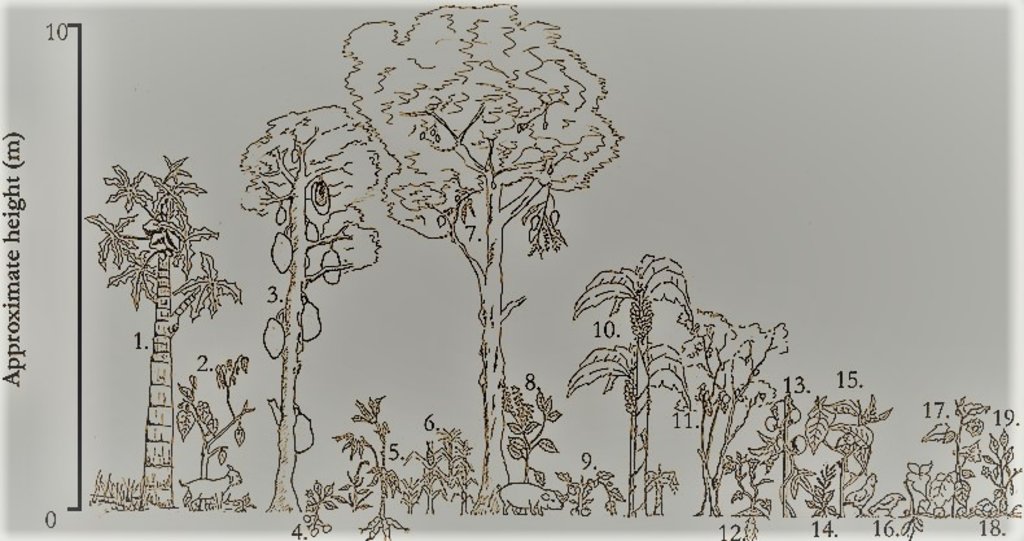
4.1 Technical drawing of the Technology
Author:
Adapted from (Whitney et al. 2017) Artwork by Carolyne Nakaketo.
Date:
13/4/2017
4.2 Technical specifications/ explanations of technical drawing
A typical multilayered Ugandan homegarden structure showing approximate heights for a diversity of edible species. Plants numbered: 1. Carica papaya, 2. Solanum betaceum, 3. Artocarpus heterophyllus, 4. Solanum tuberosum, 5. Manihot esculenta, 6. Zea mays, 7. Mangifera indica, 8. Ocimum gratissimum, 9. Solanum lycopersicum, 10. Musa spp., 11. Psidium guajava, 12. Ipomoea batatas, 13. Passiflora spp., 14. Amarathus spp., 15. Solanum aethiopicum, 16. Xanthasoma spp., 17. Physalis peruviana, 18. Cucurbita spp., and 19. Capsicum spp.
- Land area is approximately 3 acres
-The mixture of plant species benefits form the various niches within the canopy
-Taller, light demanders occupy the upper canopy while the shorter shade tolerant ones occupy the lower canopy
- The homestead is within few meters (< 50 m) of the crop and livestock setting
- Livestock shelter usually located under trees to protect them from hot sunshine
- Kitchen residues are spread in the nearby are, providing fertility to the crops therein. Therefore, the plants nearer the house are generally more healthy
- The home garden is more or less a closed system with limited external input or export of resources to outside
4.3 General information regarding the calculation of inputs and costs
Specify how costs and inputs were calculated:
- per Technology unit
Specify unit:
Acres
Specify volume, length, etc. (if relevant):
3
other/ national currency (specify):
Uganda Shillings
Indicate exchange rate from USD to local currency (if relevant): 1 USD =:
3500.0
Indicate average wage cost of hired labour per day:
5000
4.4 Establishment activities
| Activity | Type of measure | Timing | |
|---|---|---|---|
| 1. | Planting | Agronomic | Start of wet season |
| 2. | Weeding | Management | Throughout the year |
| 3. | Manure management | Management | Throughout the year |
| 4. | Pruning | Agronomic | Throughout the year |
4.5 Costs and inputs needed for establishment
| Specify input | Unit | Quantity | Costs per Unit | Total costs per input | % of costs borne by land users | |
|---|---|---|---|---|---|---|
| Labour | Planting | Days | 20.0 | 5000.0 | 100000.0 | 100.0 |
| Labour | Weeding | Days | 20.0 | 5000.0 | 100000.0 | 100.0 |
| Labour | Manure Management | Days | 20.0 | 5000.0 | 100000.0 | 100.0 |
| Labour | Pruning | Days | 20.0 | 5000.0 | 100000.0 | 100.0 |
| Plant material | Seeds | kg | 5.0 | 50000.0 | 250000.0 | 100.0 |
| Plant material | Suckers and stem cuttings | pieces | 200.0 | 500.0 | 100000.0 | 100.0 |
| Fertilizers and biocides | Animal manure | kg | 2000.0 | 2000.0 | 4000000.0 | 100.0 |
| Construction material | Poles | Pieces | 100.0 | 5000.0 | 500000.0 | 100.0 |
| Construction material | Nails | kg | 15.0 | 3000.0 | 45000.0 | 100.0 |
| Total costs for establishment of the Technology | 5295000.0 | |||||
4.6 Maintenance/ recurrent activities
| Activity | Type of measure | Timing/ frequency | |
|---|---|---|---|
| 1. | Planting | Agronomic | Once a year |
| 2. | Weedindg | Management | Twice a year |
| 3. | Prunning | Management | Three times a year |
| 4. | Manure manageemnt | Management | Throughout the year |
4.7 Costs and inputs needed for maintenance/ recurrent activities (per year)
If possible, break down the costs of maintenance according to the following table, specifying inputs and costs per input. If you are unable to break down the costs, give an estimation of the total costs of maintaining the Technology:
300000.0
| Specify input | Unit | Quantity | Costs per Unit | Total costs per input | % of costs borne by land users | |
|---|---|---|---|---|---|---|
| Labour | Planting | Days | 20.0 | 5000.0 | 100000.0 | 100.0 |
| Labour | Weeding | Days | 20.0 | 5000.0 | 100000.0 | 100.0 |
| Labour | Manure management | Days | 20.0 | 5000.0 | 100000.0 | 100.0 |
| Labour | Pruning | Days | 20.0 | 5000.0 | 100000.0 | 100.0 |
| Equipment | 3.0 | |||||
| Plant material | Seeds | kg | 2.0 | 30000.0 | 60000.0 | 100.0 |
| Plant material | Suckers and stem cuttings | Pieces | 50.0 | 500.0 | 25000.0 | 100.0 |
| Fertilizers and biocides | Manure | kg | 2000.0 | 2000.0 | 4000000.0 | 100.0 |
| Construction material | Poles | Pieces | 30.0 | 5000.0 | 150000.0 | 100.0 |
| Construction material | Nails | kg | 5.0 | 5000.0 | 25000.0 | 100.0 |
| Total costs for maintenance of the Technology | 4660000.0 | |||||
4.8 Most important factors affecting the costs
Describe the most determinate factors affecting the costs:
Labour for maintaining the garden, especially pruning
5. Natural and human environment
5.1 Climate
Annual rainfall
- < 250 mm
- 251-500 mm
- 501-750 mm
- 751-1,000 mm
- 1,001-1,500 mm
- 1,501-2,000 mm
- 2,001-3,000 mm
- 3,001-4,000 mm
- > 4,000 mm
Agro-climatic zone
- sub-humid
5.2 Topography
Slopes on average:
- flat (0-2%)
- gentle (3-5%)
- moderate (6-10%)
- rolling (11-15%)
- hilly (16-30%)
- steep (31-60%)
- very steep (>60%)
Landforms:
- plateau/plains
- ridges
- mountain slopes
- hill slopes
- footslopes
- valley floors
Altitudinal zone:
- 0-100 m a.s.l.
- 101-500 m a.s.l.
- 501-1,000 m a.s.l.
- 1,001-1,500 m a.s.l.
- 1,501-2,000 m a.s.l.
- 2,001-2,500 m a.s.l.
- 2,501-3,000 m a.s.l.
- 3,001-4,000 m a.s.l.
- > 4,000 m a.s.l.
Indicate if the Technology is specifically applied in:
- not relevant
5.3 Soils
Soil depth on average:
- very shallow (0-20 cm)
- shallow (21-50 cm)
- moderately deep (51-80 cm)
- deep (81-120 cm)
- very deep (> 120 cm)
Soil texture (topsoil):
- coarse/ light (sandy)
Soil texture (> 20 cm below surface):
- coarse/ light (sandy)
Topsoil organic matter:
- medium (1-3%)
5.4 Water availability and quality
Ground water table:
5-50 m
Availability of surface water:
medium
Water quality (untreated):
poor drinking water (treatment required)
Is water salinity a problem?
No
Is flooding of the area occurring?
No
5.5 Biodiversity
Species diversity:
- medium
Habitat diversity:
- medium
5.6 Characteristics of land users applying the Technology
Sedentary or nomadic:
- Sedentary
Market orientation of production system:
- subsistence (self-supply)
Off-farm income:
- 10-50% of all income
Relative level of wealth:
- poor
Individuals or groups:
- individual/ household
Level of mechanization:
- manual work
Gender:
- women
- men
Age of land users:
- middle-aged
- elderly
5.7 Average area of land owned or leased by land users applying the Technology
- < 0.5 ha
- 0.5-1 ha
- 1-2 ha
- 2-5 ha
- 5-15 ha
- 15-50 ha
- 50-100 ha
- 100-500 ha
- 500-1,000 ha
- 1,000-10,000 ha
- > 10,000 ha
Is this considered small-, medium- or large-scale (referring to local context)?
- small-scale
5.8 Land ownership, land use rights, and water use rights
Land ownership:
- individual, not titled
Land use rights:
- individual
Water use rights:
- individual
5.9 Access to services and infrastructure
health:
- poor
- moderate
- good
education:
- poor
- moderate
- good
technical assistance:
- poor
- moderate
- good
employment (e.g. off-farm):
- poor
- moderate
- good
markets:
- poor
- moderate
- good
energy:
- poor
- moderate
- good
roads and transport:
- poor
- moderate
- good
drinking water and sanitation:
- poor
- moderate
- good
financial services:
- poor
- moderate
- good
6. Impacts and concluding statements
6.1 On-site impacts the Technology has shown
Socio-economic impacts
Production
crop production
Comments/ specify:
Better yields due to manure application from kitchen residues, soil erosion control and litter decomposition
wood production
Comments/ specify:
Wood from pruning are used for cooking, reducing the need to walk long distances
product diversity
Comments/ specify:
Many crops and livestock products from the mixture of enterprises on the land
Income and costs
expenses on agricultural inputs
Comments/ specify:
Most of the inputs e.g. seeds and manure come from with the farm, therefore low cost of inputs
farm income
workload
Comments/ specify:
So many small activities requiring labour all the time makes the workload big for the land manager
Ecological impacts
Soil
soil cover
Comments/ specify:
Continuous soil cover due to perennials such as trees
soil organic matter/ below ground C
Comments/ specify:
Litter fall and decomposition increases soil organic matter
6.2 Off-site impacts the Technology has shown
downstream siltation
Comments/ specify:
Reduced runoff and erosion due to continuous soil cover
6.3 Exposure and sensitivity of the Technology to gradual climate change and climate-related extremes/ disasters (as perceived by land users)
Climate-related extremes (disasters)
Climatological disasters
| How does the Technology cope with it? | |
|---|---|
| drought | well |
Biological disasters
| How does the Technology cope with it? | |
|---|---|
| insect/ worm infestation | well |
6.4 Cost-benefit analysis
How do the benefits compare with the establishment costs (from land users’ perspective)?
Short-term returns:
positive
Long-term returns:
very positive
How do the benefits compare with the maintenance/ recurrent costs (from land users' perspective)?
Short-term returns:
positive
Long-term returns:
positive
6.5 Adoption of the Technology
- 10-50%
Of all those who have adopted the Technology, how many have did so spontaneously, i.e. without receiving any material incentives/ payments?
- 0-10%
6.6 Adaptation
Has the Technology been modified recently to adapt to changing conditions?
No
6.7 Strengths/ advantages/ opportunities of the Technology
| Strengths/ advantages/ opportunities in the land user’s view |
|---|
| Continuous supply for farm produce through out the year |
| Relatively easy access to planting materials since they are all obtained from within the home garden |
| Strengths/ advantages/ opportunities in the compiler’s or other key resource person’s view |
|---|
| Diversity of the home garden implies resilience to extreme weather events like drought and dry spells |
| Home gardens provide a variety of products that diversify the diet of the participating household and therefore, improve nutrition security |
6.8 Weaknesses/ disadvantages/ risks of the Technology and ways of overcoming them
| Weaknesses/ disadvantages/ risks in the land user’s view | How can they be overcome? |
|---|---|
| Labour intensive and takes place through out the year | |
| Low amounts of produce per crop is inadequate to meet family needs | A portion of the home garden production needs to be commercialised so to generate income for the family |
| Weaknesses/ disadvantages/ risks in the compiler’s or other key resource person’s view | How can they be overcome? |
|---|---|
| Dependence on traditional practices develop a negative nutrient balance of the farming system | Include some fertilizer and pesticides to improve the nutrient balance |
| Failure to adequately prune heavy branches on large upper-storey trees can cause significant yield loss to under-storey species | Constant pruning to open up the canopy for sufficient light to flow into reach the lower canopy species |
7. References and links
7.1 Methods/ sources of information
- field visits, field surveys
1
- interviews with land users
1
7.3 Links to relevant information which is available online
Title/ description:
Plants in the Homegardens in Uganda
URL:
https://www.researchgate.net/publication/325459387_Ethnobotany_and_Agrobiodiversity_Valuation_of_Plants_in_the_Homegardens_of_Southwestern_Uganda
Links and modules
Expand all Collapse allLinks
No links
Modules
No modules


