No-till with controlled traffic [Australie]
- Création :
- Mise à jour :
- Compilateur : Des McGarry
- Rédacteur : –
- Examinateurs : Alexandra Gavilano, Fabian Ottiger
no-till, permanent uncropped wheel tracks,eliminate soil compaction, judiciois spraying
technologies_945 - Australie
Voir les sections
Développer tout Réduire tout1. Informations générales
1.2 Coordonnées des personnes-ressources et des institutions impliquées dans l'évaluation et la documentation de la Technologie
Spécialiste GDT:
Griffith Noel
Nom du projet qui a facilité la documentation/ l'évaluation de la Technologie (si pertinent)
Book project: where the land is greener - Case Studies and Analysis of Soil and Water Conservation Initiatives Worldwide (where the land is greener)1.3 Conditions relatives à l'utilisation par WOCAT des données documentées
Le compilateur et la(les) personne(s) ressource(s) acceptent les conditions relatives à l'utilisation par WOCAT des données documentées:
Oui
1.4 Déclaration sur la durabilité de la Technologie décrite
Est-ce que la Technologie décrite ici pose problème par rapport à la dégradation des terres, de telle sorte qu'elle ne peut pas être déclarée comme étant une technologie de gestion durable des terres?
Non
2. Description de la Technologie de GDT
2.1 Courte description de la Technologie
Définition de la Technologie:
Large-scale no-till grain production with permanent wheel tracks
common to all on-farm equipment.
2.2 Description détaillée de la Technologie
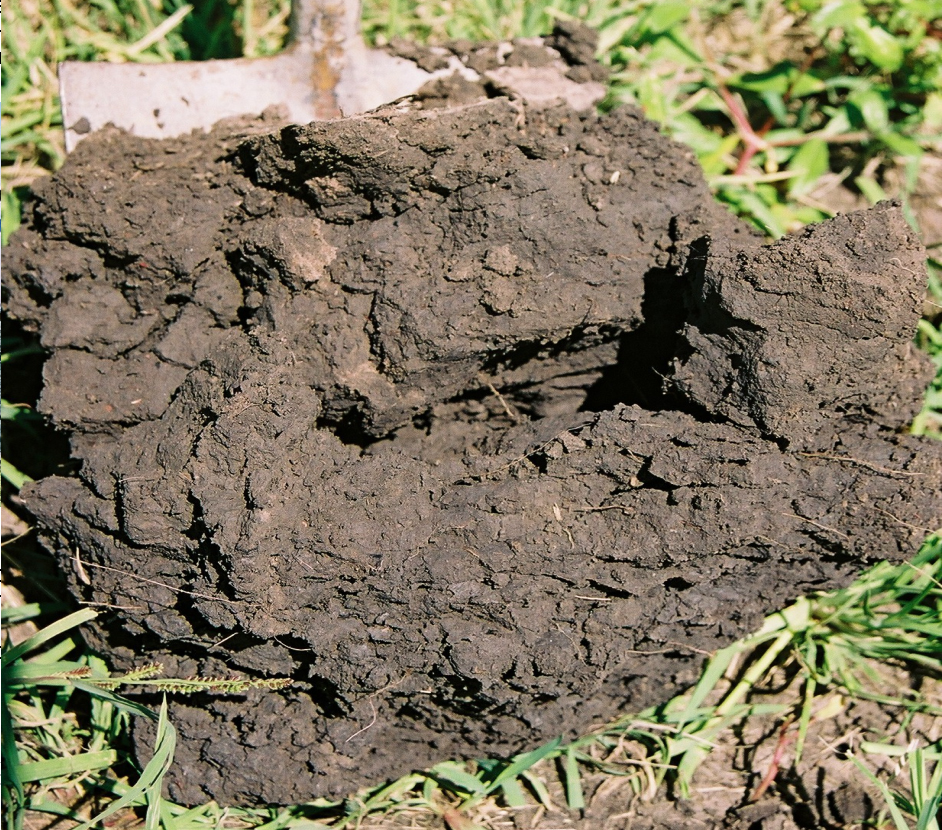
Description:
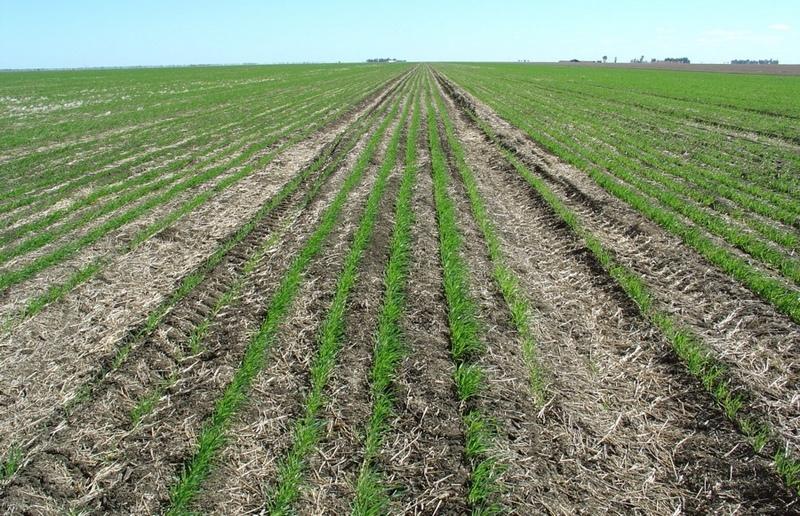
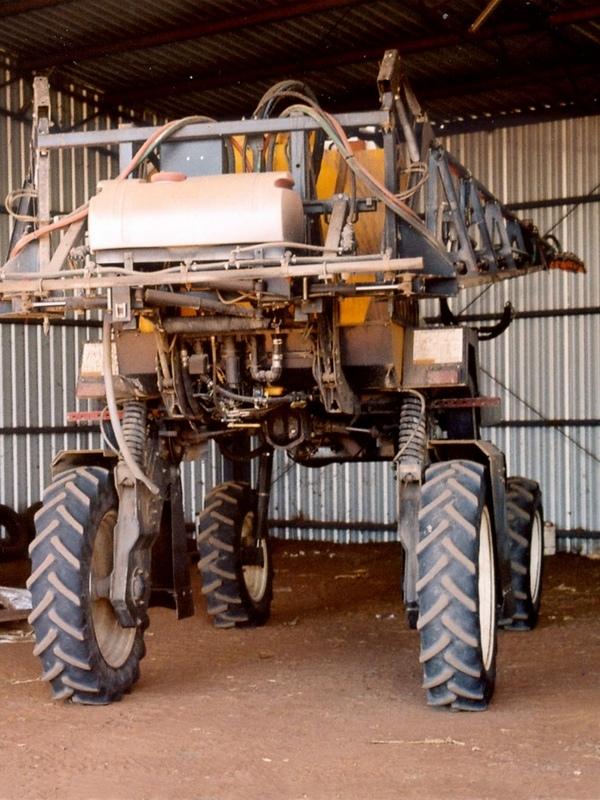
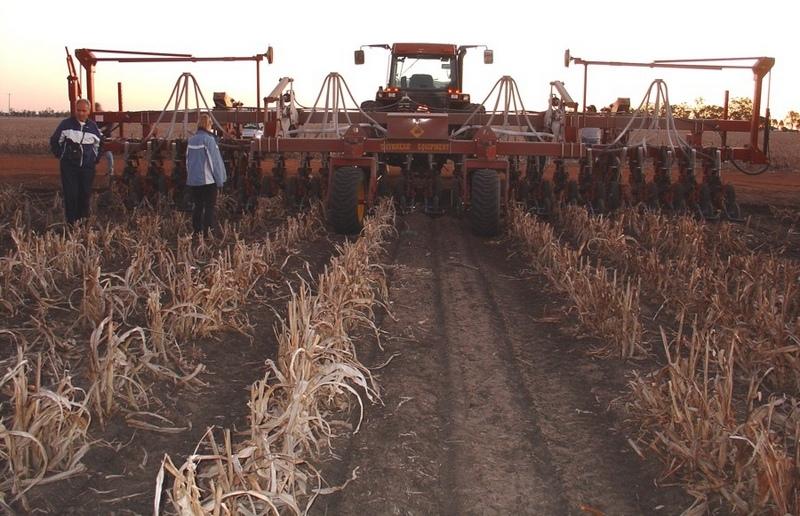
This controlled traffic, no-till farming system (CT/NT) is practiced on a 1,900 ha farm on the broad, almost flat Jandowae Plains in semi-arid Queensland, Australia. Principal soil types are vertisols, with some poorer areas where the sand content is greater, and these have a tendency to hard-set and crust. Over the past five years, the farm owner has changed the farming system completely from conventional farming to no-till with controlled traffic. Controlled traffic means permanent uncropped wheel tracks or ‘tramlines’: all equipment has 2 metre axles. The total farm machinery comprises a tractor, a spray rig and two 11 meter zero-till planter/fertilizer units; one each for wheat and sorghum sowing. The tramlines were laid out two years ago by a contractor using Geographical Positioning System (GPS).
The main technical objective was to eliminate soil compaction. The CT/NT combination ensures the land -between the tramlines - remains in excellent condition. There has been no ploughing or tillage at all in those 5 years. He practices a three year rotation between winter wheat, summer sorghum and fallow, but the system is not fixed: it depends very much on soil moisture status and thus on the rainfall (opportunity cropping). Generally in summer about one third is in summer sorghum and in winter about one third in winter wheat, the rest of the land is
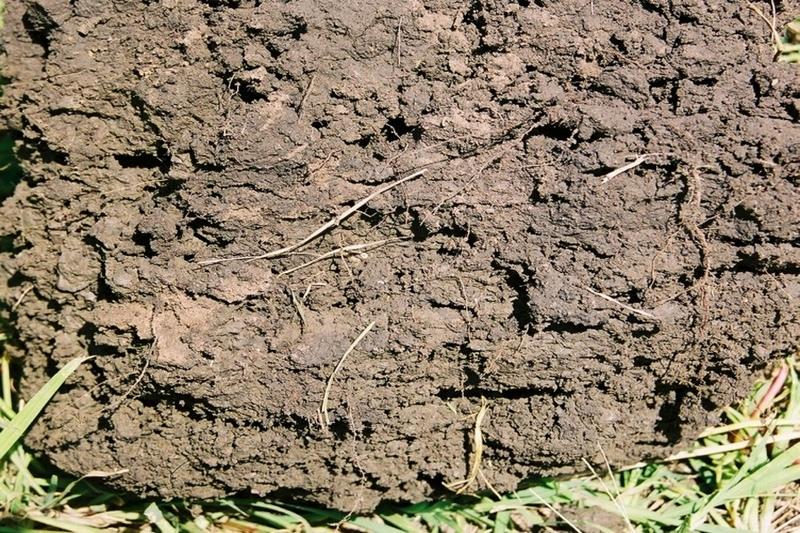
under fallow. The one-year fallow is maintained through the use of herbicides sprayed onto the undisturbed residue from the previous crop. The system is designed for rain capture - to build up soil moisture stores in the fallow periods for subsequent crops - and for disease control (to ‘spell’ the land). During the cropping cycle, the key to his effective weed control system is ‘to get in early’ and ‘actively chase weeds’ through judicious spraying. The farm is now free of the locally common persistent weed Erigeron annuus. In the five years his sorghum yields have risen from 3 to 7 tons per hectares. Over the last three years the soil has improved, becoming soft, friable and moist between his plant lines. Infiltration has improved a lot and soil structure is now excellent.
Tractor use and overall fuel consumption has decreased to less than one quarter of that under conventional tillage. Correspondingly the workload is hugely reduced: from four men required under the conventional system for an equivalent area, the farmer is the sole operator, very occasionally assisted by his son, and a paid contractor for harvesting. He is so satisfied with the CT/NT system that he is attempting to purchase a nearby property to extend the area that he can farm using his current machinery.
2.3 Photos de la Technologie
Galerie Médias
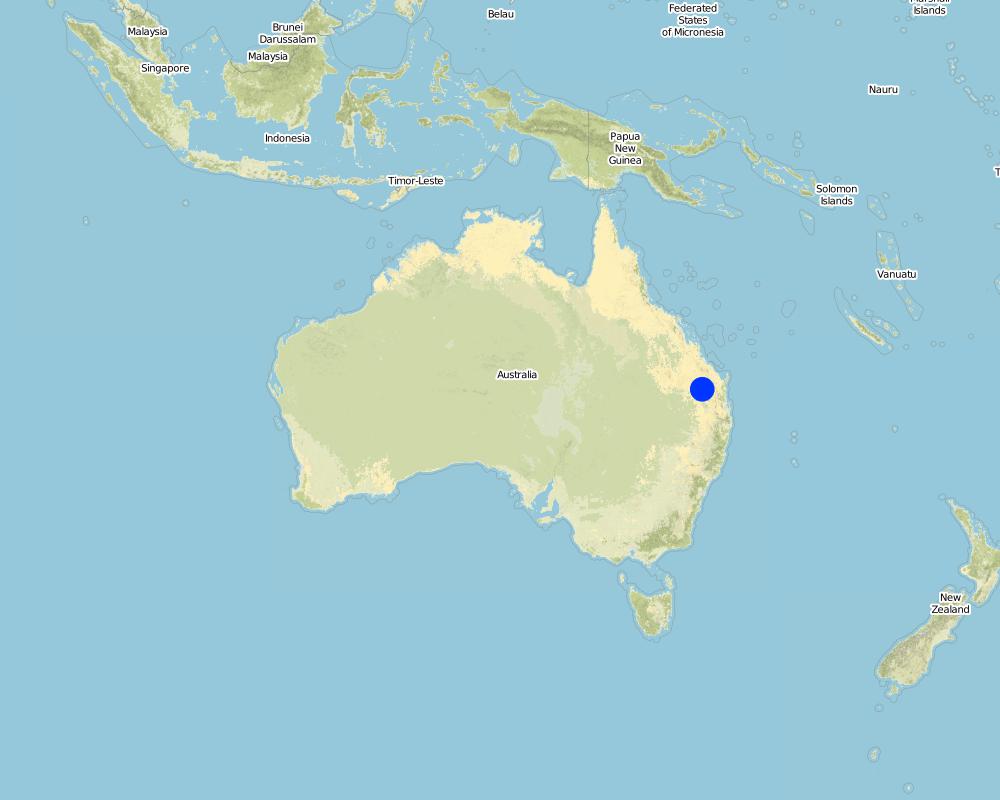
2.5 Pays/ région/ lieux où la Technologie a été appliquée et qui sont couverts par cette évaluation
Pays:
Australie
Région/ Etat/ Province:
Jimbour (north of Dalby), Queensland
Spécifiez la diffusion de la Technologie:
- répartie uniformément sur une zone
Si la Technologie est uniformément répartie sur une zone, précisez la superficie couverte (en km2):
19,0
S'il n'existe pas d'informations exactes sur la superficie, indiquez les limites approximatives de la zone couverte:
- 10-100 km2
Map
×2.7 Introduction de la Technologie
Spécifiez comment la Technologie a été introduite: :
- au cours d'expérimentations / de recherches
3. Classification de la Technologie de GDT
3.1 Principal(aux) objectif(s) de la Technologie
- améliorer la production
- réduire, prévenir, restaurer les terres dégradées
- créer un impact économique positif
3.2 Type(s) actuel(s) d'utilisation des terres, là où la Technologie est appliquée
Les divers types d'utilisation des terres au sein du même unité de terrain: :
Non

Terres cultivées
- Cultures annuelles
Cultures annuelles - Précisez les cultures:
- céréales - sorgho
- céréales - blé d'hiver
Nombre de période de croissance par an: :
- 2
Précisez:
Longest growing period in days: 180 Longest growing period from month to month: Oct - AprS econd longest growing period in days: 180 Second longest growing period from month to month: Apr - Sep
Est-ce que les cultures intercalaires sont pratiquées?
Non
Est-ce que la rotation des cultures est appliquée?
Oui
Si oui, veuillez préciser:
wheat-sorghum-fallow
Commentaires:
Major land use problems (compiler’s opinion): The farmer’s main reason for starting the combination of CT and NT was to rid himself of soil compaction, in order to achieve better utilisation of locally low and unpredictable rainfall amounts while minimising costs and reducing labour and machinery requirements.
3.3 Est-ce que l’utilisation des terres a changé en raison de la mise en œuvre de la Technologie ?
Est-ce que l’utilisation des terres a changé en raison de la mise en œuvre de la Technologie ?
- Non (Passez à la question 3.4)
3.4 Approvisionnement en eau
Approvisionnement en eau des terres sur lesquelles est appliquée la Technologie:
- pluvial
3.5 Groupe de GDT auquel appartient la Technologie
- perturbation minimale du sol
3.6 Mesures de GDT constituant la Technologie

pratiques agronomiques
- A3: Traitement de la couche superficielle du sol
A3: Différenciez les systèmes de travail du sol:
A 3.1: Systèmes de culture sans travail du sol
Commentaires:
Main measures: agronomic measures
3.7 Principaux types de dégradation des terres traités par la Technologie

érosion hydrique des sols
- Wt: perte de la couche superficielle des sols (couche arable)/ érosion de surface
- Wg: ravinement/ érosion en ravines
érosion éolienne des sols
- Et: perte de la couche superficielle des sols (couche arable)

dégradation physique des sols
- Pc: compaction
Commentaires:
Main type of degradation addressed: Wt: loss of topsoil / surface erosion, Pc: compaction
Secondary types of degradation addressed: Wg: gully erosion / gullying, Et: loss of topsoil
3.8 Prévention, réduction de la dégradation ou réhabilitation des terres dégradées
Spécifiez l'objectif de la Technologie au regard de la dégradation des terres:
- réduire la dégradation des terres
4. Spécifications techniques, activités, intrants et coûts de mise en œuvre
4.1 Dessin technique de la Technologie
Spécifications techniques (associées au dessin technique):
Main technical functions: control of raindrop splash, control of dispersed runoff: retain / trap, improvement of ground cover, increase in organic matter, increase of infiltration, increase / maintain water stored in soil, improvement of soil structure, reduction of compaction by traffic, increase of soil fertility
Technical knowledge required for field staff / advisors: moderate; Technical knowledge required for land users: moderate
4.2 Informations générales sur le calcul des intrants et des coûts
Indiquez la monnaie utilisée pour le calcul des coûts:
- dollars américains
Indiquez le coût salarial moyen de la main d'œuvre par jour:
160
4.3 Activités de mise en place/ d'établissement
| Activité | Calendrier des activités (saisonnier) | |
|---|---|---|
| 1. | layout of the controlled traffic lines (tramlines) using GPS mounted in a 4x4 vehicle. Two days were adequate for the whole farm. |
4.4 Coûts et intrants nécessaires à la mise en place
| Spécifiez les intrants | Unité | Quantité | Coûts par unité | Coût total par intrant | % des coût supporté par les exploitants des terres | |
|---|---|---|---|---|---|---|
| Main d'œuvre | Labour | ha | 1,0 | 5,0 | 5,0 | 100,0 |
| Coût total de mise en place de la Technologie | 5,0 | |||||
| Coût total de mise en place de la Technologie en dollars américains (USD) | 5,0 | |||||
Commentaires:
Duration of establishment phase: 12 month(s)
4.5 Activités d'entretien/ récurrentes
| Activité | Calendrier/ fréquence | |
|---|---|---|
| 1. | Layout of the controlled traffic lines (tramlines) | Two days were adequate for the establishment on the whole farm. |
| 2. | Weed control (spray-coupe) with roundup | Summer sorghum (650 ha, during 1 season or half a year) |
| 3. | Fertilizing | Summer sorghum (650 ha, during 1 season or half a year) |
| 4. | Sowing and simultaneous application of starter fertilizer | Mid October, Summer sorghum (650 ha, during 1 season or half a year) |
| 5. | Spraying pre-emergent herbicide to kill summer grasses | Summer sorghum (650 ha, during 1 season or half a year) |
| 6. | Harvest by contractors | early March, Summer sorghum (650 ha, during 1 season or half a year) |
| 7. | Weed control | Winter wheat (650 ha, during 1 season or half a year) |
| 8. | Fertilizing (Urea) | Winter wheat (650 ha, during 1 season or half a year) |
| 9. | Sowing and simultaneous application of starter fertilizer | Mid May, Winter wheat (650 ha, during 1 season or half a year) |
| 10. | In-crop weed spray | Winter wheat (650 ha, during 1 season or half a year) |
| 11. | Harvest by contractors | October |
| 12. | Fallow (1,250 ha) | During 2 seasons or totally 1 year |
| 13. | Weed control (combination of roundup mixed with broadleaf herbicide) | 5–6 times per fallow period |
| 14. | Determine the soil moisture (To determine soil moisture he uses an iron rod; if he can push it into the heavy clay soil, then the soil is moist. Additionally, he measures rainfall) |
4.6 Coûts et intrants nécessaires aux activités d'entretien/ récurrentes (par an)
| Spécifiez les intrants | Unité | Quantité | Coûts par unité | Coût total par intrant | % des coût supporté par les exploitants des terres | |
|---|---|---|---|---|---|---|
| Main d'œuvre | Labour | ha | 1,0 | 5,0 | 5,0 | 100,0 |
| Equipements | Animal traction | ha | 1,0 | 6,0 | 6,0 | 100,0 |
| Equipements | Harvesting by contractor | ha | 1,0 | 17,0 | 17,0 | 100,0 |
| Matériel végétal | Seeds | ha | 1,0 | 8,0 | 8,0 | 100,0 |
| Engrais et biocides | Fertilizer | ha | 1,0 | 53,0 | 53,0 | 100,0 |
| Engrais et biocides | Biocides | ha | 1,0 | 22,0 | 22,0 | 100,0 |
| Coût total d'entretien de la Technologie | 111,0 | |||||
| Coût total d'entretien de la Technologie en dollars américains (USD) | 111,0 | |||||
Commentaires:
Machinery/ tools: tactor,spray rig, zero-till planter/fertilizer, iron rod
Comparison of costs between conventional tillage and no-till farming (CT/NT): (1) Labour costs are 4x less in CT/NT: 4 men used to work on the farm (conventional), now the farmer is alone – (plus contractors for harvesting). (2) Average annual diesel consumption: reduced from 108,333 litres (conventional) to 13,636 litres (no-till) which is 8 times less. (3) Costs of equipment to set up a CT/NT system (US$ 240,000) are 3 times less than that for conventional tillage equipment (US$ 700,000).
(4) For biocides he has to invest 5 times more in CT/NT. The conventional values are estimates.
4.7 Facteurs les plus importants affectant les coûts
Décrivez les facteurs les plus importants affectant les coûts :
In average one third of the farm area is in crop and two thirds are fallow. This means that overall farming costs per
ha are reduced, since during fallow period activities are limited to spraying herbicides. Labour costs approximately US$ 160 per day. Machinery costs average out at US$ 20 per hour (diesel costs US$ 0.9 per litre). All the data comes from this single farmer. Purchase of equipment is not included in the table above.
5. Environnement naturel et humain
5.1 Climat
Précipitations annuelles
- < 250 mm
- 251-500 mm
- 501-750 mm
- 751-1000 mm
- 1001-1500 mm
- 1501-2000 mm
- 2001-3000 mm
- 3001-4000 mm
- > 4000 mm
Zone agro-climatique
- semi-aride
- aride
Thermal climate class: subtropics
5.2 Topographie
Pentes moyennes:
- plat (0-2 %)
- faible (3-5%)
- modéré (6-10%)
- onduleux (11-15%)
- vallonné (16-30%)
- raide (31-60%)
- très raide (>60%)
Reliefs:
- plateaux/ plaines
- crêtes
- flancs/ pentes de montagne
- flancs/ pentes de colline
- piémonts/ glacis (bas de pente)
- fonds de vallée/bas-fonds
Zones altitudinales:
- 0-100 m
- 101-500 m
- 501-1000 m
- 1001-1500 m
- 1501-2000 m
- 2001-2500 m
- 2501-3000 m
- 3001-4000 m
- > 4000 m
Commentaires et précisions supplémentaires sur la topographie:
Landforms: Also footslopes and valley floors (both ranked 2)
Slopes on average: Also moderate (ranked 2) and rolling (ranked 3)
5.3 Sols
Profondeur moyenne du sol:
- très superficiel (0-20 cm)
- superficiel (21-50 cm)
- modérément profond (51-80 cm)
- profond (81-120 cm)
- très profond (>120 cm)
Texture du sol (de la couche arable):
- fin/ lourd (argile)
Matière organique de la couche arable:
- moyen (1-3%)
- faible (<1%)
Si disponible, joignez une description complète du sol ou précisez les informations disponibles, par ex., type de sol, pH/ acidité du sol, capacité d'échange cationique, azote, salinité, etc.
Soil depth on average: Also shallow and deep (both ranked 2)
Soil fertility: Medium (ranked 1) and high (ranked 2)
Soil drainage: Poor
5.6 Caractéristiques des exploitants des terres appliquant la Technologie
Orientation du système de production:
- commercial/ de marché
Revenus hors exploitation:
- moins de 10% de tous les revenus
Niveau relatif de richesse:
- moyen
Indiquez toute autre caractéristique pertinente des exploitants des terres:
and own 88% of the land.
5.7 Superficie moyenne des terres utilisées par les exploitants des terres appliquant la Technologie
- < 0,5 ha
- 0,5-1 ha
- 1-2 ha
- 2-5 ha
- 5-15 ha
- 15-50 ha
- 50-100 ha
- 100-500 ha
- 500-1 000 ha
- 1 000-10 000 ha
- > 10 000 ha
5.8 Propriété foncière, droits d’utilisation des terres et de l'eau
Propriété foncière:
- individu, avec titre de propriété
Droits d’utilisation des terres:
- individuel
6. Impacts et conclusions
6.1 Impacts sur site que la Technologie a montrés
Impacts socio-économiques
Production
production agricole
Revenus et coûts
revenus agricoles
Impacts socioculturels
connaissances sur la GDT/ dégradation des terres
Impacts écologiques
Cycle de l'eau/ ruissellement
drainage de l'excès d'eau
Sols
humidité du sol
couverture du sol
perte en sol
compaction du sol
matière organique du sol/ au dessous du sol C
Biodiversité: végétale, animale
diversité végétale
diversité animale
diversité des habitats
Autres impacts écologiques
Soil fertility
6.2 Impacts hors site que la Technologie a montrés
flux des cours d'eau fiables et stables en saison sèche
inondations en aval
envasement en aval
pollution des rivières/ nappes phréatiques
Transported sediments
6.4 Analyse coûts-bénéfices
Quels sont les bénéfices comparativement aux coûts de mise en place (du point de vue des exploitants des terres)?
Rentabilité à court terme:
très positive
Rentabilité à long terme:
très positive
Quels sont les bénéfices comparativement aux coûts d'entretien récurrents (du point de vue des exploitants des terres)?
Rentabilité à court terme:
très positive
Rentabilité à long terme:
très positive
6.5 Adoption de la Technologie
Si disponible, quantifiez (nombre de ménages et/ou superficie couverte):
200
Commentaires:
200 land user families have adopted the Technology without any external material support
There is no trend towards spontaneous adoption of the Technology
Comments on adoption trend: There isn’t a strong trend now towards growing spontaneous adoption: uptake has slowed dramatically as many conservative farmers prefer to continue their traditional tillage practices.
6.7 Points forts/ avantages/ possibilités de la Technologie
| Points forts/ avantages/ possibilités du point de vue du compilateur ou d'une autre personne ressource clé |
|---|
|
Land that previously was un-farmable is now under crops. Site inspection shows initially poor land to be now in good condition (after only 5 years). The value of the land has increased How can they be sustained / enhanced? Farmers practising CT/NT can and are buying/leasing more land, which will improve the overall state of the land in Queensland. |
|
Farmers can manage much larger growing areas with less personnel and equipment. A single operator is well able to run a large arable farm on his own How can they be sustained / enhanced? Ditto. |
|
Cereal farming is now less prone to yield losses (and crop failure) in drought years – as there is better rainwater infiltration and water use efficiency with CT/NT How can they be sustained / enhanced? Continue with the system. |
| He has all weeds under control (without need for tillage). |
6.8 Faiblesses/ inconvénients/ risques de la Technologie et moyens de les surmonter
| Faiblesses/ inconvénients/ risques du point de vue du compilateur ou d'une autre personne ressource clé | Comment peuvent-ils être surmontés? |
|---|---|
| The contract harvester runs on 3 m wide axles, so the wheels run on the beds. However, there has only been one wet harvest in 5 years so the incidence of soil compaction from harvesting is negligible | This is not really seen as a problem. One solution would be to build a dedicated harvester (too expensive) or find a contractor with equipment that fitted the system. |
| A conservative mentality towards conservation agriculture is constraining the adoption of the system by other farmers | Continue demonstrating and disseminating knowledge about benefits. |
7. Références et liens
7.1 Méthodes/ sources d'information
7.2 Références des publications disponibles
Titre, auteur, année, ISBN:
Blackwell P (1998) Customised controlled traffic farming systems, instead of standard recommendations or ‘tramlines ain’t tramlines’.In Second national controlled farming conference, pp. 23–26. Eds JN Tullberg and DF Yule.
Disponible à partir d'où? Coût?
Gatton College: University of Queensland
Titre, auteur, année, ISBN:
Hulme PJ, McKenzie DC, MacLeod DA and Anthony DTW (1996) An evaluation of controlled traffic with reduced tillage for irrigated cotton on a Vertisol.
Soil and Tillage Research 38:217–237
Titre, auteur, année, ISBN:
McGarry D, Bridge BJ and Radford BJ (2000). Contrasting soil physical properties after zero and traditional tillage of an alluvial soil in the semi-arid tropics. Soil and Tillage Research 53:105–115
Liens et modules
Développer tout Réduire toutLiens
Aucun lien
Modules
Aucun module trouvé