Index Based Livestock Insurance [ເຄັນຢາ]
- ການສ້າງ:
- ປັບປູງ:
- ຜູ້ສັງລວມຂໍ້ມູນ: Duncan Collins Khalai
- ບັນນາທິການ: –
- ຜູ້ທົບທວນຄືນ: Rima Mekdaschi Studer, Donia Mühlematter, Hanspeter Liniger
IBLI
technologies_3361 - ເຄັນຢາ
- ສະຫຼຸບສັງລວມຢ່າງທັງໝົດທີ່ເປັນ PDF
- ສັງລວມເປັນບົດ PDF ເພື່ອສັ່ງພິມ
- ສັງລວມເປັນບົດ ຢູ່ໃນ browser
- ບົດສະຫຼຸບ ສະບັບເຕັມ (ບໍ່ມີແບບຟອມ)
- Index Based Livestock Insurance: May 9, 2019 (inactive)
- Index Based Livestock Insurance: Sept. 3, 2018 (inactive)
- Index Based Livestock Insurance: Nov. 2, 2021 (public)
- Index Based Livestock Insurance: June 7, 2018 (inactive)
- Index Based Livestock Insurance: May 13, 2018 (inactive)
- Index Based Livestock Insurance: Jan. 25, 2018 (inactive)
ເບິ່ງພາກສ່ວນ
ຂະຫຍາຍທັງໝົດ ຍຸບທັງໝົດ1. ຂໍ້ມູນທົ່ວໄປ
1.2 ຂໍ້ມູນ ການຕິດຕໍ່ພົວພັນ ຂອງບຸກຄົນທີ່ສໍາຄັນ ແລະ ສະຖາບັນ ທີ່ມີສ່ວນຮ່ວມ ໃນການປະເມີນເອກກະສານ ເຕັກໂນໂລຢີ
ບັນດາຜູ້ຕອບແບບສອບຖາມທີ່ສໍາຄັນ ()
ຜຸ້ຊ່ຽວຊານ ດ້ານການຄຸ້ມຄອງ ທີ່ດິນແບບຍືນຍົງ:
ຊື່ໂຄງການ ທີ່ອໍານວຍຄວາມສະດວກ ໃນການສ້າງເອກກະສານ/ປະເມີນ ເຕັກໂນໂລຢີ (ຖ້າກ່ຽວຂ້ອງ)
Index Based Livestock Insurance, Kenya (IBLI)ຊື່ສະຖາບັນ (ຫຼາຍສະຖາບັນ) ທີ່ອໍານວຍຄວາມສະດວກ ໃນການສ້າງເອກກະສານ / ປະເມີນ ເຕັກໂນໂລຢີ (ຖ້າກ່ຽວຂ້ອງ)
ILRI International Livestock Research Institute (ILRI) - ເຄັນຢາ1.3 ເງື່ອນໄຂ ກ່ຽວກັບ ການນໍາໃຊ້ຂໍ້ມູນເອກະສານ ທີ່ສ້າງຂື້ນ ໂດຍຜ່ານ ອົງການພາບລວມຂອງໂລກ ທາງດ້ານແນວທາງ ແລະ ເຕັກໂນໂລຢີ ຂອງການອານຸລັກ ທໍາມະຊາດ (WOCAT)
ເມື່ອໃດທີ່ໄດ້ສັງລວມຂໍ້ມູນ (ຢູ່ພາກສະໜາມ)?
24/01/2018
ຜູ້ປ້ອນຂໍ້ມູນ ແລະ ບຸກຄົນສຳຄັນ ທີ່ໃຫ້ຂໍ້ມູນ (ຫຼາຍ) ຍິນຍອມ ຕາມເງື່ອນໄຂ ໃນການນຳໃຊ້ຂໍ້ມູນ ເພື່ອສ້າງເປັນເອກກະສານຂອງ WOCAT:
ແມ່ນ
1.4 ແຈ້ງການວ່າ ດ້ວຍຄວາມຍືນຍົງຂອງ ເຕັກໂນໂລຢີ
ການນໍາໃຊ້ ເຕັກໂນໂລຢີ ດັ່ງກ່າວໄດ້ອະທິບາຍ ເຖິງບັນຫາ ກ່ຽວກັບ ການເຊື່ອມໂຊມຂອງດິນບໍ? ຖ້າບໍ່ດັ່ງນັ້ນ ມັນບໍ່ສາມາດ ຢັ້ງຢືນໄດ້ວ່າ ເປັນເຕັກໂນໂລຊີ ໃນການຄຸ້ມຄອງ ທີ່ດິນແບບຍືນຍົງ? :
ບໍ່ແມ່ນ
2. ການອະທິບາຍ ເຕັກໂນໂລຢີ ຂອງການຄຸ້ມຄອງ ທີ່ດິນແບບຍືນຍົງ
2.1 ຄໍາອະທິບາຍສັ້ນຂອງ ເຕັກໂນໂລຢີ
ການກຳໜົດຄວາມໝາຍ ຂອງເຕັກໂນໂລຢີ:
Index-Based Livestock Insurance (IBLI) is a product that was designed to help protect pastoralists and their livestock against the effects of prolonged forage scarcity. IBLI triggers payment to pastoralists when the forage situation deteriorates to levels considered to be severe, as compared to historical conditions over time.
2.2 ການອະທິບາຍ ລາຍລະອຽດ ຂອງເຕັກໂນໂລຢີ
ການພັນລະນາ:
In the event of severe seasonal drought, forage and grazing resources are depleted and livestock may die because of starvation. Index Based Livestock Insurance (IBLI) is the technology applied in the provision of forage based livestock (asset) protection insurance. IBLI uses Normalized Difference Vegetation Index (NDVI), a satellite-derived indicator of the amount and vigor of vegetation, based on the observed level of photosynthetic activity (Tucker et al., 2005). NDVI is derived from 10-day composites of 250m filtered eMODIS processed by the United States’ National Aeronautics and Space Administration (NASA) and transformed by The Earth Resources Observation Systems (EROS) Data Center (EDC) of the US Geological Survey (USGS). NDVI data from the AQUA satellite platform are available from July 2002 to present at https://lta.cr.usgs.gov/emodis.
In the case of IBLI, the index is a deviation of cumulative forage availability (ZCumNDVI) in the insured season. It measures forage conditions over a defined time period and compares the observed NDVI over a particular season, with the observed NDVI over a given historical period (e.g. 15 years). A set threshold below which payouts must be made is called the trigger level. Therefore, when the forage situation in a given season is worse than the 20th worst season in the last 15 years, a payout is triggered. In other words, IBLI will compensate if the forage conditions fall below the worst 20th percentile of seasonal pasture levels cumulated over the historical drought seasons in the past 15 years. IBLI therefore uses the satellite-based vegetation index to measure forage availability and to trigger timely payouts to pastoralists based on the costs of providing supplementary feeds to the animals for the specific season that a drought is triggered.
For precision and proper administration each insured county is broken down into smaller units of insurance which are referred to as Unit Areas of Insurance (UAIs). Each UAI represents a geographical area whose forage availability index data are aggregated as one unit for insurance purposes. The identification of the geographic areas that constitute UAIs is a key step in IBLI contract design because the use of average NDVI over insurable units is based on the premise that drought is a covariate shock and that pastoral communities affected in a particular area are deemed to suffer in equal measure.Thus, for accuracy and acceptability, the index should be tightly correlated with forage scarcity and reflect relative conditions on the ground. Also forage access should be relatively homogeneous for herders residing in the same insurable unit. The process of demarcating UAIs is known as clustering. It is done through a combination of active participatory community engagement and scientific methods .
Insured pastoralists are not always paid when there is drought. They are only paid when drought is so severe that the amount of forage falls below the strike level. Insured pastoralists will not receive payments if the forage availability is more than the strike level. This is an annual policy which covers forage availability as measured by satellite Normalized Difference Vegetation Index (NDVI) in up to 2 rainy seasons as per the bimodal rain patterns in Kenya. Pastoralists who do not hold insurance contracts are not covered by under, and therefore do not receive payments, even if they live in the same UAIs as the ones who have insured their livestock.
2.3 ຮູບພາບຂອງເຕັກໂນໂລຢີ
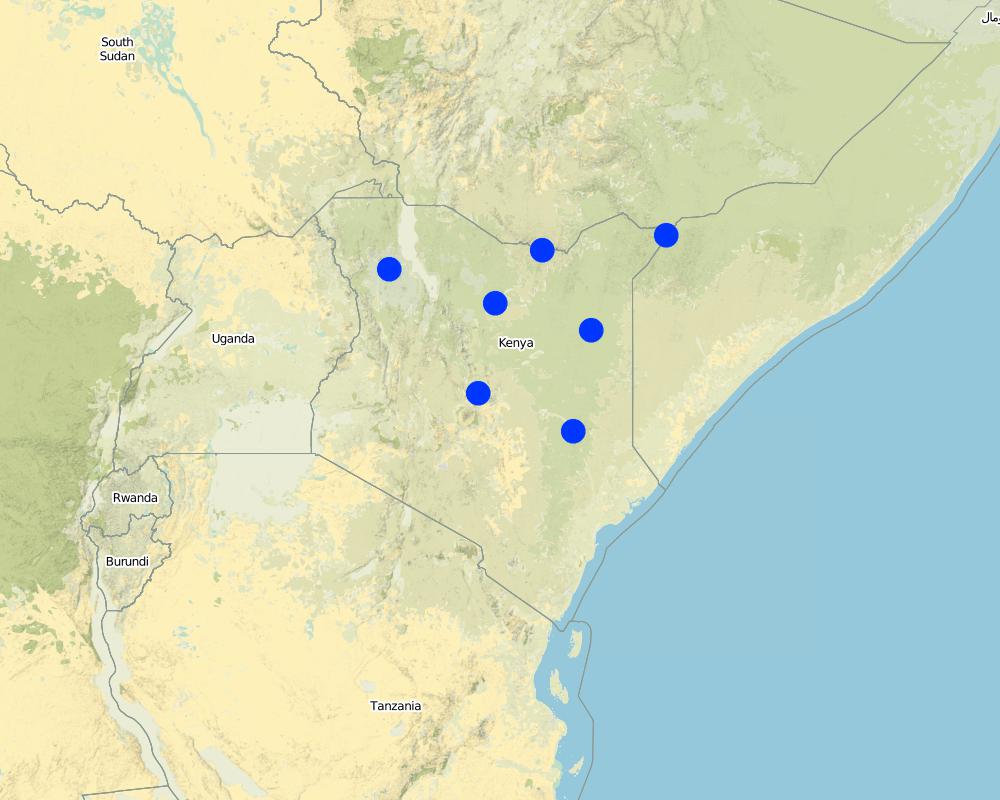
2.5 ປະເທດ / ເຂດ / ສະຖານທີ່ບ່ອນທີ່ ເຕັກໂນໂລຢີ ໄດ້ຮັບການນໍາໃຊ້ ແລະ ທີ່ຖືກປົກຄຸມດ້ວຍການປະເມີນຜົນ
ປະເທດ:
ເຄັນຢາ
Map
×2.6 ວັນທີໃນການຈັດຕັ້ງປະຕິບັດ
ຖ້າຫາກວ່າ ບໍ່ຮູ້ຈັກ ປີທີ່ຊັດເຈນ ແມ່ນໃຫ້ປະມານ ວັນທີເອົາ:
- ຕໍ່າກວ່າ 10 ປີ ຜ່ານມາ (ມາເຖິງປະຈຸບັນ)
2.7 ການນໍາສະເໜີ ເຕັກໂນໂລຢີ
ໃຫ້ລະບຸ ເຕັກໂນໂລຢີ ໄດ້ຖືກຈັດຕັ້ງປະຕິບັດຄືແນວໃດ?
- ໃນໄລຍະການທົດລອງ / ການຄົ້ນຄວ້າ
3. ການໃຈ້ແຍກ ເຕັກໂນໂລຢີ ໃນການຄຸ້ມຄອງ ດິນແບບຍືນຍົງ
3.1 ຈຸດປະສົງຫຼັກ (ຫຼາຍ) ຂອງເຕັກໂນໂລຢີ
- ຫຼຸດຜ່ອນຄວາມສ່ຽງ ທາງໄພພິບັດທໍາມະຊາດ
- ປັບຕົວຕໍ່ກັບການປ່ຽນແປງດິນຟ້າອາກາດ / ທີ່ຮ້າຍແຮງ ແລະ ຜົນກະທົບ
- ສ້າງຜົນກະທົບ ທາງເສດຖະກິດ ທີ່ເປັນປະໂຫຍດ
3.2 ປະເພດການນໍາໃຊ້ທີ່ດິນ ໃນປະຈຸບັນ() ທີ່ເຕັກໂນໂລຢີ ໄດ້ຖືກນໍາໃຊ້
ທົ່ງຫຍ້າລ້ຽງສັດ
ທົ່ງຫຍ້າລ້ຽງສັດທໍາມະຊາດ:
- ແບບປ່ອຍ ຕາມທຳມະຊາດ
- ແບບເຄິ່ງຂັງ / ເຄິ່ງປ່ອຍ
ຊະນິດພັນສັດຕົ້ນຕໍ ແລະ ຜະລິດຕະພັນ:
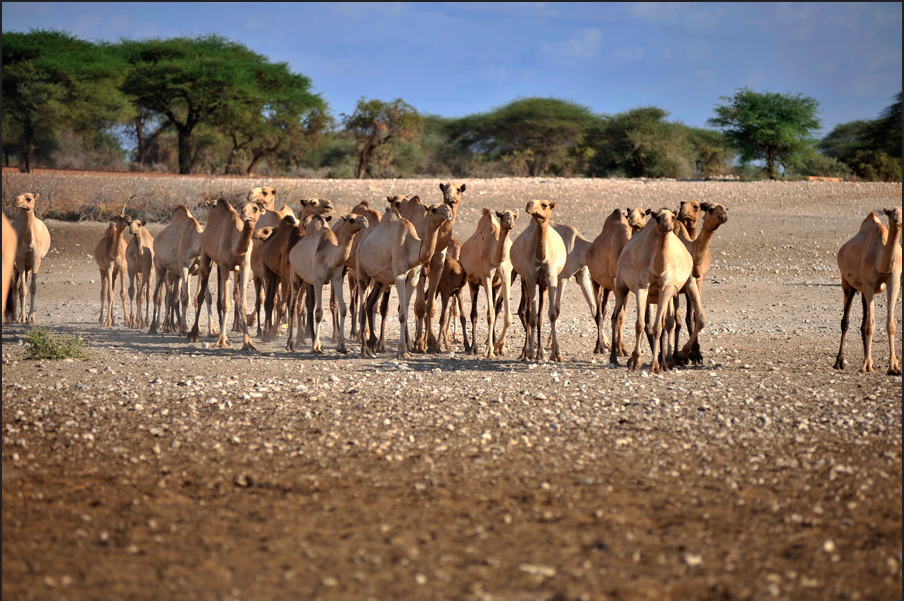
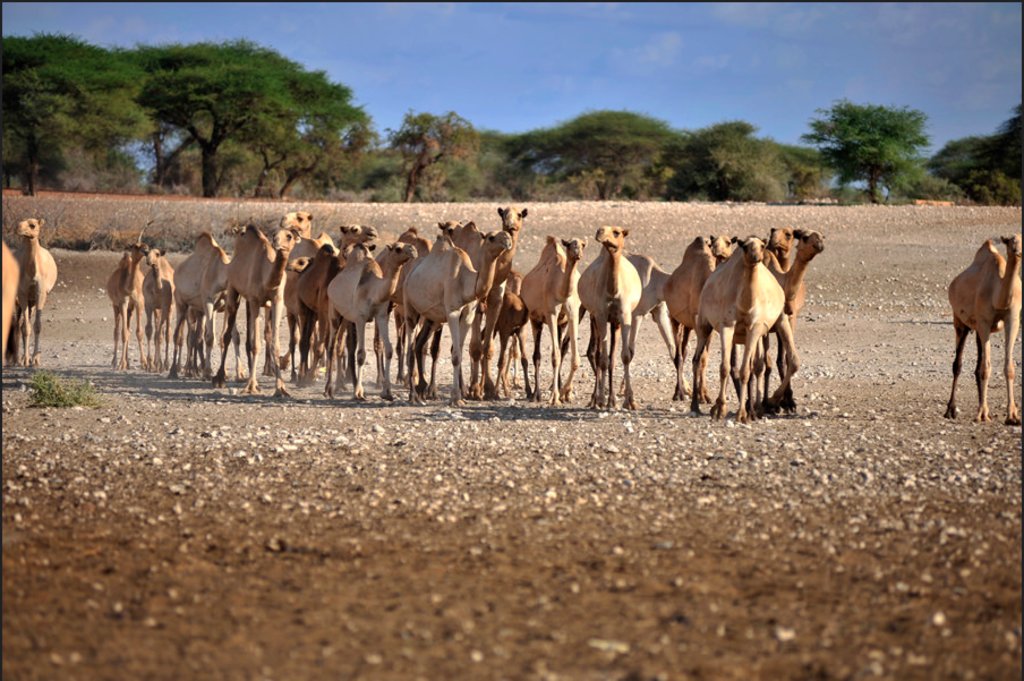
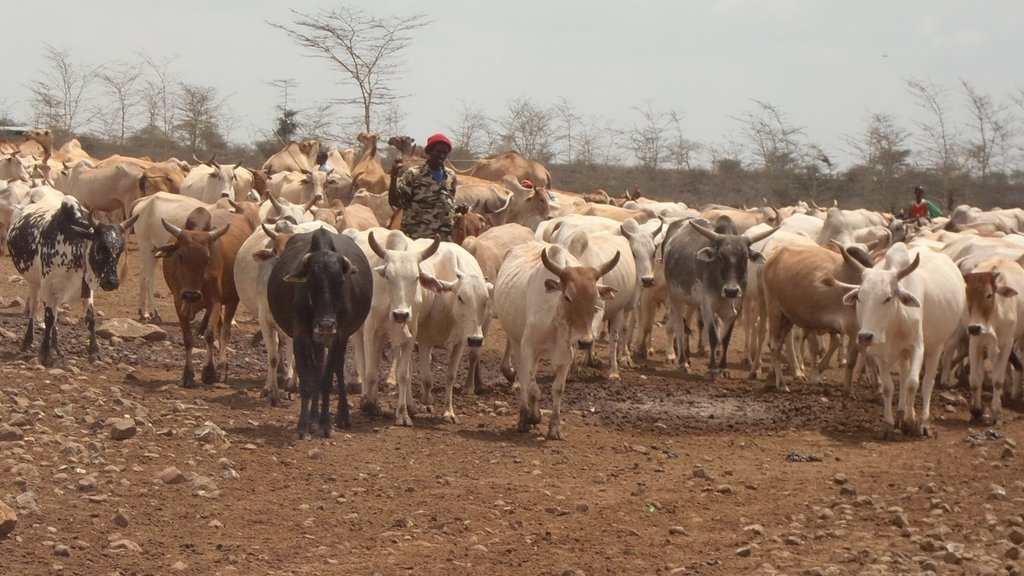
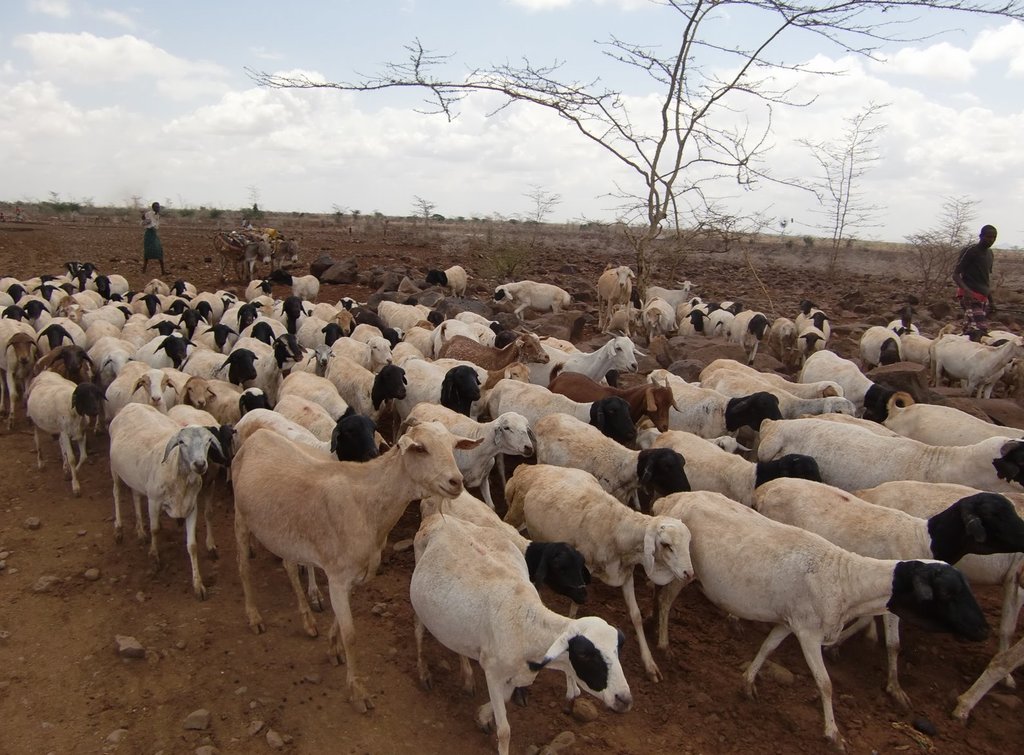
Cattle, Goats, Sheep and Camels.
3.3 ຂໍ້ມູນເພີ່ມເຕີມກ່ຽວກັບການນໍາໃຊ້ທີ່ດິນ
ການສະໜອງນໍ້າ ໃນພື້ນທີ່ ທີ່ໄດ້ນໍາໃຊ້ ເຕັກໂນໂລຢີ:
- ນໍ້າຝົນ
ຈໍານວນ ລະດູການ ປູກໃນປີໜຶ່ງ:
- 2
3.4 ການນໍາໃຊ້ເຕັກໂນໂລຢີ ທີ່ຢູ່ໃນກຸ່ມການຄຸ້ມຄອງ ທີ່ດິນແບບຍືນຍົງ
- ການຄຸ້ມຄອງສັດລ້ຽງ ແລະ ທົ່ງຫຍ້າລ້ຽງສັດ
3.5 ການຂະຫຍາຍເຕັກໂນໂລຢີ
ໃຫ້ລະບຸ ການແຜ່ຂະຫຍາຍ ເຕັກໂນໂລຢີ:
- ແຜ່ຂະຫຍາຍຢ່າງໄວວາໃນພື້ນທີ່
ຖ້າຫາກວ່າ ເຕັກໂນໂລຢີ ໄດ້ແຜ່ຂະຫຍາຍທົ່ວພື້ນທີ່ືື ຢ່າງສະໜ່ຳສະເໝີ, ໃຫ້ລະບຸ ເນື້ອທີ່ ໂດຍການຄາດຄະເນ:
- 100-1,000 ກມ 2
3.6 ມາດຕະການ ການຄຸ້ມຄອງ ທີ່ດິນແບບຍືນຍົງ ປະກອບດ້ວຍ ເຕັກໂນໂລຢີ

ມາດຕະການອື່ນໆ
ຄວາມຄິດເຫັນ:
Providing Index Based Livestock Insurance to pastoralist communities to cushion the cost of keeping their animals alive during severe drought seasons.
3.7 ປະເພດດິນເຊື່ອມໂຊມ ຫຼັກທີ່ໄດ້ນໍາໃຊ້ ເຕັກໂນໂລຢີ

ອື່ນໆ
ຄວາມຄິດເຫັນ:
IBLI mainly addresses the risk of livestock mortality as a result of severe forage scarcity due to drought.
3.8 ການປ້ອງກັນ, ການຫຼຸດຜ່ອນ, ຫຼືການຟື້ນຟູຂອງການເຊື່ອມໂຊມຂອງດິນ
ໃຫ້ລະບຸ ເປົ້າໝາຍ ເຕັກໂນໂລຢີ ທີ່ພົວພັນ ກັບຄວາມເຊື່ອມໂຊມຂອງດິນ:
- ປັບຕົວຕໍ່ການເຊື່ອມໂຊມຂອງດິນ
4. ຂໍ້ກໍາໜົດ, ກິດຈະກໍາການປະຕິບັດ, ວັດຖຸດິບ, ແລະຄ່າໃຊ້ຈ່າຍ
4.1 ເຕັກນິກ ໃນການແຕ້ມແຜນວາດ ເຕັກໂນໂລຢີ
4.2 ການແຕ້ມແຜນວາດອະທິບາຍເຕັກນິກ
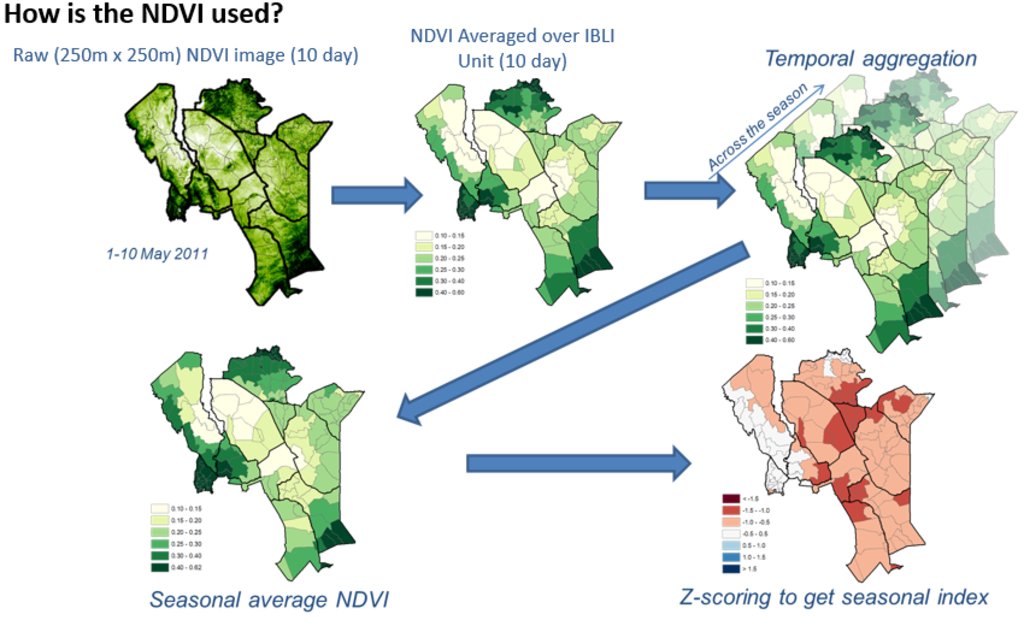
Picture 1 &2: Monthly NDVI for each insured unit in a month is derived by averaging the 10-day NDVI values for each Insured Unit over the three 10-days periods in each month, where the 10-day NDVI value for each Insured Unit is derived by averaging the pixel-level NDVI of all the pixels that fall within the insured unit boundary.
Picture 3: An accumulation of monthly NDVI over the critical months of each season starting from the beginning of the season (March for LRLD and October for SRSD).
Picture 4: There is a representation of a cumulation of monthly NDVI (CumNDVI) which represents the evolution of green vegetation and can be used as a proxy of the green biomass that has developed, and as such a proxy of the available forage across the season.
Picture 5: Deviation of Cumulative NDVI from normal conditions of the particular season and insured unit (ZCumNDVI) - is derived by
subtracting CumNDVI derived for each season and each insured unit by the long-term historical average value and dividing by long-term historical standard deviation of the particular season (SRSD or LRLD) in each
insured unit. ZCumNDVI thus measures the deviation from the historical mean,
expressed as a standard deviation. A positive ZCumNDVI value therefore indicates above normal vegetation cover while negative ZNDVI value indicates below normal vegetation. The purpose of this transformation is to provide an indicator that expresses current forage conditions in comparison to average forage conditions for each specific insurance unit
at the prescribed period within the season.
NOTE: The delineations used in this figure are just for purposes of illustration, assuming Kenya as an entire unit. However, IBLI used smaller delineated units which can be seen in the lines with lighter shade within the map.
5. ສະພາບແວດລ້ອມທໍາມະຊາດ ແລະ ມະນຸດ
5.1 ອາກາດ
ປະລິມານນໍ້າຝົນປະຈໍາປີ
- < 250 ມີລິແມັດ
- 251-500 ມີລິແມັດ
- 501-750 ມີລິແມັດ
- 751-1,000 ມີລິແມັດ
- 1,001-1,500 ມີລິແມັດ
- 1,501-2,000 ມີລິແມັດ
- 2,001-3,000 ມີລິແມັດ
- 3,001-4,000 ມີລິແມັດ
- > 4,000 ມີລິແມັດ
ໃຫ້ລະບຸ ຊື່ສະຖານີ ອຸຕຸນິຍົມ ເພື່ອເປັນຂໍ້ມູນອ້າງອີງ:
Kenya Meteorological Department
ເຂດສະພາບອາກາດກະສິກໍາ
- ເຄິ່ງແຫ້ງແລ້ງ
- ແຫ້ງແລ້ງ
5.2 ພູມິປະເທດ
ຄ່າສະເລ່ຍ ຄວາມຄ້ອຍຊັນ:
- ພື້ນທີ່ຮາບພຽງ (0-2%)
- ອ່ອນ (3-5 %)
- ປານກາງ (6-10 %)
- ມ້ວນ (11-15 %)
- ເນີນ(16-30%)
- ໍຊັນ (31-60%)
- ຊັນຫຼາຍ (>60%)
ຮູບແບບຂອງດິນ:
- ພູພຽງ / ທົ່ງພຽງ
- ສັນພູ
- ເປີ້ນພູ
- ເນີນພູ
- ຕີນພູ
- ຮ່ອມພູ
ເຂດລະດັບສູງ:
- 0-100 ແມັດ a.s.l.
- 101-500 ແມັດ a.s.l.
- 501-1,000 ແມັດ a.s.l.
- 1,001-1,500 ແມັດ a.s.l.
- 1,501-2,000 ແມັດ a.s.l.
- 2,001-2,500 ແມັດ a.s.l.
- 2,501-3,000 ແມັດ a.s.l.
- 3,001-4,000 ແມັດ a.s.l.
- > 4,000 ແມັດ a.s.l.
ໃຫ້ລະບຸ ເຕັກໂນໂລຢີ ທີ່ໄດ້ຖືກນຳໃຊ້:
- ບໍ່ກ່ຽວຂ້ອງ
5.3 ດິນ
ຄວາມເລິກ ຂອງດິນສະເລ່ຍ:
- ຕື້ນຫຼາຍ (0-20 ຊັງຕີແມັດ)
- ຕື້ນ (21-50 ຊຕມ)
- ເລີກປານກາງ (51-80 ຊຕມ)
- ເລິກ (81-120 ຊມ)
- ເລິກຫຼາຍ (> 120 cm)
ເນື້ອດິນ (ໜ້າດິນ):
- ຫຍາບ / ເບົາ (ດິນຊາຍ)
ເນື້ອດິນ (ເລິກຈາກໜ້າດິນ ລົງໄປຫຼາຍກວ່າ 20 ຊັງຕິແມັດ):
- ຫຍາບ / ເບົາ (ດິນຊາຍ)
ຊັ້ນອິນຊີວັດຖຸ ເທິງໜ້າດິນ:
- ຕໍາ່ (<1 %)
5.4 ມີນໍ້າ ແລະ ຄຸນນະພາບ
ລະດັບ ນໍ້າໃຕ້ດິນ:
< 5 ແມັດ
ການມີນໍ້າ ເທິງໜ້າດິນ:
ທຸກຍາກ / ບໍ່ມີ
ຄຸນນະພາບນໍ້າ (ບໍ່ມີການບໍາບັດ):
ບໍ່ມີນໍ້າດື່ມ (ຮຽກຮ້ອງໃຫ້ມີການບຳບັດນ້ຳ)
ມີບັນຫາ ກ່ຽວກັບນໍ້າເຄັມບໍ່?
ແມ່ນ
ເກີດມີນໍ້າຖ້ວມ ໃນພື້ນທີ່ບໍ່?
ບໍ່ແມ່ນ
5.5 ຊີວະນາໆພັນ
ຄວາມຫຼາກຫຼາຍ ທາງສາຍພັນ:
- ປານກາງ
ຄວາມຫຼາກຫຼາຍ ທາງດ້ານ ທີ່ຢູ່ອາໃສ ຂອງສິ່ງທີ່ມີຊີວິດ:
- ປານກາງ
5.6 ຄຸນລັກສະນະ ຂອງຜູ້ນໍາໃຊ້ທີ່ດິນ ທີ່ໄດ້ນໍາໃຊ້ເຕັກໂນໂລຢີ
ຢູ່ປະຈຳ ຫຼື ເຄື່ອນຍ້າຍຕະຫຼອດ:
- ແບບປ່ອຍຕາມທຳມະຊາດ
ລະບົບ ການຕະຫຼາດ ແລະ ຜົນຜະລິດ:
- ປະສົມ (ກຸ້ມຕົນເອງ / ເປັນສິນຄ້າ
ລາຍຮັບ ທີ່ບໍ່ໄດ້ມາຈາກ ການຜະລິດ ກະສິກໍາ:
- ໜ້ອຍກ່ວາ 10 % ຂອງລາຍຮັບທັງໝົດ
ລະດັບຄວາມຮັ່ງມີ:
- ສະເລ່ຍ
ບຸກຄົນ ຫຼື ກຸ່ມ:
- ບຸກຄົນ / ຄົວເຮືອນ
ເພດ:
- ຜູ້ຍິງ
- ຜູ້ຊາຍ
ອາຍຸ ຂອງຜູ້ນໍາໃຊ້ທີ່ດິນ:
- ໄວກາງຄົນ
- ຜູ້ສູງອາຍຸ
5.7 ພື້ນທີ່ສະເລ່ຍຂອງທີ່ດິນ ຫຼື ເຊົ່າໂດຍຜູ້ໃຊ້ທີ່ດິນການນໍາໃຊ້ ເຕັກໂນໂລຢີ
- <0.5 ເຮັກຕາ
- 0.5-1 ເຮັກຕາ
- 1-2 ເຮັກຕາ
- 2-5 ເຮັກຕາ
- 5-15 ເຮັກຕາ
- 15-50 ເຮັກຕາ
- 50-100 ເຮັກຕາ
- 100-500 ເຮັກຕາ
- 500-1,000 ເຮັກຕາ
- 1,000-10,000 ເຮັກຕາ
- > 10,000 ເຮັກຕາ
ຄວາມຄິດເຫັນ:
Most land is communal.
5.8 ເຈົ້າຂອງທີ່ດິນ, ສິດໃຊ້ທີ່ດິນ, ແລະ ສິດທິການນໍາໃຊ້ນໍ້າ
ເຈົ້າຂອງດິນ:
- ຊຸມຊົນ / ບ້ານ
ສິດທິ ໃນການນໍາໃຊ້ທີ່ດິນ:
- ຊຸມຊົນ (ທີ່ມີການຈັດຕັ້ງ)
ສິດທິ ໃນການນໍາໃຊ້ນໍ້າ:
- ຊຸມຊົນ (ທີ່ມີການຈັດຕັ້ງ)
5.9 ການເຂົ້າເຖິງການບໍລິການ ແລະ ພື້ນຖານໂຄງລ່າງ
ສຸຂະພາບ:
- ທຸກຍາກ
- ປານກາງ
- ດີ
ການສຶກສາ:
- ທຸກຍາກ
- ປານກາງ
- ດີ
ການຊ່ວຍເຫຼືອ ດ້ານວິຊາການ:
- ທຸກຍາກ
- ປານກາງ
- ດີ
ການຈ້າງງານ (ຕົວຢ່າງ, ການເຮັດກິດຈະກໍາອື່ນ ທີ່ບໍ່ແມ່ນ ການຜະລິດກະສິກໍາ):
- ທຸກຍາກ
- ປານກາງ
- ດີ
ຕະຫຼາດ:
- ທຸກຍາກ
- ປານກາງ
- ດີ
ພະລັງງານ:
- ທຸກຍາກ
- ປານກາງ
- ດີ
ຖະໜົນຫົນທາງ ແລະ ການຂົນສົ່ງ:
- ທຸກຍາກ
- ປານກາງ
- ດີ
ການດື່ມນໍ້າ ແລະ ສຸຂາພິບານ:
- ທຸກຍາກ
- ປານກາງ
- ດີ
6. ຜົນກະທົບ ແລະ ລາຍງານສະຫຼຸບ
6.1 ການສະແດງຜົນກະທົບ ພາຍໃນພື້ນທີ່ ທີ່ໄດ້ຈັດຕັ້ງປະຕິບັດ ເຕັກໂນໂລຢີ
ຜົນກະທົບດ້ານວັດທະນາທໍາສັງຄົມ
ການຄໍ້າປະກັນ ສະບຽງອາຫານ / ກຸ້ມຢູ່ກຸ້ມກິນ
ສະຖານະການຂອງສັງຄົມ ແລະ ກຸ່ມດ້ອຍໂອກາດທາງເສດຖະກິດ
ຜົນກະທົບຕໍ່ລະບົບນິເວດ
ການຫຼຸດຜ່ອນ ຄວາມສ່ຽງ ຈາກໄພພິບັດ ແລະ ອາກາດປ່ຽນແປງ
ຜົນກະທົບ ຂອງໄພແຫ້ງແລ້ງ
6.2 ຜົນກະທົບທາງອ້ອມ ຈາກການນໍາໃຊ້ເຕັກໂນໂລຢີ
Reduction of livestock mortality as a result of forage scarcity due to drought.
6.3 ການປ້ອງກັນ ແລະ ຄວາມບອບບາງ ຂອງເຕັກໂນໂລຢິ ໃນການປ່ຽນແປງສະພາບດິນຟ້າອາກາດ ແລະ ກ່ຽວຂ້ອງກັບອາກາດທີ່ມີການປ່ຽນແປງທີ່ຮຸນແຮງ / ໄພພິບັດທາງທໍາມະຊາດ (ຮັບຮູ້ໄດ້ໂດຍຜູ້ນໍາໃຊ້ທີ່ດິນ)
ການປ່ຽນແປງດິນຟ້າອາກາດ ເທື່ອລະກ້າວ
ການປ່ຽນແປງດິນຟ້າອາກາດ ເທື່ອລະກ້າວ
| ລະດູການ | ຮູບແບບ ການປ່ຽນແປງດິນຟ້າອາກາດ / ທີ່ຮ້າຍແຮງ | ການນໍາໃຊ້ ເຕັກໂນໂລຢີ ສາມາດ ຮັບມື ໄດ້ຄືແນວໃດ? | |
|---|---|---|---|
| ປະລິມານນໍ້າຝົນປະຈໍາປີ | ຫຼຸດລົງ | ປານກາງ |
ອາກາດ ທີ່ກ່ຽວພັນກັບຄວາມຮຸນແຮງ (ໄພພິບັດທາງທໍາມະຊາດ)
ໄພພິບັດທາງພູມອາກາດ
| ການນໍາໃຊ້ ເຕັກໂນໂລຢີ ສາມາດ ຮັບມື ໄດ້ຄືແນວໃດ? | |
|---|---|
| ແຫ້ງແລ້ງ | ດີ |
ອາກາດ ທີ່ກ່ຽວພັນກັບຄວາມຮຸນແຮງອື່ນໆ (ໄພພິບັດທາງທໍາມະຊາດ)
| ອື່ນໆ (ລະບຸແຈ້ງ) | ການນໍາໃຊ້ ເຕັກໂນໂລຢີ ສາມາດ ຮັບມື ໄດ້ຄືແນວໃດ? |
|---|---|
| Forage scarcity | ດີ |
6.4 ການວິເຄາະຕົ້ນທຶນ ແລະ ຜົນປະໂຫຍດ
ຈະເຮັດປະໂຫຍດເພື່ອປຽບທຽບກັບຄ່າໃຊ້ຈ່າຍກັບສິ່ງກໍ່ສ້າງ (ຈາກທັດສະນະຂອງຜູ້ນຳໃຊ້ທີ່ດິນ) ໄດ້ແນວໃດ?
ຜົນຕອບແທນ ໃນໄລຍະສັ້ນ:
ຜົນກະທົບທາງບວກເລັກນ້ອຍ
ຜົນຕອບແທນ ໃນໄລຍະຍາວ:
ຜົນກະທົບທາງບວກ
ຈະໄດ້ຮັບຜົນປະໂຫຍດເມື່ອປຽບທຽບກັບ / ຄ່າໃຊ້ຈ່າຍໃນການບຳລຸງຮັກສາທີເ່ກີດຂື້ນອິກ (ຈາກທັດສະນະຄະຕິຂອງຜູ້ນຳໃຊ້ທີ່ດິນ) ໄດ້ແນວໃດ?
ຜົນຕອບແທນ ໃນໄລຍະສັ້ນ:
ຜົນກະທົບທາງບວກ
ຜົນຕອບແທນ ໃນໄລຍະຍາວ:
ຜົນກະທົບທາງບວກ
6.5 ການປັບຕົວຮັບເອົາເຕັກໂນໂລຢີ
- 10-50%
ຖ້າຫາກວ່າມີ, ປະລິມານ (ຈໍານວນຂອງຄົວເຮືອນ / ເນື້ອທີ່ການຄຸ້ມຄອງ):
over 25,000 households
ທັງໝົດນັ້ນ ແມ່ນໃຜ ທີ່ເປັນຜູ້ປັບຕົວ ໃນການນໍາໃຊ້ ເຕັກໂນໂລຢີ, ມີຈັກຄົນ ທີ່ສາມາດເຮັດເອງໄດ້, ຕົວຢ່າງ, ປາດສະຈາກ ການຊ່ວຍເຫຼືອ ທາງດ້ານອຸປະກອນ / ການຈ່າຍເປັນເງິນ?
- 10-50%
6.6 ການປັບຕົວ
ໄດ້ມີການດັດປັບ ເຕັກໂນໂລຢີ ເພື່ອໃຫ້ແທດເໝາະກັບເງື່ອນໄຂ ການປ່ຽນແປງບໍ?
ບໍ່ແມ່ນ
6.7 ຈຸດແຂງ / ຂໍ້ດີ / ໂອກາດ ໃນການນໍາໃຊ້ ເຕັກໂນໂລຢີ
| ຈຸດແຂງ / ຂໍ້ດີ / ໂອກາດໃນການນໍາໃຊ້ທີ່ດິນ |
|---|
| The use NDVI for forage monitoring in provision of IBLI eliminates the high costs of loss verification which would otherwise be expensive and consuming in the case of vast and remote ASALs of Kenya. |
| ຈຸດແຂງ / ຈຸດດີ / ໂອກາດ ຈາກທັດສະນະຂອງຜູ້ປ້ອນຂໍ້ມູນ ຫຼື ບຸກຄົນສຳຄັນ |
|---|
| IBLI contract design is based on robust scientific design which is easily verifiable hence boosting trust in the product. |
6.8 ຈຸດອ່ອນ / ຂໍ້ເສຍ / ຄວາມສ່ຽງ ໃນການນໍາໃຊ້ ເຕັກໂນໂລຢີ ແລະ ວິທີການແກ້ໄຂບັນຫາ
| ຈຸດອ່ອນ / ຂໍ້ເສຍ / ຄວາມສ່ຽງໃນມຸມມອງຂອງຜູ້ນໍາໃຊ້ທີ່ດິນ | ມີວິທີການແກ້ໄຂຄືແນວໃດ? |
|---|---|
| A key concern of index-insurance products is that there might occur variances in perceived loss versus the actual payouts (basis risk) | Proper contract design should be backed with ground truthing efforts together with awareness creation. |
| ຈຸດອ່ອນ/ຂໍ້ບົກຜ່ອງ/ຄວາມສ່ຽງ ຈາກທັດສະນະຂອງຜູ້ປ້ອນຂໍ້ມູນ ຫຼື ບຸກຄົນສຳຄັນ | ມີວິທີການແກ້ໄຂຄືແນວໃດ? |
|---|---|
| Basis risk is a weakness with IBLI as they could arise differences in perceived level of forage scarcity by the clients, | vis a vis the index trigger level indicated by the NDVI data. Increased precision in contract design alongside proper capacity and awareness creation to the pastoralists can help mitigate this challenge. |
7. ເອກະສານອ້າງອີງ ແລະ ການເຊື່ອມຕໍ່
7.1 ວິທີການ / ແຫຼ່ງຂໍ້ມູນ
- ການລວບລວມ ບົດລາຍງານ ແລະ ເອກະສານ ອື່ນໆ ທີ່ມີຢູ່ແລ້ວ
7.2 ເອກກະສານອ້າງອີງທີ່ເປັນບົດລາຍງານ
ຫົວຂໍ້, ຜູ້ຂຽນ, ປີ, ISBN:
Chelang'a et. al 2017
ຫົວຂໍ້, ຜູ້ຂຽນ, ປີ, ISBN:
Tucker et al., 2005
7.3 ສາມາດເຊື່ອມໂຍງ ຂໍ້ມູນຂ່າວສານ ໄດ້ໂດຍຜ່ານການອອນລາຍ
ຫົວຂໍ້ / ພັນລະນາ:
IBLI website
URL:
https://ibli.ilri.org/
ຂໍ້ມູນການເຊື່ອມຕໍ່ ແລະ ເນື້ອໃນ
ຂະຫຍາຍທັງໝົດ ຍຸບທັງໝົດການເຊື່ອມຕໍ່
ບໍ່ມີຂໍ້ມູນການເຊື່ອມຕໍ່
ເນື້ອໃນ
ບໍ່ມີເນື້ອໃນ


