Index Based Livestock Insurance [เคนยา]
- ผู้สร้างสรรค์:
- การอัพเดท:
- ผู้รวบรวม: Duncan Collins Khalai
- ผู้เรียบเรียง: –
- ผู้ตรวจสอบ: Rima Mekdaschi Studer
IBLI
technologies_3361 - เคนยา
- บทสรุปทั้งหมดในรูปแบบของ PDF
- บทสรุปทั้งหมดในรูปแบบของ PDF เพื่อพิมพ์
- บทสรุปทั้งหมดในรูปหน้าเว็บ
- บทสรุปทั้งหมด (ไม่มีการจัดเรียง)
- Index Based Livestock Insurance: 9 พฤษภาคม 2019 (inactive)
- Index Based Livestock Insurance: 3 กันยายน 2018 (inactive)
- Index Based Livestock Insurance: 2 พฤศจิกายน 2021 (public)
- Index Based Livestock Insurance: 7 มิถุนายน 2018 (inactive)
- Index Based Livestock Insurance: 13 พฤษภาคม 2018 (inactive)
- Index Based Livestock Insurance: 25 มกราคม 2018 (inactive)
ดูส่วนย่อย
ขยายทั้งหมด ย่อทั้งหมด1. ข้อมูลทั่วไป
1.2 รายละเอียดที่ติดต่อได้ของผู้รวบรวมและองค์กรที่เกี่ยวข้องในการประเมินและการจัดเตรียมทำเอกสารของเทคโนโลยี
วิทยากรหลัก
ผู้เชี่ยวชาญ SLM:
ชื่อของโครงการซึ่งอำนวยความสะดวกในการทำเอกสารหรือการประเมินเทคโนโลยี (ถ้าเกี่ยวข้อง)
Index Based Livestock Insurance, Kenya (IBLI)ชื่อขององค์กรซึ่งอำนวยความสะดวกในการทำเอกสารหรือการประเมินเทคโนโลยี (ถ้าเกี่ยวข้อง)
ILRI International Livestock Research Institute (ILRI) - เคนยา1.3 เงื่อนไขการใช้ข้อมูลที่ได้บันทึกผ่านทาง WOCAT
วันที่เก็บรวบรวมข้อมูล(ภาคสนาม) :
24/01/2018
ผู้รวบรวมและวิทยากรหลักยอมรับเงื่อนไขเกี่ยวกับการใช้ข้อมูลที่ถูกบันทึกผ่านทาง WOCAT:
ใช่
1.4 การเปิดเผยเรื่องความยั่งยืนของเทคโนโลยีที่ได้อธิบายไว้
เทคโนโลยีที่ได้อธิบายไว้นี้เป็นปัญหาของความเสื่อมโทรมโทรมของที่ดินหรือไม่ จึงไม่ได้รับการยอมรับว่าเป็นเทคโนโลยีเพื่อการจัดการที่ดินอย่างยั่งยืน:
ไม่ใช่
2. การอธิบายลักษณะของเทคโนโลยี SLM
2.1 การอธิบายแบบสั้น ๆ ของเทคโนโลยี
คำจำกัดความของเทคโนโลยี:
Index-Based Livestock Insurance (IBLI) is a product that was designed to help protect pastoralists and their livestock against the effects of prolonged forage scarcity. IBLI triggers payment to pastoralists when the forage situation deteriorates to levels considered to be severe, as compared to historical conditions over time.
2.2 การอธิบายแบบละเอียดของเทคโนโลยี
คำอธิบาย:
In the event of severe seasonal drought, forage and grazing resources are depleted and livestock may die because of starvation. Index Based Livestock Insurance (IBLI) is the technology applied in the provision of forage based livestock (asset) protection insurance. IBLI uses Normalized Difference Vegetation Index (NDVI), a satellite-derived indicator of the amount and vigor of vegetation, based on the observed level of photosynthetic activity (Tucker et al., 2005). NDVI is derived from 10-day composites of 250m filtered eMODIS processed by the United States’ National Aeronautics and Space Administration (NASA) and transformed by The Earth Resources Observation Systems (EROS) Data Center (EDC) of the US Geological Survey (USGS). NDVI data from the AQUA satellite platform are available from July 2002 to present at https://lta.cr.usgs.gov/emodis.
In the case of IBLI, the index is a deviation of cumulative forage availability (ZCumNDVI) in the insured season. It measures forage conditions over a defined time period and compares the observed NDVI over a particular season, with the observed NDVI over a given historical period (e.g. 15 years). A set threshold below which payouts must be made is called the trigger level. Therefore, when the forage situation in a given season is worse than the 20th worst season in the last 15 years, a payout is triggered. In other words, IBLI will compensate if the forage conditions fall below the worst 20th percentile of seasonal pasture levels cumulated over the historical drought seasons in the past 15 years. IBLI therefore uses the satellite-based vegetation index to measure forage availability and to trigger timely payouts to pastoralists based on the costs of providing supplementary feeds to the animals for the specific season that a drought is triggered.
For precision and proper administration each insured county is broken down into smaller units of insurance which are referred to as Unit Areas of Insurance (UAIs). Each UAI represents a geographical area whose forage availability index data are aggregated as one unit for insurance purposes. The identification of the geographic areas that constitute UAIs is a key step in IBLI contract design because the use of average NDVI over insurable units is based on the premise that drought is a covariate shock and that pastoral communities affected in a particular area are deemed to suffer in equal measure.Thus, for accuracy and acceptability, the index should be tightly correlated with forage scarcity and reflect relative conditions on the ground. Also forage access should be relatively homogeneous for herders residing in the same insurable unit. The process of demarcating UAIs is known as clustering. It is done through a combination of active participatory community engagement and scientific methods .
Insured pastoralists are not always paid when there is drought. They are only paid when drought is so severe that the amount of forage falls below the strike level. Insured pastoralists will not receive payments if the forage availability is more than the strike level. This is an annual policy which covers forage availability as measured by satellite Normalized Difference Vegetation Index (NDVI) in up to 2 rainy seasons as per the bimodal rain patterns in Kenya. Pastoralists who do not hold insurance contracts are not covered by under, and therefore do not receive payments, even if they live in the same UAIs as the ones who have insured their livestock.
2.3 รูปภาพของเทคโนโลยี
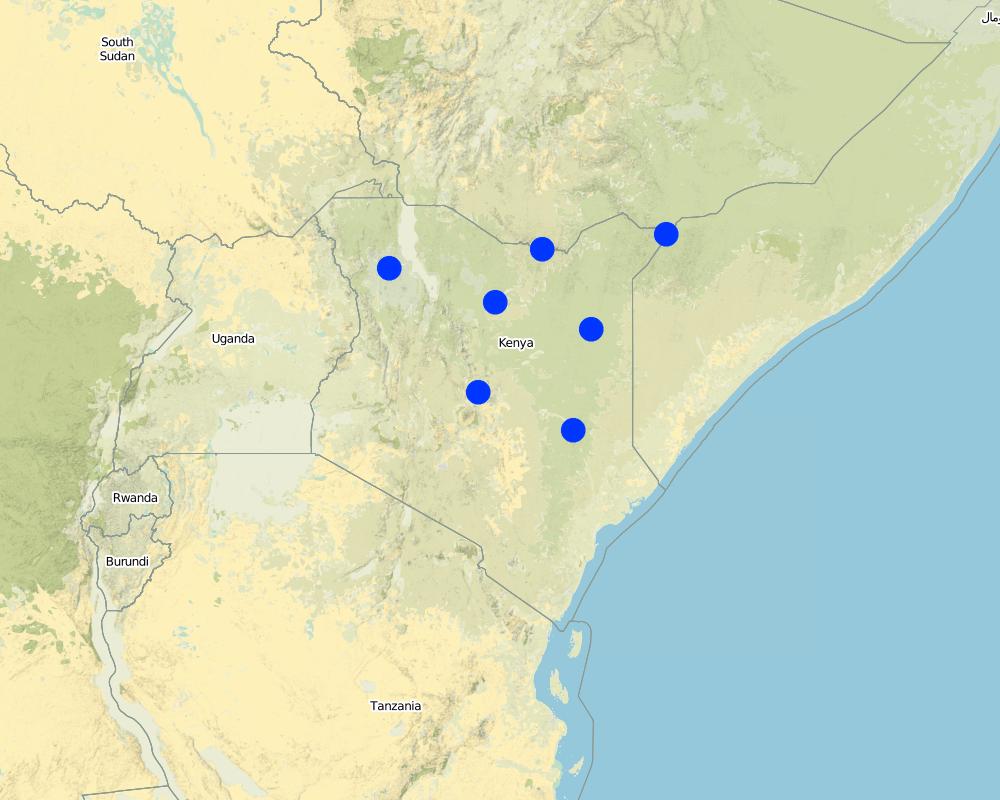
2.5 ประเทศภูมิภาค หรือสถานที่ตั้งที่เทคโนโลยีได้นำไปใช้และได้รับการครอบคลุมโดยการประเมินนี้
ประเทศ:
เคนยา
Map
×2.6 วันที่การดำเนินการ
ถ้าไม่รู้ปีที่แน่นอน ให้ระบุวันที่โดยประมาณ:
- น้อยกว่า 10 ปี (ไม่นานนี้)
2.7 คำแนะนำของเทคโนโลยี
ให้ระบุว่าเทคโนโลยีถูกแนะนำเข้ามาอย่างไร:
- ในช่วงการทดลองหรือการทำวิจัย
3. การจัดประเภทของเทคโนโลยี SLM
3.1 วัตถุประสงค์หลักของเทคโนโลยี
- ลดความเสี่ยงของภัยพิบัติ
- ปรับตัวเข้ากับการเปลี่ยนแปลงภูมิอากาศของโลก สภาพภูมิอากาศที่รุนแรงและผลกระทบ
- สร้างผลกระทบทางด้านเศรษฐกิจที่เป็นประโยชน์
3.2 ประเภทของการใช้ที่ดินในปัจจุบันที่ได้นำเทคโนโลยีไปใช้
ทุ่งหญ้าเลี้ยงสัตว์
ทุ่งหญ้าเลี้ยงสัตว์ที่ใช้พื้นที่กว้าง:
- การเลี้ยงสัตว์แบบเร่ร่อนไปตามที่ต่าง ๆ (Nomadism)
- กึ่งเร่ร่อน / อาจมีการทำทุ่งหญ้าเลี้ยงสัตว์ร่วมด้วย (Semi-nomadism/ pastoralism)
ชนิดพันธุ์สัตว์และผลิตภัณฑ์หลัก:
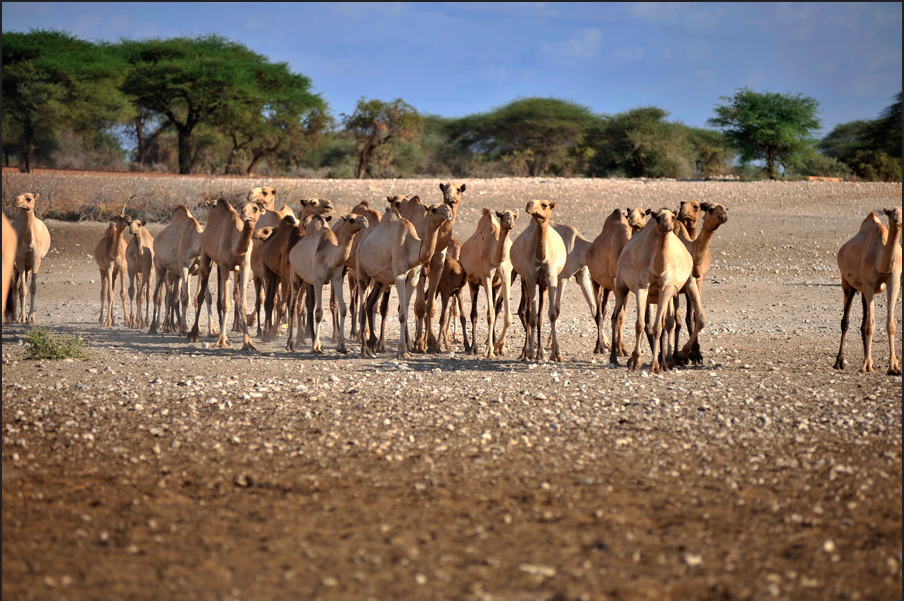
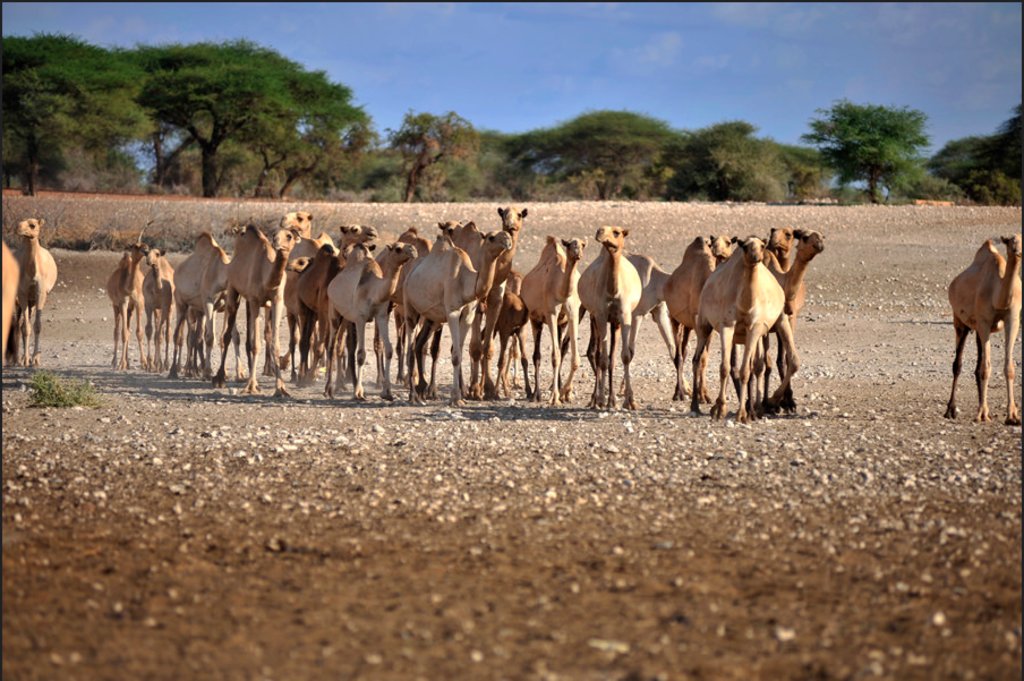
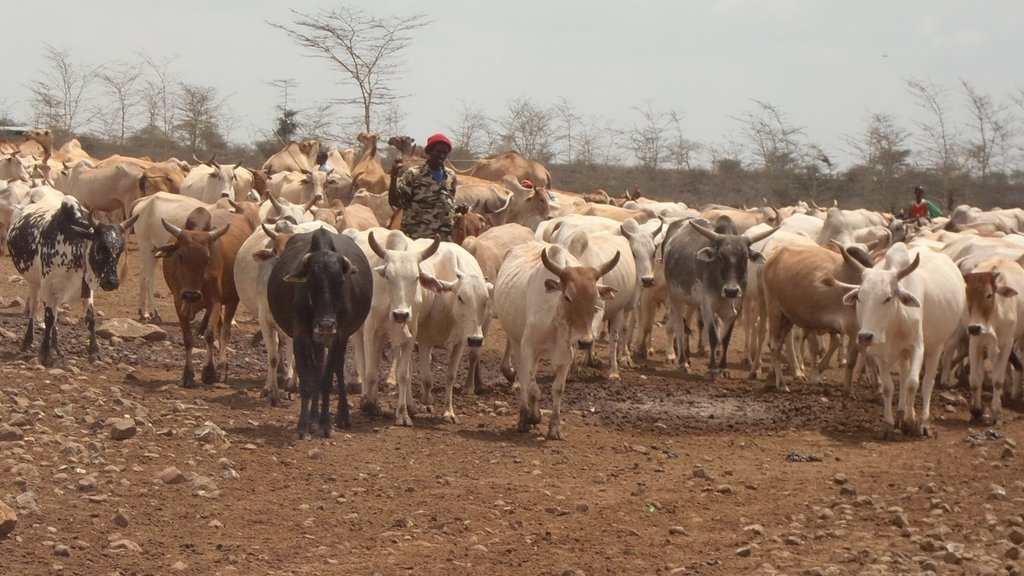
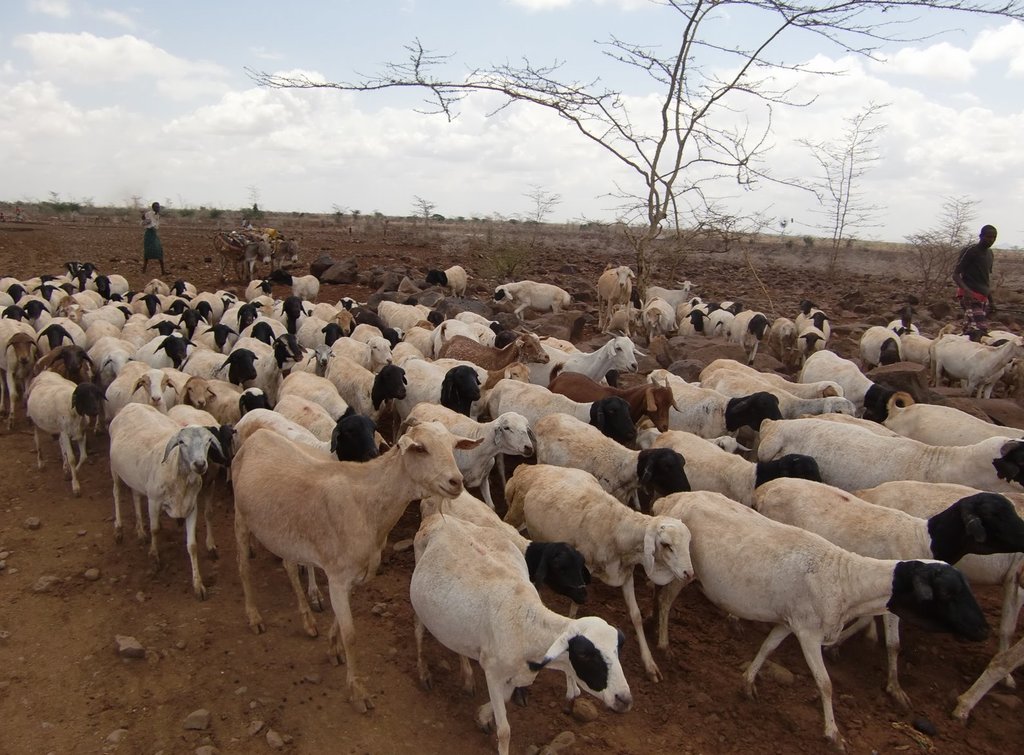
Cattle, Goats, Sheep and Camels.
3.3 ข้อมูลเพิ่มเติมเกี่ยวกับการใช้ที่ดิน
การใช้น้ำของที่ดินที่มีการใช้เทคโนโลยีอยู่:
- จากน้ำฝน
จำนวนของฤดูเพาะปลูกต่อปี:
- 2
3.4 กลุ่ม SLM ที่ตรงกับเทคโนโลยีนี้
- การจัดการปศุสัตว์และทุ่งหญ้าเลี้ยงสัตว์
3.5 กระจายตัวของเทคโนโลยี
ระบุการกระจายตัวของเทคโนโลยี:
- กระจายไปอย่างสม่ำเสมอในพื้นที่
ถ้าหากว่าเทคโนโลยีได้มีการกระจายออกไปอย่างสม่ำเสมอในพื้นที่ ให้ระบุปริมาณพื้นที่ที่ได้รับการครอบคลุมถึง:
- 100-1,000 ตร.กม.
3.6 มาตรการ SLM ที่ประกอบกันเป็นเทคโนโลยี

มาตรการอื่น ๆ
3.7 รูปแบบหลักของการเสื่อมโทรมของที่ดินที่ได้รับการแก้ไขโดยเทคโนโลยี

อื่น ๆ
3.8 การป้องกัน การลดลง หรือการฟื้นฟูความเสื่อมโทรมของที่ดิน
ระบุเป้าหมายของเทคโนโลยีกับความเสื่อมโทรมของที่ดิน:
- ปรับตัวกับสภาพความเสื่อมโทรมของที่ดิน
4. ข้อมูลจำเพาะด้านเทคนิค กิจกรรมการนำไปปฏิบัติใช้ ปัจจัยนำเข้า และค่าใช้จ่าย
4.1 แบบแปลนทางเทคนิคของเทคโนโลยี
4.2 ข้อมูลจำเพาะด้านเทคนิคและการอธิบายแบบแปลนทางเทคนิค
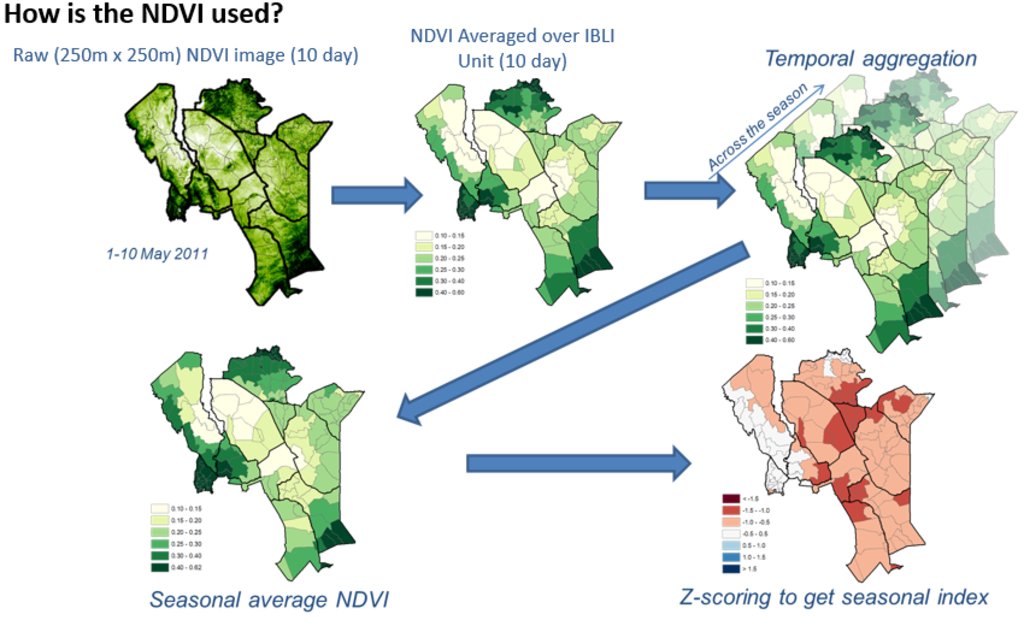
Picture 1 &2: Monthly NDVI for each insured unit in a month is derived by averaging the 10-day NDVI values for each Insured Unit over the three 10-days periods in each month, where the 10-day NDVI value for each Insured Unit is derived by averaging the pixel-level NDVI of all the pixels that fall within the insured unit boundary.
Picture 3: An accumulation of monthly NDVI over the critical months of each season starting from the beginning of the season (March for LRLD and October for SRSD).
Picture 4: There is a representation of a cumulation of monthly NDVI (CumNDVI) which represents the evolution of green vegetation and can be used as a proxy of the green biomass that has developed, and as such a proxy of the available forage across the season.
Picture 5: Deviation of Cumulative NDVI from normal conditions of the particular season and insured unit (ZCumNDVI) - is derived by
subtracting CumNDVI derived for each season and each insured unit by the long-term historical average value and dividing by long-term historical standard deviation of the particular season (SRSD or LRLD) in each
insured unit. ZCumNDVI thus measures the deviation from the historical mean,
expressed as a standard deviation. A positive ZCumNDVI value therefore indicates above normal vegetation cover while negative ZNDVI value indicates below normal vegetation. The purpose of this transformation is to provide an indicator that expresses current forage conditions in comparison to average forage conditions for each specific insurance unit
at the prescribed period within the season.
NOTE: The delineations used in this figure are just for purposes of illustration, assuming Kenya as an entire unit. However, IBLI used smaller delineated units which can be seen in the lines with lighter shade within the map.
5. สิ่งแวดล้อมทางธรรมชาติและของมนุษย์
5.1 ภูมิอากาศ
ฝนประจำปี
- < 250 ม.ม.
- 251-500 ม.ม.
- 501-750 ม.ม.
- 751-1,000 ม.ม.
- 1,001-1,500 ม.ม.
- 1,501-2,000 ม.ม.
- 2,001-3,000 ม.ม.
- 3,001-4,000 ม.ม.
- > 4,000 ม.ม.
ระบุชื่อของสถานีตรวดวัดอากาศที่ใช้อ้างอิงคือ:
Kenya Meteorological Department
เขตภูมิอากาศเกษตร
- กึ่งแห้งแล้ง
- แห้งแล้ง
5.2 สภาพภูมิประเทศ
ค่าเฉลี่ยความลาดชัน:
- ราบเรียบ (0-2%)
- ลาดที่ไม่ชัน (3-5%)
- ปานกลาง (6-10%)
- เป็นลูกคลื่น (11-15%)
- เป็นเนิน (16-30%)
- ชัน (31-60%)
- ชันมาก (>60%)
ธรณีสัณฐาน:
- ที่ราบสูง/ที่ราบ
- สันเขา
- ไหล่เขา
- ไหล่เนินเขา
- ตีนเนิน
- หุบเขา
ระดับความสูง:
- 0-100 เมตร
- 101-500 เมตร
- 501-1,000 เมตร
- 1,001-1,500 เมตร
- 1,501-2,000 เมตร
- 2,001-2,500 เมตร
- 2,501-3,000 เมตร
- 3,001-4,000 เมตร
- > 4,000 เมตร
ให้ระบุถ้าเทคโนโลยีได้ถูกนำไปใช้:
- ไม่เกี่ยวข้อง
5.3 ดิน
ค่าเฉลี่ยความลึกของดิน:
- ตื้นมาก (0-20 ซ.ม.)
- ตื้น (21-50 ซ.ม.)
- ลึกปานกลาง (51-80 ซ.ม.)
- ลึก (81-120 ซ.ม.)
- ลึกมาก (>120 ซ.ม.)
เนื้อดิน (ดินชั้นบน):
- หยาบ/เบา (ดินทราย)
เนื้อดินล่าง (> 20 ซ.ม.ต่ำจากผิวดิน):
- หยาบ/เบา (ดินทราย)
อินทรียวัตถุในดิน:
- ต่ำ (<1%)
5.4 ความเป็นประโยชน์และคุณภาพของน้ำ
ระดับน้ำใต้ดิน:
<5 เมตร
น้ำไหลบ่าที่ผิวดิน:
ไม่ดีหรือไม่มีเลย
คุณภาพน้ำ (ที่ยังไม่ได้บำบัด):
เป็นน้ำเพื่อการดื่มที่ไม่ดี (จำเป็นต้องได้รับการบำบัด)
ความเค็มของน้ำเป็นปัญหาหรือไม่:
ใช่
กำลังเกิดน้ำท่วมในพื้นที่หรือไม่:
ไม่ใช่
5.5 ความหลากหลายทางชีวภาพ
ความหลากหลายทางชนิดพันธุ์:
- ปานกลาง
ความหลากหลายของแหล่งที่อยู่:
- ปานกลาง
5.6 ลักษณะของผู้ใช้ที่ดินที่นำเทคโนโลยีไปปฏิบัติใช้
อยู่กับที่หรือเร่ร่อน:
- เร่ร่อน
แนวทางการตลาดของระบบการผลิต:
- ผสม (การเลี้ยงชีพ/ทำการค้า)
รายได้ที่มาจากนอกฟาร์ม:
- < 10% ของรายได้ทั้งหมด
ระดับของความมั่งคั่งโดยเปรียบเทียบ:
- พอมีพอกิน
เป็นรายบุคคล/ครัวเรือน:
- เป็นรายบุคคล/ครัวเรือน
เพศ:
- หญิง
- ชาย
อายุของผู้ใช้ที่ดิน:
- วัยกลางคน
- ผู้สูงอายุ
5.7 พื้นที่เฉลี่ยของที่ดินที่เป็นเจ้าของหรือเช่าโดยผู้ใช้ที่ดินที่นำเทคโนโลยีไปปฏิบัติใช้
- < 0.5 เฮกตาร์
- 0.5-1 เฮกตาร์
- 1-2 เฮกตาร์
- 2-5 เฮกตาร์
- 5-15 เฮกตาร์
- 15-50 เฮกตาร์
- 50-100 เฮกตาร์
- 100-500 เฮกตาร์
- 500-1,000 เฮกตาร์
- 1,000-10,000 เฮกตาร์
- >10,000 เฮกตาร์
แสดงความคิดเห็น:
Most land is communal
5.8 กรรมสิทธิ์ในที่ดิน สิทธิในการใช้ที่ดินและสิทธิในการใช้น้ำ
กรรมสิทธิ์ในที่ดิน:
- เป็นแบบชุมชนหรือหมู่บ้าน
สิทธิในการใช้ที่ดิน:
- เกี่ยวกับชุมชน (ถูกจัดระเบียบ)
สิทธิในการใช้น้ำ:
- เกี่ยวกับชุมชน (ถูกจัดระเบียบ)
5.9 การเข้าถึงบริการและโครงสร้างพื้นฐาน
สุขภาพ:
- จน
- ปานกลาง
- ดี
การศึกษา:
- จน
- ปานกลาง
- ดี
ความช่วยเหลือทางด้านเทคนิค:
- จน
- ปานกลาง
- ดี
การจ้างงาน (เช่น ภายนอกฟาร์ม):
- จน
- ปานกลาง
- ดี
ตลาด:
- จน
- ปานกลาง
- ดี
พลังงาน:
- จน
- ปานกลาง
- ดี
ถนนและการขนส่ง:
- จน
- ปานกลาง
- ดี
น้ำดื่มและการสุขาภิบาล:
- จน
- ปานกลาง
- ดี
6. ผลกระทบและสรุปคำบอกกล่าว
6.1 ผลกระทบในพื้นที่ดำเนินการ (On-site) จากการใช้เทคโนโลยี
ผลกระทบด้านสังคมวัฒนธรรมอื่น ๆ
ความมั่นคงด้านอาหาร / พึ่งตนเองได้
สถานการณ์ของกลุ่มด้อยโอกาส ทางด้านสังคมและเศรษฐกิจ
ผลกระทบด้านนิเวศวิทยา
ลดความเสี่ยงของภัยพิบัติ
ผลกระทบจากภัยแล้ง
6.2 ผลกระทบนอกพื้นที่ดำเนินการ (Off-site) จากการใช้เทคโนโลยี
Reduction of livestock mortality as a result of forage scarcity due to drought.
6.3 การเผชิญและความตอบสนองของเทคโนโลยีต่อการเปลี่ยนแปลงสภาพภูมิอากาศที่ค่อยเป็นค่อยไป และสภาพรุนแรงของภูมิอากาศ / ภัยพิบัติ (ที่รับรู้ได้โดยผู้ใช้ที่ดิน)
การเปลี่ยนแปลงสภาพภูมิอากาศที่ค่อยเป็นค่อยไป
การเปลี่ยนแปลงสภาพภูมิอากาศที่ค่อยเป็นค่อยไป
| ฤดู | ประเภทของการเปลี่ยนแปลงสภาพภูมิอากาศที่ค่อยเป็นค่อยไป และสภาพรุนแรงของภูมิอากาศ | เทคโนโลยีมีวิธีการรับมืออย่างไร | |
|---|---|---|---|
| ฝนประจำปี | ลดลง | ปานกลาง |
สภาพรุนแรงของภูมิอากาศ (ภัยพิบัติ)
ภัยพิบัติจากสภาพภูมิอากาศ
| เทคโนโลยีมีวิธีการรับมืออย่างไร | |
|---|---|
| ภัยจากฝนแล้ง | ดี |
สภาพรุนแรงของภูมิอากาศ (ภัยพิบัติ) อื่น ๆ
| อื่น ๆ (ระบุ) | เทคโนโลยีมีวิธีการรับมืออย่างไร |
|---|---|
| Forage scarcity | ดี |
6.4 การวิเคราะห์ค่าใช้จ่ายและผลประโยชน์ที่ได้รับ
ผลประโยชน์ที่ได้รับเปรียบเทียบกับค่าใช้จ่ายในการจัดตั้งเป็นอย่างไร (จากมุมมองของผู้ใช้ที่ดิน)
ผลตอบแทนระยะสั้น:
ด้านบวกเล็กน้อย
ผลตอบแทนระยะยาว:
ด้านบวก
ผลประโยชน์ที่ได้รับเปรียบเทียบกับค่าใช้จ่ายในการบำรุงรักษาหรือต้นทุนที่เกิดขึ้นซ้ำอีก เป็นอย่างไร (จากมุมมองของผู้ใช้ที่ดิน)
ผลตอบแทนระยะสั้น:
ด้านบวก
ผลตอบแทนระยะยาว:
ด้านบวก
6.5 การปรับตัวของเทคโนโลยี
- 10-50%
ถ้ามีข้อมูลให้บอกปริมาณด้วย (จำนวนของครัวเรือนหรือครอบคลุมพื้นที่):
over 25,000 households
จากทั้งหมดที่ได้รับเทคโนโลยีเข้ามามีจำนวนเท่าใดที่ทำแบบทันที โดยไม่ได้รับการจูงใจด้านวัสดุหรือการเงินใด ๆ:
- 10-50%
6.6 การปรับตัว
เทคโนโลยีได้รับการปรับเปลี่ยนเมื่อเร็วๆนี้ เพื่อให้ปรับตัวเข้ากับสภาพที่กำลังเปลี่ยนแปลงหรือไม่:
ไม่ใช่
6.8 จุดอ่อน / ข้อเสียเปรียบ / ความเสี่ยงของเทคโนโลยีและวิธีการแก้ไข
| จุดอ่อน / ข้อเสียเปรียบ / ความเสี่ยงในทัศนคติของผู้ใช้ที่ดิน | มีวิธีการแก้ไขได้อย่างไร |
|---|---|
| A key concern of index-insurance products is that there might occur variances in perceived loss versus the actual payouts (basis risk) | Proper contract design should be backed with ground truthing efforts together with awareness creation. |
7. การอ้างอิงและการเชื่อมต่อ
7.1 วิธีการและแหล่งข้อมูล
- การเก็บรวบรวมมาจากรายงานและเอกสารที่มีอยู่
7.2 การอ้างอิงถึงสิ่งตีพิมพ์
หัวข้อ, ผู้เขียน, ปี, หมายเลข ISBN:
Chelang'a et. al 2017
หัวข้อ, ผู้เขียน, ปี, หมายเลข ISBN:
Tucker et al., 2005
7.3 เชื่อมโยงกับข้อมูลที่มีอยู่บนออนไลน์
ชื่อเรื่องหรือคำอธิบาย:
IBLI website
URL:
https://ibli.ilri.org/
ลิงก์และโมดูล
ขยายทั้งหมด ย่อทั้งหมดลิงก์
ไม่มีลิงก์
โมดูล
ไม่มีโมดูล


