Productive use of the riparian area using Napier grass and protection of the riverbank with indigenous trees at Kapingazi River [Kenya]
- Creation:
- Update:
- Compiler: Manuel Fischer
- Editor: –
- Reviewers: David Streiff, Alexandra Gavilano
technologies_1558 - Kenya
- Full summary as PDF
- Full summary as PDF for print
- Full summary in the browser
- Full summary (unformatted)
- Productive use of the riparian area using Napier grass and protection of the riverbank with indigenous trees at Kapingazi River: March 28, 2017 (inactive)
- Productive use of the riparian area using Napier grass and protection of the riverbank with indigenous trees at Kapingazi River: Sept. 4, 2019 (public)
View sections
Expand all Collapse all1. General information
1.2 Contact details of resource persons and institutions involved in the assessment and documentation of the Technology
land user:
Nyaga Robinson
Kenya
Name of the institution(s) which facilitated the documentation/ evaluation of the Technology (if relevant)
CDE Centre for Development and Environment (CDE Centre for Development and Environment) - Switzerland1.3 Conditions regarding the use of data documented through WOCAT
The compiler and key resource person(s) accept the conditions regarding the use of data documented through WOCAT:
Yes
2. Description of the SLM Technology
2.1 Short description of the Technology
Definition of the Technology:
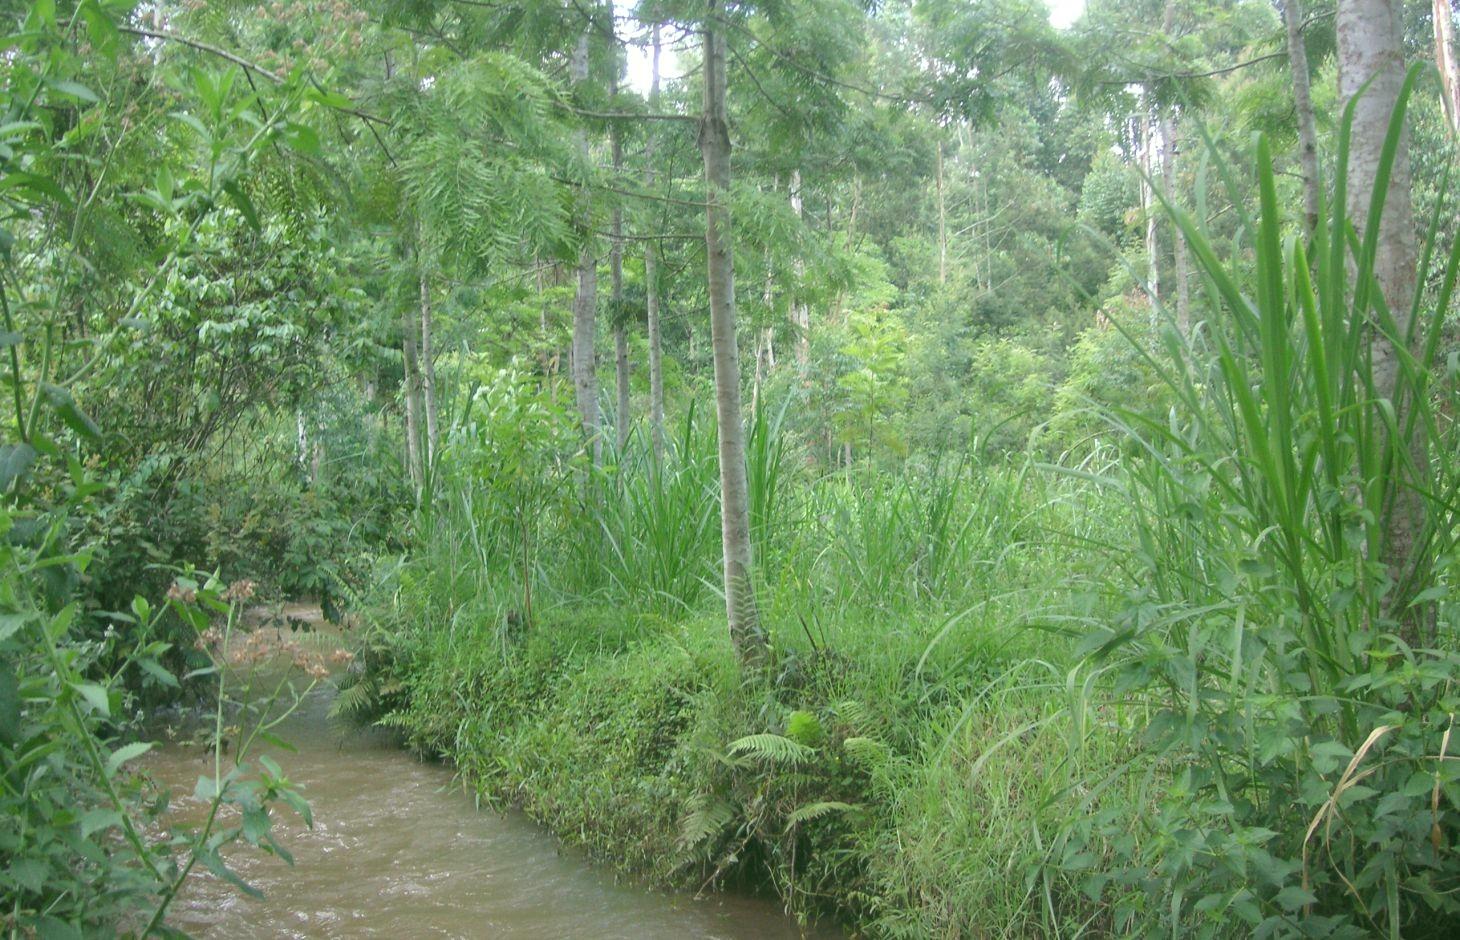
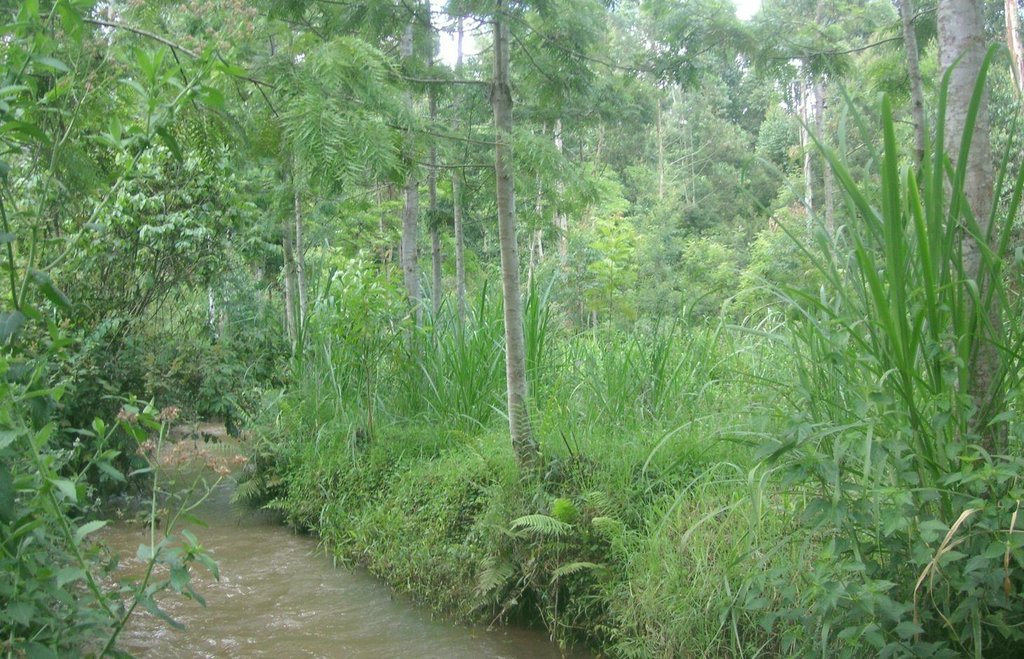
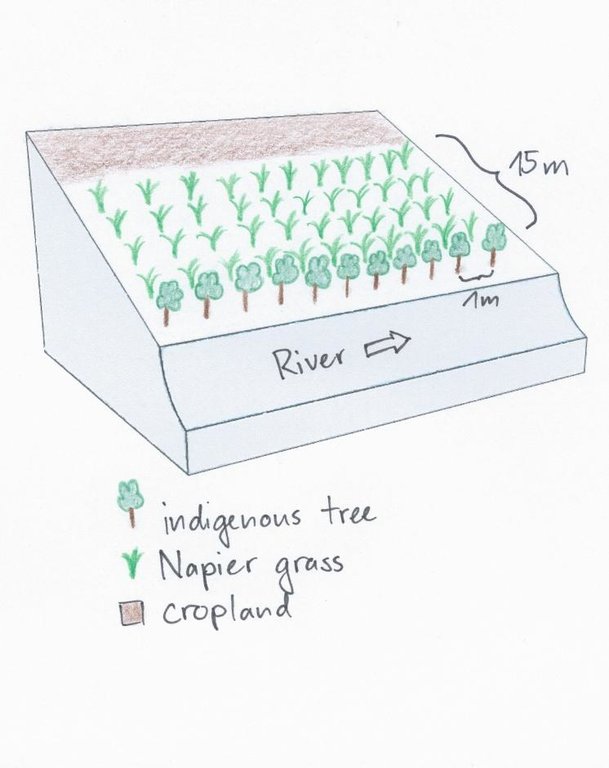
A riparian area that is frequently flooded requires a special treatment because conventional agriculture is not possible. Trees along the riverbank and Napier grass on the remaining space still allow a productive use despite the difficult circumstances.
2.2 Detailed description of the Technology
Description:
On the southeastern slopes of Mt. Kenya, the circumstances are ideal for agricultural activities, the rains are plenty and normally reliable. The plot owner started realizing a problem of riverbank degradation 17 years ago. But still he continued the traditional way of agriculture, planting beans and maize. Since his plot is on the slip-off slope only few metres above the river level, it experienced regular floods in case of heavy rainfalls, destroying the plants and leading to crop failures. Conventional plants like maize and beans do not resist such an excess of water. To fight the land loss and the bad harvest, the farmer introduced indigenous trees along the river and Napier fighting the riverbank degradation. Behind that, several rows of the flood resistant Napier grass were planted to still use the area in a productive way.
Purpose of the Technology: Above all, the goal of this technology is to get a high grass production. As a side effect results a quite good protection of the riparian area. The vegetation prevents rainwater from running directly from the fields into the water. Therefore, the chemicals from the field get stuck in the riparian soils and don't pollute the river. In the same way the infiltration in the riparian enlarges the total infiltration since the water would go to the river directly. Especially the raw surface of the riparian allows more infiltration and interception storage of water. This surplus of stored water is able to provide river water for a longer period, when rains are humble for a longer period. In case of floods, the increased infiltration potential can cut the peak flow and thus prevent damages. The grass yield is used as a fodder for the cows.
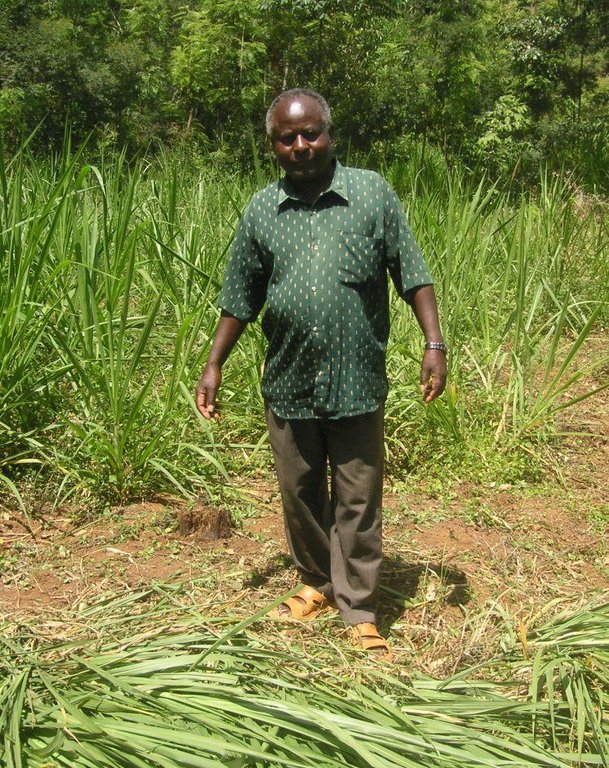
Establishment / maintenance activities and inputs: Before planting the indigenous trees, water guzzlers like eucalyptus trees were cut down. Indigenous seedlings were planted right along the river at a distance of 1 m. Behind the tree row, Napier grass is planted and harvested twice a year. The cutting and harvesting of the grass is done regularly such that animals can be provided with fodder every day. As soon as the trees are big enough, they function as a source of fire wood, they can be pruned every 5 months.
Natural / human environment: The studied plot is situated between the tea and the coffee zone at an elevation of 1663 m.a.s.l. This small-scale farm does not produce tea nor coffee, there is mainly subsistence agricultural production and some few products are sold on the market. Rainfall is reliable and ensures a regular production.
2.3 Photos of the Technology
2.5 Country/ region/ locations where the Technology has been applied and which are covered by this assessment
Country:
Kenya
Region/ State/ Province:
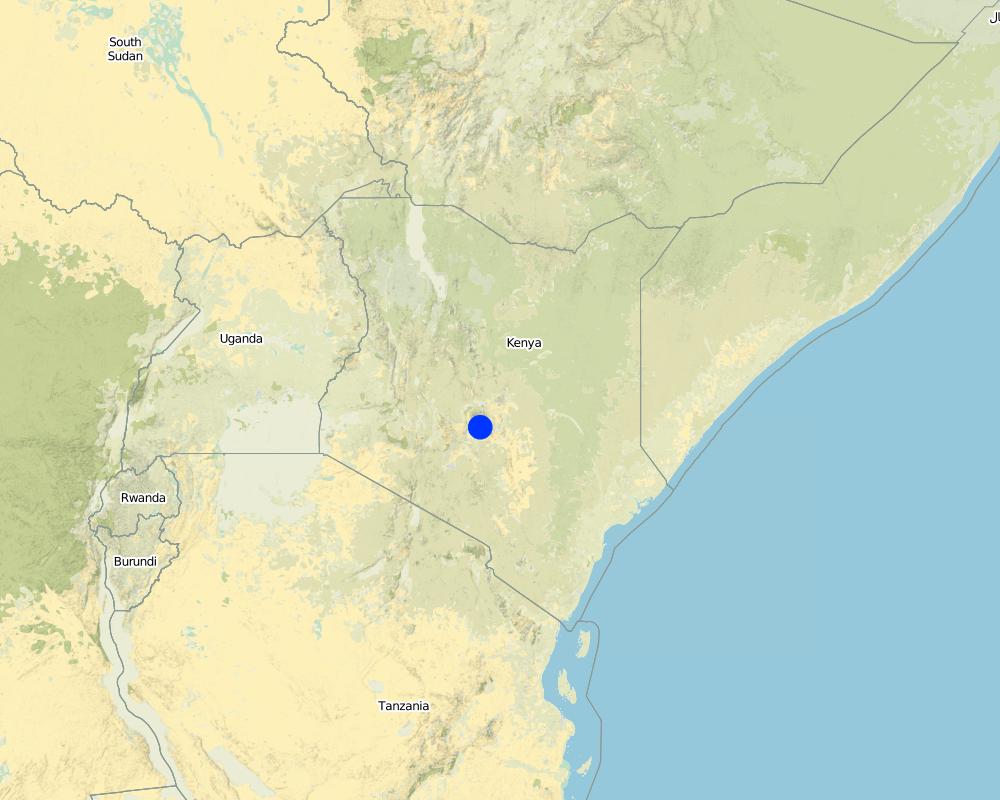
Kenya/Eastern Province
Further specification of location:
Embu
Specify the spread of the Technology:
- evenly spread over an area
If the Technology is evenly spread over an area, specify area covered (in km2):
0.00075
If precise area is not known, indicate approximate area covered:
- < 0.1 km2 (10 ha)
Comments:
The area along the river is very small, namely 750 m2.
Map
×2.6 Date of implementation
If precise year is not known, indicate approximate date:
- 10-50 years ago
2.7 Introduction of the Technology
Specify how the Technology was introduced:
- through land users' innovation
Comments (type of project, etc.):
Farmer asked neighbours for advice.
3. Classification of the SLM Technology
3.1 Main purpose(s) of the Technology
- improve production
3.2 Current land use type(s) where the Technology is applied
Land use mixed within the same land unit:
Yes
Specify mixed land use (crops/ grazing/ trees):
- Agro-silvopastoralism

Cropland
- Annual cropping
- Tree and shrub cropping
Annual cropping - Specify crops:
- fodder crops - grasses
- Grevillea, Mutundu, Miburu, Mulinga (cf. Moringa oleifera), Mugumo
Number of growing seasons per year:
- 2
Specify:
Longest growing period in days: 90 Longest growing period from month to month: march to may Second longest growing period in days: 90 Second longest growing period from month to month: october to december
Grazing land
Intensive grazing/ fodder production:
- Cut-and-carry/ zero grazing
- cows

Forest/ woodlands
Comments:
Main animal species and products: Cows are living on the farm. The farmer carries the fodder to the stall.
Trees/ shrubs species: Grevillea, Mutundu, Miburu, Mulinga, Mugumo
Grass species: Napier Grass
Major land use problems (compiler’s opinion): The excessive water on the plot hinders conventional agriculture and the floods lead to riverbank degradation.
Major land use problems (land users’ perception): The land plot is situated right beside the river and is less than a metre above the river. Flood destroyed regularly the harvest of maize or french beans. Parts of the riparian have been removed.
Future (final) land use (after implementation of SLM Technology): Grazing land: Gi: Intensive grazing/ fodder production
Livestock density (if relevant): > 100 LU /km2
3.3 Has land use changed due to the implementation of the Technology?
Has land use changed due to the implementation of the Technology?
- Yes (Please fill out the questions below with regard to the land use before implementation of the Technology)

Cropland
- Annual cropping
3.4 Water supply
Water supply for the land on which the Technology is applied:
- rainfed
Comments:
Water supply: Also post-flooding
3.5 SLM group to which the Technology belongs
- improved plant varieties/ animal breeds
3.6 SLM measures comprising the Technology
vegetative measures
- V1: Tree and shrub cover
- V2: Grasses and perennial herbaceous plants
Comments:
Main measures: vegetative measures
Type of vegetative measures: aligned: -along boundary, scattered / dispersed
3.7 Main types of land degradation addressed by the Technology
soil erosion by water
- Wt: loss of topsoil/ surface erosion
- Wr: riverbank erosion
biological degradation
- Bs: quality and species composition/ diversity decline

water degradation
- Hp: decline of surface water quality
Comments:
Main type of degradation addressed: Wr: riverbank erosion, Hp: decline of surface water quality
Secondary types of degradation addressed: Wt: loss of topsoil / surface erosion, Bs: quality and species composition /diversity decline
Main causes of degradation: over-exploitation of vegetation for domestic use, floods (The floods are mostly responsible for the riverbank degradation and destroy conventionally cultivated crops.)
Secondary causes of degradation: deforestation / removal of natural vegetation (incl. forest fires), population pressure, land tenure (By law the riparian should be protected. The land owner uses it in a productive way.), poverty / wealth
3.8 Prevention, reduction, or restoration of land degradation
Specify the goal of the Technology with regard to land degradation:
- prevent land degradation
- reduce land degradation
4. Technical specifications, implementation activities, inputs, and costs
4.1 Technical drawing of the Technology
Technical specifications (related to technical drawing):
A tree row is aligned directly beside the riverbed with a spacing of 1m. Directly behind the trees, Napier grass is planted up to a width of 15m. Adjacent to the Napier grass, there is cropland.
Location: Manyatta. Embu West / Eastern Province
Date: 28.12.2013
Technical knowledge required for field staff / advisors: low
Technical knowledge required for land users: low
Main technical functions: stabilisation of soil (eg by tree roots against land slides), improvement of water quality, buffering / filtering water
Secondary technical functions: improvement of ground cover, increase of biomass (quantity)
Aligned: -along boundary
Vegetative material: T : trees / shrubs
Vertical interval within rows / strips / blocks (m): 1
Scattered / dispersed
Vegetative material: G : grass
Spacing between rows / strips / blocks (m): 0.8
Vertical interval within rows / strips / blocks (m): 0.8
Trees/ shrubs species: Grevillea, Mutundu, Miburu, Mulinga, Mugumo
Grass species: Napier Grass
Slope (which determines the spacing indicated above): 0%
Author:
Manuel Fischer
4.2 General information regarding the calculation of inputs and costs
Specify how costs and inputs were calculated:
- per Technology unit
Specify currency used for cost calculations:
- USD
Indicate average wage cost of hired labour per day:
3.33
4.3 Establishment activities
| Activity | Timing (season) | |
|---|---|---|
| 1. | Chopping bad trees | anytime |
| 2. | Tree planting | rainy season |
| 3. | Planting of Napier grass | Beginning of rainy season |
4.4 Costs and inputs needed for establishment
| Specify input | Unit | Quantity | Costs per Unit | Total costs per input | % of costs borne by land users | |
|---|---|---|---|---|---|---|
| Labour | Chopping bad trees | Persons/day | 2.5 | 3.2 | 8.0 | 100.0 |
| Labour | Tree planting | Persons/day | 5.0 | 3.6 | 18.0 | 100.0 |
| Labour | Planting of Napier grass | Persons/day | 2.0 | 2.75 | 5.5 | 100.0 |
| Plant material | Seedling | Pieces | 70.0 | 0.114285 | 8.0 | 100.0 |
| Total costs for establishment of the Technology | 39.5 | |||||
| Total costs for establishment of the Technology in USD | 39.5 | |||||
Comments:
Duration of establishment phase: 0.3 month(s)
4.5 Maintenance/ recurrent activities
| Activity | Timing/ frequency | |
|---|---|---|
| 1. | Adding manure | 2 times a month |
| 2. | Harvest of Napier | 2 times per year after rainy season |
| 3. | Pruning |
4.6 Costs and inputs needed for maintenance/ recurrent activities (per year)
| Specify input | Unit | Quantity | Costs per Unit | Total costs per input | % of costs borne by land users | |
|---|---|---|---|---|---|---|
| Labour | Adding manure | Persons/day | 0.2 | 2.25 | 0.45 | 100.0 |
| Labour | Harvest of Napier | Persons/day | 2.0 | 3.3333 | 6.67 | 100.0 |
| Labour | Prunning | Persons/day | 2.0 | 3.25 | 6.5 | 100.0 |
| Total costs for maintenance of the Technology | 13.62 | |||||
| Total costs for maintenance of the Technology in USD | 13.62 | |||||
Comments:
Machinery/ tools: Jembe (Hacke), Panga (Machete)
The plot is situated right at the riverside and gets flooded regularly. 70 trees were planted along the river in one row. The area of the Napier grass is approximately 750m2 big, harvest is two times a year. Costs were calculated in 2012.
The costs per hectare were calculated for a riparian area with a length of 100m and a width of 10m, since hectares are difficult to apply on a riparian context. The determinant factor for the costs is labour and the area of the plot. The required equipment like a spade is available on nearly every farm or can be borrowed from neighbours and is thus not added to the costs.
5. Natural and human environment
5.1 Climate
Annual rainfall
- < 250 mm
- 251-500 mm
- 501-750 mm
- 751-1,000 mm
- 1,001-1,500 mm
- 1,501-2,000 mm
- 2,001-3,000 mm
- 3,001-4,000 mm
- > 4,000 mm
Specify average annual rainfall (if known), in mm:
1703.00
Indicate the name of the reference meteorological station considered:
source: http://www.wri.org/publication/content/9291
Agro-climatic zone
- sub-humid
Thermal climate class: tropics. http://www.levoyageur.net/weather-city-EMBU.html
5.2 Topography
Slopes on average:
- flat (0-2%)
- gentle (3-5%)
- moderate (6-10%)
- rolling (11-15%)
- hilly (16-30%)
- steep (31-60%)
- very steep (>60%)
Landforms:
- plateau/plains
- ridges
- mountain slopes
- hill slopes
- footslopes
- valley floors
Altitudinal zone:
- 0-100 m a.s.l.
- 101-500 m a.s.l.
- 501-1,000 m a.s.l.
- 1,001-1,500 m a.s.l.
- 1,501-2,000 m a.s.l.
- 2,001-2,500 m a.s.l.
- 2,501-3,000 m a.s.l.
- 3,001-4,000 m a.s.l.
- > 4,000 m a.s.l.
Indicate if the Technology is specifically applied in:
- concave situations
Comments and further specifications on topography:
Altitudinal zone: 1668 m a.s.l., source: aster gdem
5.3 Soils
Soil depth on average:
- very shallow (0-20 cm)
- shallow (21-50 cm)
- moderately deep (51-80 cm)
- deep (81-120 cm)
- very deep (> 120 cm)
Soil texture (topsoil):
- medium (loamy, silty)
Topsoil organic matter:
- low (<1%)
If available, attach full soil description or specify the available information, e.g. soil type, soil PH/ acidity, Cation Exchange Capacity, nitrogen, salinity etc.
Soil texture (topsoil): It is called Murram
Soil fertility is low
Soil drainage / infiltration is good
Soil water storage capacity is medium
5.4 Water availability and quality
Ground water table:
< 5 m
Availability of surface water:
good
Water quality (untreated):
poor drinking water (treatment required)
5.5 Biodiversity
Species diversity:
- medium
Comments and further specifications on biodiversity:
Species diversity: Also low
5.6 Characteristics of land users applying the Technology
Market orientation of production system:
- subsistence (self-supply)
Off-farm income:
- less than 10% of all income
Relative level of wealth:
- poor
- average
Individuals or groups:
- individual/ household
Gender:
- women
- men
Indicate other relevant characteristics of the land users:
Land users applying the Technology are mainly common / average land users
Population density: > 500 persons/km2
Market orientation of production system: Family of 10 children
5.7 Average area of land used by land users applying the Technology
- < 0.5 ha
- 0.5-1 ha
- 1-2 ha
- 2-5 ha
- 5-15 ha
- 15-50 ha
- 50-100 ha
- 100-500 ha
- 500-1,000 ha
- 1,000-10,000 ha
- > 10,000 ha
Is this considered small-, medium- or large-scale (referring to local context)?
- small-scale
5.8 Land ownership, land use rights, and water use rights
Land ownership:
- individual, not titled
Land use rights:
- individual
Water use rights:
- individual
Comments:
Abstractions are controlled by the local Water Resource Users association (WRUA), but everybody can take water by hand.
5.9 Access to services and infrastructure
health:
- poor
- moderate
- good
education:
- poor
- moderate
- good
technical assistance:
- poor
- moderate
- good
employment (e.g. off-farm):
- poor
- moderate
- good
markets:
- poor
- moderate
- good
energy:
- poor
- moderate
- good
roads and transport:
- poor
- moderate
- good
drinking water and sanitation:
- poor
- moderate
- good
financial services:
- poor
- moderate
- good
6. Impacts and concluding statements
6.1 On-site impacts the Technology has shown
Socio-economic impacts
Production
crop production
fodder production
animal production
risk of production failure
Income and costs
diversity of income sources
Other socio-economic impacts
Fuelwood production through pruning
Socio-cultural impacts
food security/ self-sufficiency
SLM/ land degradation knowledge
Ecological impacts
Water cycle/ runoff
water quality
Soil
soil cover
Biodiversity: vegetation, animals
plant diversity
habitat diversity
Other ecological impacts
Stabilization of riverbank
Infiltration
6.2 Off-site impacts the Technology has shown
reliable and stable stream flows in dry season
downstream siltation
groundwater/ river pollution
6.3 Exposure and sensitivity of the Technology to gradual climate change and climate-related extremes/ disasters (as perceived by land users)
Gradual climate change
Gradual climate change
| Season | increase or decrease | How does the Technology cope with it? | |
|---|---|---|---|
| annual temperature | increase | well |
Climate-related extremes (disasters)
Meteorological disasters
| How does the Technology cope with it? | |
|---|---|
| local rainstorm | well |
| local windstorm | well |
Climatological disasters
| How does the Technology cope with it? | |
|---|---|
| drought | not well |
Hydrological disasters
| How does the Technology cope with it? | |
|---|---|
| general (river) flood | not well |
Other climate-related consequences
Other climate-related consequences
| How does the Technology cope with it? | |
|---|---|
| reduced growing period | well |
6.4 Cost-benefit analysis
How do the benefits compare with the establishment costs (from land users’ perspective)?
Short-term returns:
negative
Long-term returns:
positive
How do the benefits compare with the maintenance/ recurrent costs (from land users' perspective)?
Short-term returns:
negative
Long-term returns:
positive
Comments:
Establishment and maintenance costs are quite low.
6.5 Adoption of the Technology
- single cases/ experimental
Of all those who have adopted the Technology, how many did so spontaneously, i.e. without receiving any material incentives/ payments?
- 91-100%
Comments:
15% of land user families have adopted the Technology without any external material support
There is a moderate trend towards spontaneous adoption of the Technology
Comments on adoption trend: The knowledge is spreading and people acknowledge the benefits.
6.7 Strengths/ advantages/ opportunities of the Technology
| Strengths/ advantages/ opportunities in the land user’s view |
|---|
|
Protection of the riverbank and reduced riverbank erosion. How can they be sustained / enhanced? Regular management of riparian trees by replacing dead trees with new ones. |
|
Productive function of the Napier grass in terms of fodder and of the trees in terms of pruning for fire wood. How can they be sustained / enhanced? Careful use of the trees and the grass enables a sustainable use of the plants. |
|
No more crop failures. How can they be sustained / enhanced? One should only cultivate plants that can cope with the local excess or scarcity of water. |
| Strengths/ advantages/ opportunities in the compiler’s or other key resource person’s view |
|---|
|
Riverbank stabilisation due to the plantation of trees. How can they be sustained / enhanced? A good idea would be to establish a second row of trees along the river and thus enlarging the number of trees and their positive effects on riverbank stabilisation and filtering of the runoff. |
6.8 Weaknesses/ disadvantages/ risks of the Technology and ways of overcoming them
| Weaknesses/ disadvantages/ risks in the compiler’s or other key resource person’s view | How can they be overcome? |
|---|---|
| After the harvest of the Napier, the land is bare and vulnerable to erosion. | Instead of cutting the whole plot at once, only a quarter of the Napier grass should be cut at once. So that the land is not completely vulnerable to rain. |
7. References and links
7.1 Methods/ sources of information
Links and modules
Expand all Collapse allLinks
No links
Modules
No modules


