Ponds to establish micro catchments, harvest runoff water and reduce soil erosion. [South Africa]
- Creation:
- Update:
- Compiler: Lehman Lindeque
- Editor: –
- Reviewer: Rima Mekdaschi Studer
Ponding
technologies_5801 - South Africa
View sections
Expand all Collapse all1. General information
1.2 Contact details of resource persons and institutions involved in the assessment and documentation of the Technology
Key resource person(s)
SLM specialist:
Beukes Barend Otto
Living Lands
South Africa
SLM specialist:
SLM specialist:
Rudman Justine
Living Lands
South Africa
SLM specialist:
Lunderstedt Kyra
United Nations Development Programme
South Africa
co-compiler:
Gird Justin
Baviaanskloof Hartland Bewaria/Conservancy
South Africa
Name of project which facilitated the documentation/ evaluation of the Technology (if relevant)
Securing multiple ecosystems benefit through SLM in the productive but degraded landscapes of South Africa (SLM)Name of the institution(s) which facilitated the documentation/ evaluation of the Technology (if relevant)
Living Lands (Collaborations working on living landscapes) - South AfricaName of the institution(s) which facilitated the documentation/ evaluation of the Technology (if relevant)
Rhodes University (Rhodes University) - South Africa1.3 Conditions regarding the use of data documented through WOCAT
The compiler and key resource person(s) accept the conditions regarding the use of data documented through WOCAT:
Yes
1.4 Declaration on sustainability of the described Technology
Is the Technology described here problematic with regard to land degradation, so that it cannot be declared a sustainable land management technology?
No
2. Description of the SLM Technology
2.1 Short description of the Technology
Definition of the Technology:
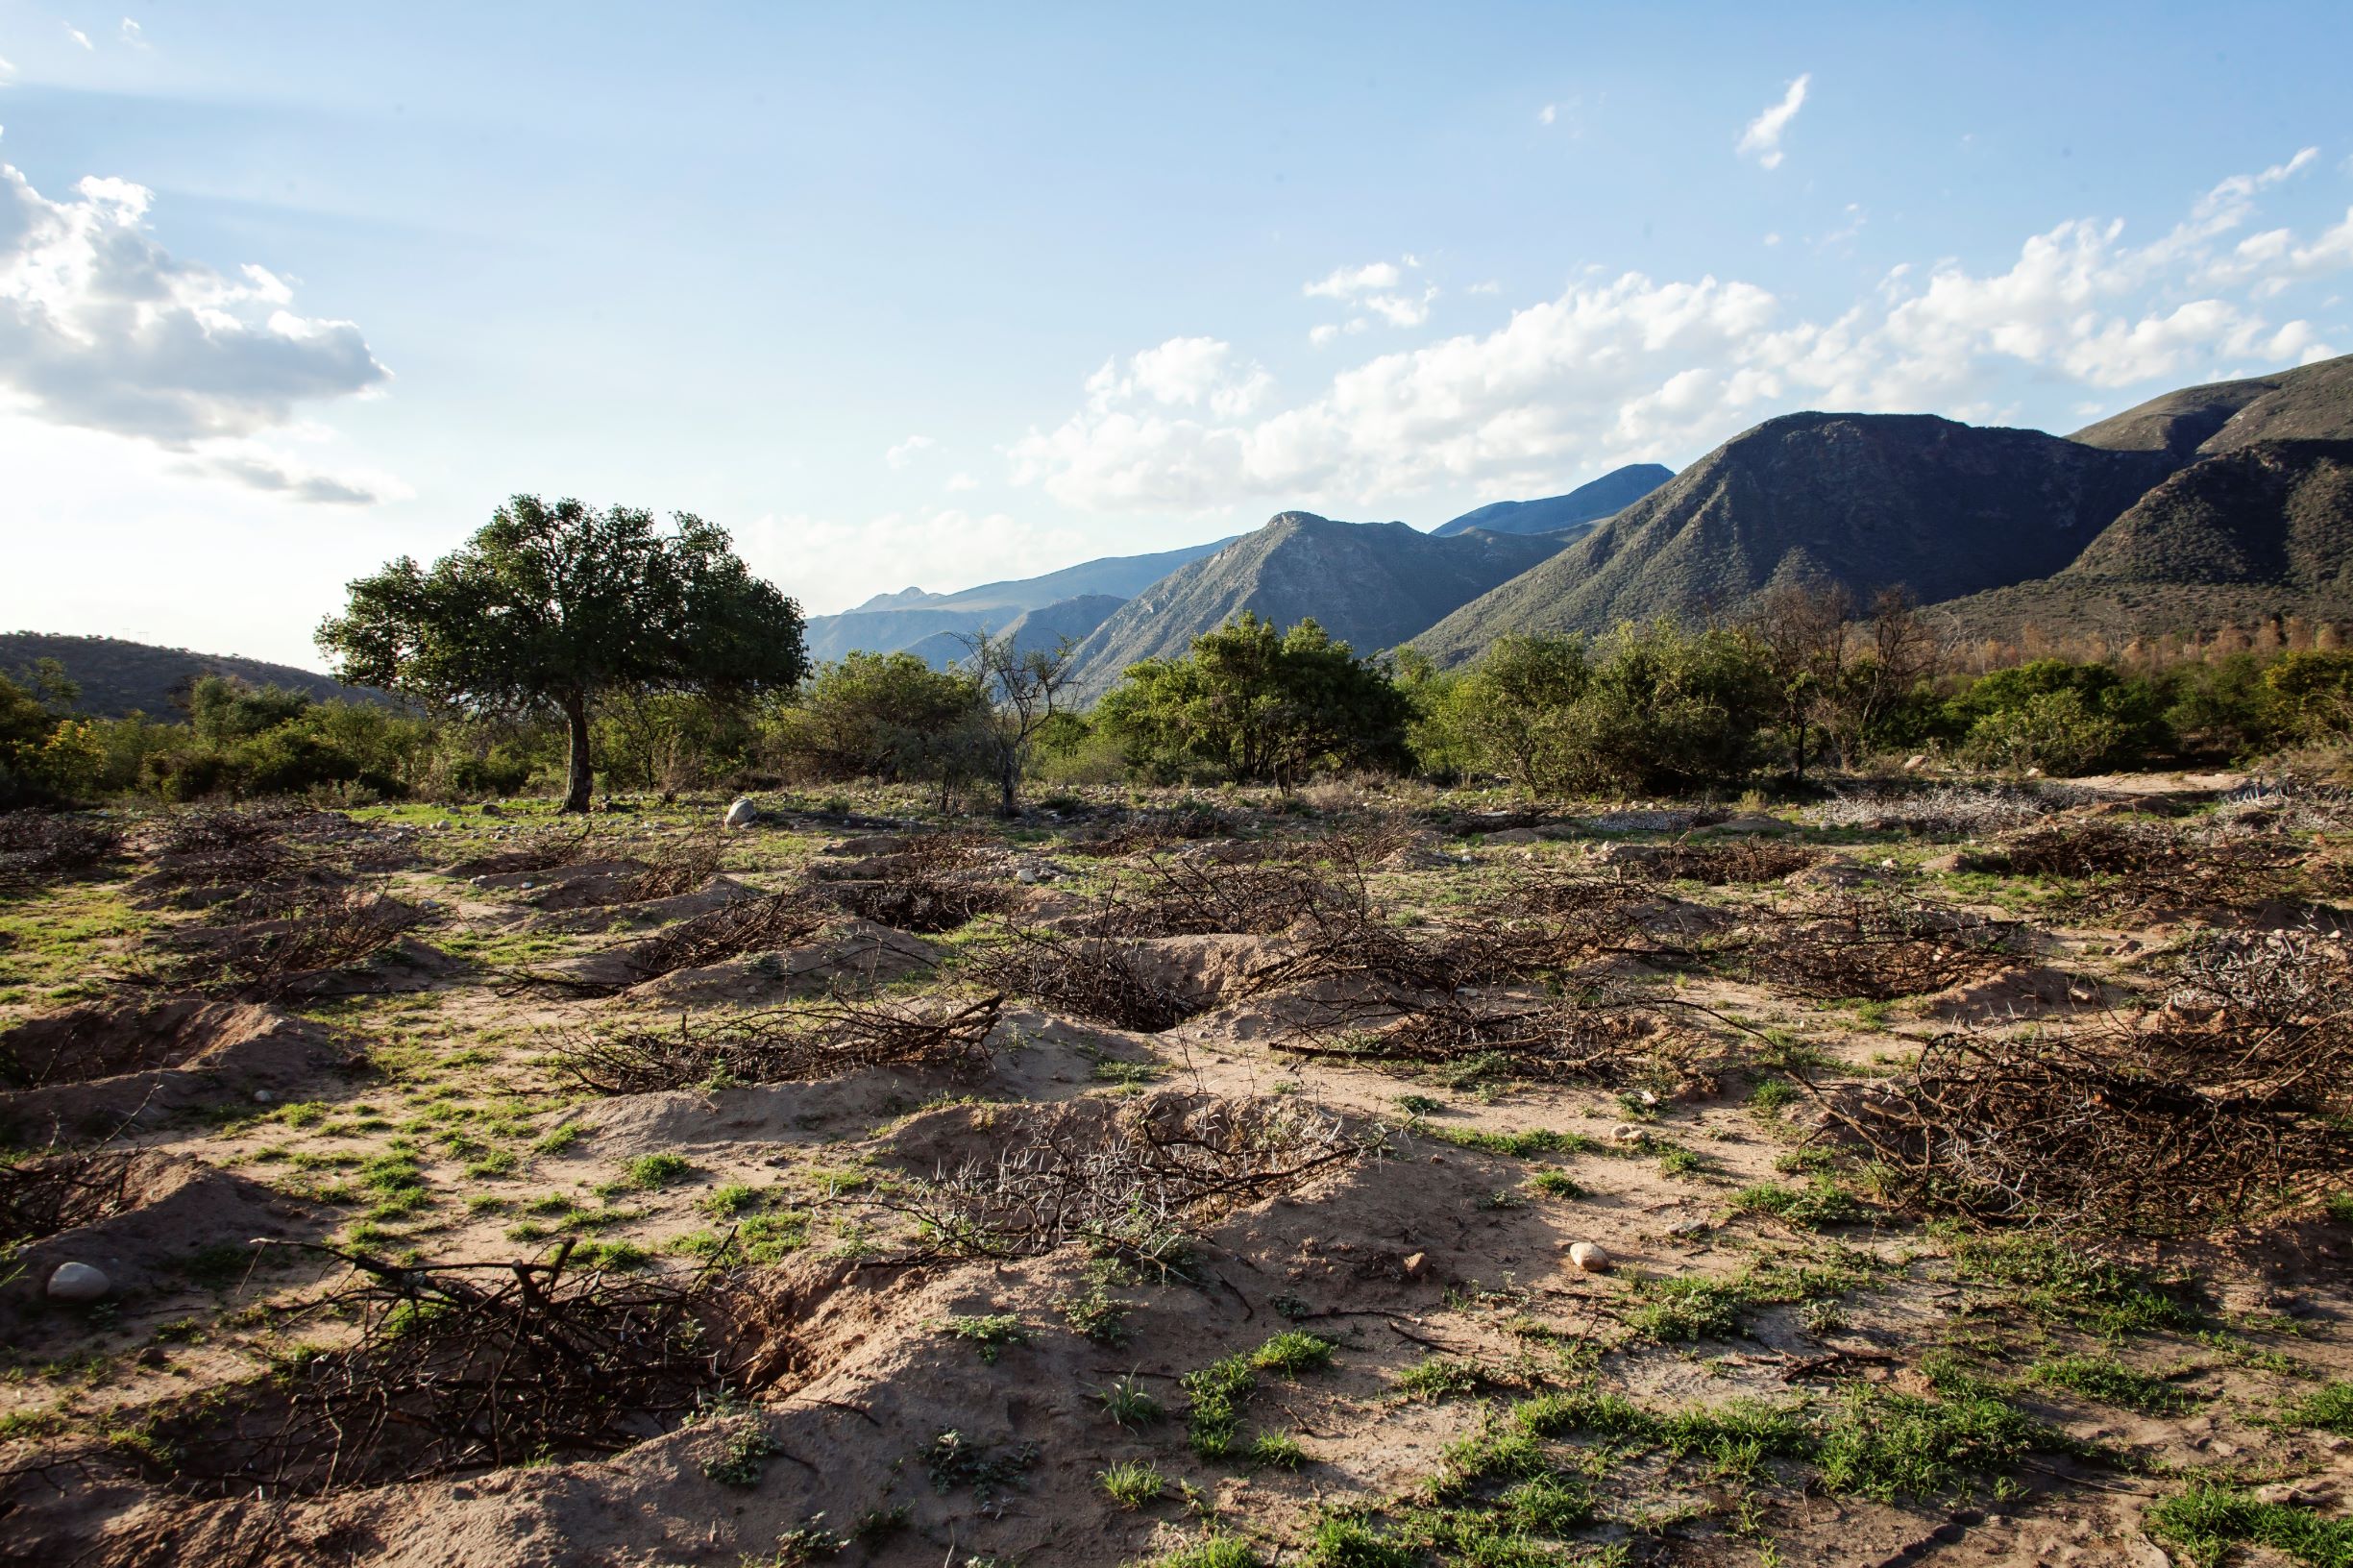
Semi-circular ponds are depressions constructed in the soil to harvest water, reduce runoff, increase infiltration, break soil sealing and crusting, capture organic material and seed where sheet erosion is predominant in degraded, low gradient hillslopes. The opening of the semi-circular pond is up-slope for runoff water to flow into the pond.
2.2 Detailed description of the Technology
Description:
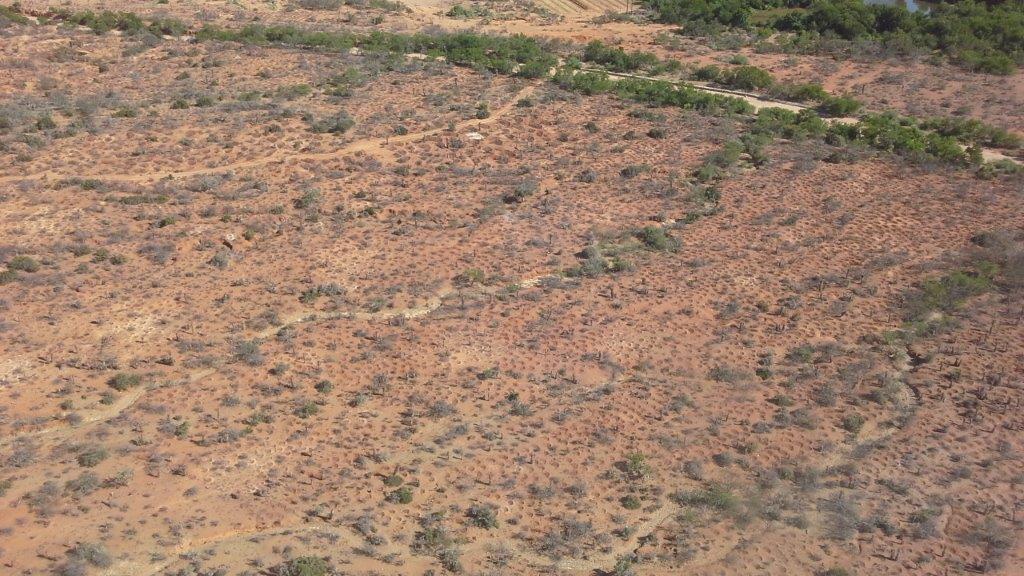
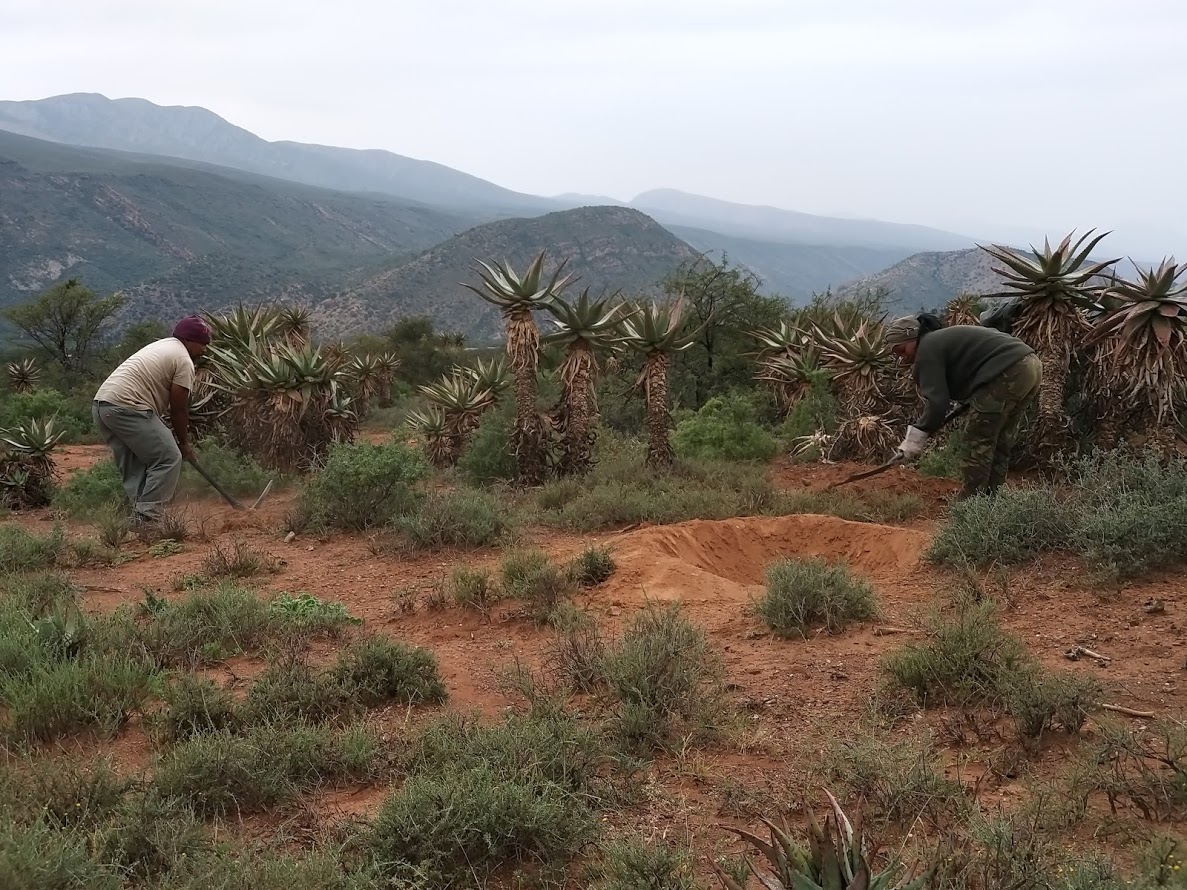
Ponds are applied to disturbed and degraded natural and agricultural areas that have undergone sheet erosion, sealing and crusting on slopes not exceeding 10 degrees. Ponds are constructed of semi-circular hollows dug out of the soil. Ponds are constructed either by hand (micro-ponds) or mechanically using a backhoe-loader or excavator (macro-ponds). Micro ponds are typically 1m wide, 1m long and 30cm deep at its centre, with a water holding capacity of 131 litres. Macro-ponds are typically 3m wide, 3m long and 50cm deep at its centre, with a water holding capacity of approximately 600 litres. The function of ponds is primarily to reduce surface or small rill erosions, reduce water velocity down slope and to harvest water to increase infiltration. Additionally, ponds reduce down-slope siltation of streams, wetlands, dams or reservoirs and even damage to infrastructure like low water bridges, capture seed and organic matter and provide a preferable environment for plant recruitment, particularly in arid areas. Micro-ponds are constructed by pick, to loosen the soil. Loosened soil is then removed by spade and deposited on the downward slope of the pond to form a semi-circular wall similar to that of a dam. The pond wall should be compacted with a spade to reduce breakage during flooding events. Approximately 15% of ponds exhibit broken “dam walls” after two years in extremely arid environments and are greatly dependant on vegetative recruitment. This happened mainly with micro-ponds. Follow-up repairs are advised during the first year, but not thereafter as ponds are also prone to silt up. In arid environments, ponds that do not adequately develop above ground biomass initially are prone to silting closed within three years. Siltation is also dependant on ponding density, spacing and soil type for both micro and macro ponds. The reason for this is they are bigger in size and from our experience, more effective in this arid landscape. Macro-ponds exhibit an increased rate of vegetative recruitment and biomass production, presumably due to less erosion of surface soil and soil nutrients, increased soil moisture content and water retention capacity compared to micro-ponds. Micro-ponds are typically constructed at an average rate of four (4) ponds per hour and 19 ponds per day per person. Production rates are typically 34% lower in hot summer months (2.39 ponds/hour). Macro-ponds are constructed at a rate of approximately 4.43 pond’s per machine hour. Volumetric costs are approximately 31% less expensive when constructed mechanically per litre of water holding capacity. However, large machinery can only be used in severely degraded areas and where access to the project site is available. Ponding density and spacing for micro as well as macro ponds depend on the topography of the landscape to be rehabilitated, the budged and resources available. The more dense, the more effective but also the more expensive the total operation. Some of the threats associated to constructing ponds are soil loss when pond walls break and in the case of steeper slopes may lead to the start of erosion head-cuts if not constructed appropriately. Pond inlets should be constructed at as low gradient decline as possible to reduce the probability of head-cut incision. Ponding at steeper gradients nearing 10-degree slope require particular consideration regarding spacing and density to avoid causing erosion associated to pond breakage. Staggered rows should be considered along the contour. In severely degraded areas, ponds are applied at approximately 400 micro-ponds or 100 mega-ponds per hectare. In severely degraded sites, micro-ponds are applied at approximately 250 ponds per hectare and 160 ponds per hectare in moderately degraded locations. Application rates are greatly determined by soil type and structure, slope, costs and local legislation regarding soil disturbance. Local South African environmental legislation require an Impact Assessment to be done if a certain cubic metres of soil is disturbed, even for rehabilitation purposes. In order to avoid this very costly and tedious approval process, consideration should be given to the amount of soil disturbed or moved. Caution must be taken in severely dispersive soils with regards to soil loss when flooded. Duplex soils are prone to “undercutting” and ponding on these kind of soils should be avoided. Pond depth should be considered with regards to soil water infiltration rates and saturation rate.
The effect of plant growth in and around ponds could also be accelerated or improved by brush packing if material is available in the area. If not, the cost become to high to transport material. Brush packing in the ponds further help to create a micro environment for plant growth by providing a bit of shade, nutrients from the decaying branches and also protection against grazing of newly sprouted plants within the ponds by wildlife occurring naturally in the area. Ponding in semi-arid environments are only used on natural areas, mostly used for grazing of wildlife and livestock. Ponding are usually not used on cultivated fields. Other measures like contours and waterways, vegetative strips are rather used than ponding. There are also very little cultivation happening in semi-arid areas, this project area in Baviaanskloof specifically due to low and unreliable rainfall. Since ponding provide a favourable micro environment for plant growth, grass, shrub and tree species, adaptable and endemic to the area, can be manually planted in the ponds to accelerate vegetative recovery and also to improve the biomass production and species composition in the area. This technology is applied by farmers and land rehabilitation projects. Considering the cost of ponding, it is mainly used in development and restoration projects with donor or government support. In south Africa, this technology is preferred in donor or government funded development project for job creation purposes. Lastly, ponding help reduce soil erosion, increase water infiltration and eventually working towards improve vegetation cover by establishing favourable micro habitats in and around the ponds for vegetation growth. Increased vegetation growth, especially Spekboom, reduced erosion all help to store soil organic carbon and is therefor a carbon mitigation measure as well. Ideally the whole area is withdrawn from grazing for at least 3 years to allow revegation to happen.
2.3 Photos of the Technology
Media Gallery
2.5 Country/ region/ locations where the Technology has been applied and which are covered by this assessment
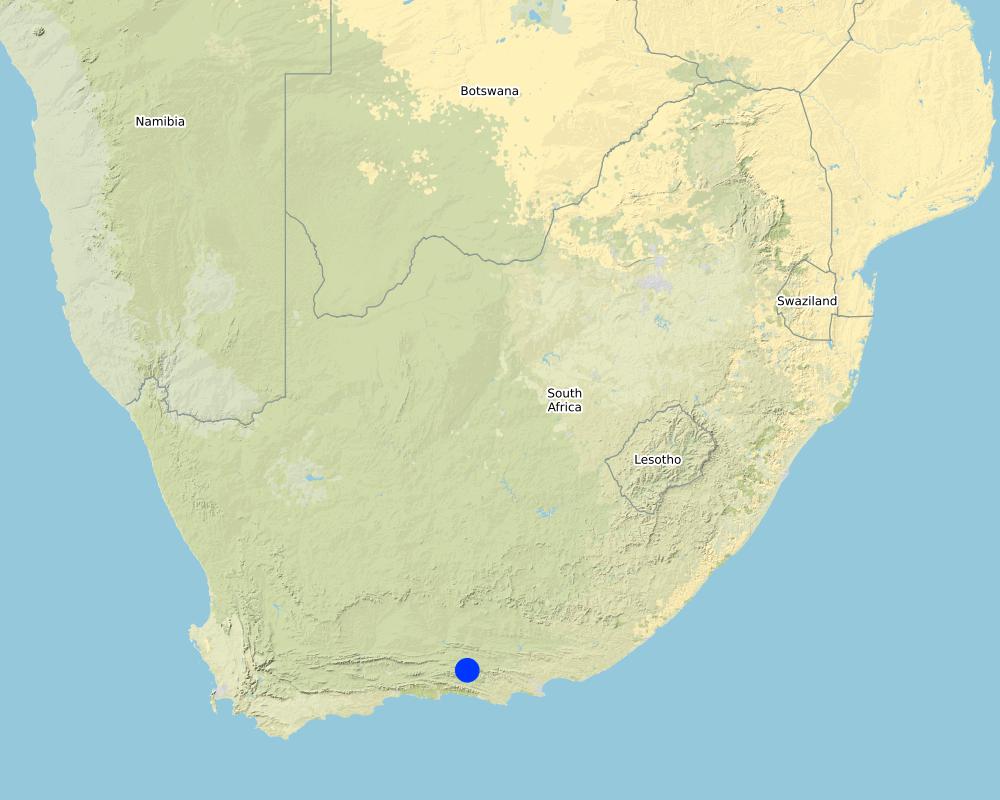
Country:
South Africa
Region/ State/ Province:
Eastern Cape Province
Further specification of location:
Baviaanskloof
Specify the spread of the Technology:
- evenly spread over an area
If the Technology is evenly spread over an area, specify area covered (in km2):
6.0
Is/are the technology site(s) located in a permanently protected area?
No
Map
×2.6 Date of implementation
Indicate year of implementation:
2019
If precise year is not known, indicate approximate date:
- less than 10 years ago (recently)
2.7 Introduction of the Technology
Specify how the Technology was introduced:
- through projects/ external interventions
- Existing technology
Comments (type of project, etc.):
GEF 5 Securing multiple ecosystem services through SLM in the degraded but productive landscapes of South Africa. In the described project area, ponding was done mainly through project intervention and also since other projects had great success with the technology in similar landscapes.
3. Classification of the SLM Technology
3.1 Main purpose(s) of the Technology
- reduce, prevent, restore land degradation
- conserve ecosystem
- protect a watershed/ downstream areas – in combination with other Technologies
- preserve/ improve biodiversity
- mitigate climate change and its impacts
3.2 Current land use type(s) where the Technology is applied
Land use mixed within the same land unit:
No

Grazing land
Extensive grazing:
- Ranching
Animal type:
- goats
- mules and asses
- sheep
- wildlife - large herbivours
Is integrated crop-livestock management practiced?
No
Unproductive land
Specify:
Degraded rangelands
3.3 Has land use changed due to the implementation of the Technology?
Has land use changed due to the implementation of the Technology?
- Yes (Please fill out the questions below with regard to the land use before implementation of the Technology)
Land use mixed within the same land unit:
No
Grazing land
Extensive grazing:
- Ranching
Animal type:
- goats
- mules and asses
- sheep
- wildlife - large herbivours
Is integrated crop-livestock management practiced?
No
Products and services:
- meat
- skins/ hides
- whool
Unproductive land
Specify:
Degraded rangelands
Comments:
The change in land use could be potentially from degraded rangeland to more productive rangeland. In this case study, the land is still on its way towards improved productivity, and therefore not utilised at this stage by any livestock.
3.4 Water supply
Water supply for the land on which the Technology is applied:
- rainfed
3.5 SLM group to which the Technology belongs
- improved ground/ vegetation cover
- water harvesting
- ecosystem-based disaster risk reduction
3.6 SLM measures comprising the Technology

vegetative measures
- V1: Tree and shrub cover
- V2: Grasses and perennial herbaceous plants
- V5: Others
structural measures
- S4: Level ditches, pits
- S7: Water harvesting/ supply/ irrigation equipment

management measures
- M1: Change of land use type
- M2: Change of management/ intensity level
Comments:
V5: Packing brush on top of ponds greatly increases vegetative recruitment and survival rates, survival rate of regenerating plants (from seeds or stocks in the soil) and of intentionally newly seeded plants?
3.7 Main types of land degradation addressed by the Technology

soil erosion by water
- Wt: loss of topsoil/ surface erosion
- Wg: gully erosion/ gullying
- Wo: offsite degradation effects

soil erosion by wind
- Et: loss of topsoil

chemical soil deterioration
- Cn: fertility decline and reduced organic matter content (not caused by erosion)

physical soil deterioration
- Pc: compaction
- Pk: slaking and crusting
- Pu: loss of bio-productive function due to other activities

biological degradation
- Bc: reduction of vegetation cover
- Bh: loss of habitats
- Bq: quantity/ biomass decline
- Bs: quality and species composition/ diversity decline
water degradation
- Ha: aridification
- Hs: change in quantity of surface water
- Hg: change in groundwater/aquifer level
- Hp: decline of surface water quality
- Hw: reduction of the buffering capacity of wetland areas
3.8 Prevention, reduction, or restoration of land degradation
Specify the goal of the Technology with regard to land degradation:
- restore/ rehabilitate severely degraded land
- adapt to land degradation
4. Technical specifications, implementation activities, inputs, and costs
4.1 Technical drawing of the Technology
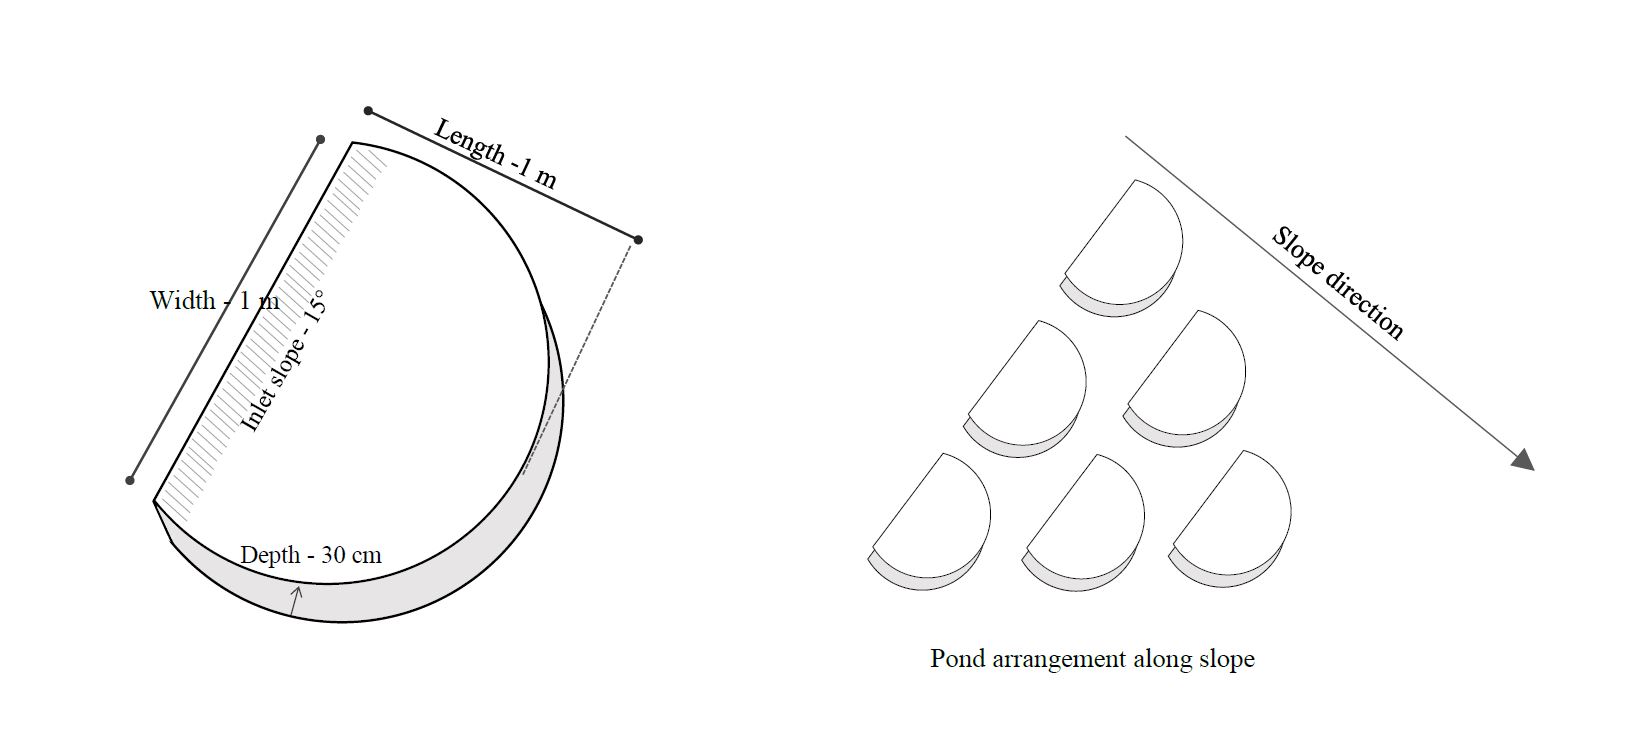
Technical specifications (related to technical drawing):
The technical drawing on the left shows the measurements of a typical average micro-pond. Its about 1m wide on the upstream (open) end and about 1m to the semi-circular edge wall on the downstream side. The pond should be dug out with a spade at an angle of 15 degrees towards the wall of the pond at the downstream end. Use the removed soil to form the semi-circular edge wall as illustrated on the left hand drawing. Use the spade or your feet to compact the soil of the semi-circular wall.
The drawing on the right illustrates the pond arrangement along a slope. The ponds should be staggered in lines across the contour to make sure the water flowing between ponds in the first line, flows into the ponds in the second line or row. The ponds don't need to be exactly in lines across the contour, but it is very important that the pond openings are perpendicular to the slope direction and form an appearance of fish scales.
Author:
Kyra Lunderstedt
Date:
08/07/2020
4.2 General information regarding the calculation of inputs and costs
Specify how costs and inputs were calculated:
- per Technology area
Indicate size and area unit:
600 ha
other/ national currency (specify):
South African Rand
If relevant, indicate exchange rate from USD to local currency (e.g. 1 USD = 79.9 Brazilian Real): 1 USD =:
15.0
Indicate average wage cost of hired labour per day:
ZAR 150 - ZAR 262
4.3 Establishment activities
| Activity | Timing (season) | |
|---|---|---|
| 1. | Terrain inspection and pecking out pond positions and lines | Any time of the year |
| 2. | Manual digging of micro-ponds | Any time of the year |
| 3. | Seeding of ponds (Optional) | Before or at start of rain season |
| 4. | Brush packing if material is available | Any time of the year |
| 5. | Inspection and maintenance of ponds | During the rainy season, especially after heavy thunderstorms |
Comments:
Mainly micro-ponds were used in the area. Macro-ponds where tested for comparison purposes. Equipment needed for macro-ponds Volvo BL61 Backhoe-loader (Vehicle and operator = ZAR 300/hour, Fuel = ZAR 75/hour).
4.4 Costs and inputs needed for establishment
| Specify input | Unit | Quantity | Costs per Unit | Total costs per input | % of costs borne by land users | |
|---|---|---|---|---|---|---|
| Labour | Manual digging of micro-ponds | Person-days | 1677.0 | 215.0 | 360555.0 | 0.0 |
| Equipment | Spade | Number | 24.0 | 250.0 | 6000.0 | 0.0 |
| Equipment | Pick | Number | 24.0 | 350.0 | 8400.0 | 0.0 |
| Plant material | Grass seeds | 25 kg bags | 10.0 | 250.0 | 2500.0 | |
| Other | Transport | km | 15960.0 | 6.2 | 98952.0 | 0.0 |
| Other | Staff overheads | Per person day | 1677.0 | 76.0 | 127452.0 | 0.0 |
| Other | Management | Per field day | 399.0 | 438.0 | 174762.0 | 0.0 |
| Total costs for establishment of the Technology | 778621.0 | |||||
| Total costs for establishment of the Technology in USD | 51908.07 | |||||
If land user bore less than 100% of costs, indicate who covered the remaining costs:
Living Lands NGO working in the Baviaanskloof. In certain cases, depending on availability of external inputs, farmers could contribute by providing labour for example or use there own tools or transport for workers.
Comments:
Donor funding through the United Nations Development Programme, Global Environmental Facility (GEF 5)
4.5 Maintenance/ recurrent activities
| Activity | Timing/ frequency | |
|---|---|---|
| 1. | Restructuring of broken ponds (S) | After heavy rain event |
| 2. | Densification (S) (More ponds are dug when needed | After rain event and assessment of effective functioning and impact |
| 3. | Supplementary seeding (V) | Dependant on species seasonality |
| 4. | Brush-packing | After ponding to increase plant recruitment & survival |
4.6 Costs and inputs needed for maintenance/ recurrent activities (per year)
If you are unable to break down the costs in the table above, give an estimation of the total costs of maintaining the Technology:
25000.0
If land user bore less than 100% of costs, indicate who covered the remaining costs:
Living Lands NGO working in the Baviaanskloof
Comments:
Donor funding through the United Nations Development Programme, Global Environmental Facility (GEF 5)
4.7 Most important factors affecting the costs
Describe the most determinate factors affecting the costs:
For manually constructed ponds: Climatic conditions, particularly heat. Productivity (labour) is approximately 34% greater in the cooler winter months (April-October) and reduce during summer months with regular temperatures above 30°C. The activity is generally stopped when temperatures exceed 32°C. Soil structure (Clay, Sand and rock proportions particularly) effect production rate and longevity. High rock content and dense silt and clay soils reduce productivity (rate at which ponds are dug manually).
When constructing ponds mechanically, soil structure appears to have the greatest effect on production rates.
5. Natural and human environment
5.1 Climate
Annual rainfall
- < 250 mm
- 251-500 mm
- 501-750 mm
- 751-1,000 mm
- 1,001-1,500 mm
- 1,501-2,000 mm
- 2,001-3,000 mm
- 3,001-4,000 mm
- > 4,000 mm
Specify average annual rainfall (if known), in mm:
280.00
Specifications/ comments on rainfall:
: 60% summer rainfall, 40% winter rainfall. Thunder storms in summer deposit large quantities at once (>50mm/occasion). 67% standard deviation around mean across 100 years recorded. Peak rainfall September and March, but no predictable long term or annual patterns. Less than half mean annual rainfall per year from 2015-2019 during analysed implementation period. March and April are the only months that have not experienced zero rainfall over a 100-year period. Approximately 30 days per annum are frost prone in the implementation area
Agro-climatic zone
- arid
PET effects do not exceed 10mm of effective rainfall per month. Approximately 43mm of rainfall per annum is effective
5.2 Topography
Slopes on average:
- flat (0-2%)
- gentle (3-5%)
- moderate (6-10%)
- rolling (11-15%)
- hilly (16-30%)
- steep (31-60%)
- very steep (>60%)
Landforms:
- plateau/plains
- ridges
- mountain slopes
- hill slopes
- footslopes
- valley floors
Altitudinal zone:
- 0-100 m a.s.l.
- 101-500 m a.s.l.
- 501-1,000 m a.s.l.
- 1,001-1,500 m a.s.l.
- 1,501-2,000 m a.s.l.
- 2,001-2,500 m a.s.l.
- 2,501-3,000 m a.s.l.
- 3,001-4,000 m a.s.l.
- > 4,000 m a.s.l.
Indicate if the Technology is specifically applied in:
- not relevant
Comments and further specifications on topography:
Less than 10 degree (17%) slope
5.3 Soils
Soil depth on average:
- very shallow (0-20 cm)
- shallow (21-50 cm)
- moderately deep (51-80 cm)
- deep (81-120 cm)
- very deep (> 120 cm)
Soil texture (topsoil):
- medium (loamy, silty)
- fine/ heavy (clay)
Soil texture (> 20 cm below surface):
- medium (loamy, silty)
- fine/ heavy (clay)
Topsoil organic matter:
- medium (1-3%)
- low (<1%)
5.4 Water availability and quality
Ground water table:
5-50 m
Availability of surface water:
medium
Water quality (untreated):
good drinking water
Water quality refers to:
surface water
Is water salinity a problem?
No
Is flooding of the area occurring?
Yes
Regularity:
frequently
Comments and further specifications on water quality and quantity:
Soil water saturation occurs after 10 to 20 mm of rainfall. Runoff occurs rapidly. River and tributaries are predominantly dry, excepting upwellings and springs, and only flow after prolonged or severe rain events
5.5 Biodiversity
Species diversity:
- low
Habitat diversity:
- low
Comments and further specifications on biodiversity:
The Baviaanskloof region is specifically rich in biodiversity with a wide range of habitat units. Degradation has lead to low levels of diversity
5.6 Characteristics of land users applying the Technology
Sedentary or nomadic:
- Sedentary
Market orientation of production system:
- commercial/ market
Off-farm income:
- less than 10% of all income
Relative level of wealth:
- poor
Individuals or groups:
- individual/ household
- cooperative
Level of mechanization:
- manual work
- mechanized/ motorized
Gender:
- women
- men
Age of land users:
- youth
- middle-aged
5.7 Average area of land used by land users applying the Technology
- < 0.5 ha
- 0.5-1 ha
- 1-2 ha
- 2-5 ha
- 5-15 ha
- 15-50 ha
- 50-100 ha
- 100-500 ha
- 500-1,000 ha
- 1,000-10,000 ha
- > 10,000 ha
Is this considered small-, medium- or large-scale (referring to local context)?
- small-scale
- medium-scale
5.8 Land ownership, land use rights, and water use rights
Land ownership:
- communal/ village
- individual, titled
Land use rights:
- communal (organized)
- individual
Water use rights:
- communal (organized)
- individual
Are land use rights based on a traditional legal system?
Yes
Specify:
Land tenure is communal, many beneficiaries but one title deed. Shared water from common sources. Water use rights associated to title deeds
5.9 Access to services and infrastructure
health:
- poor
- moderate
- good
education:
- poor
- moderate
- good
technical assistance:
- poor
- moderate
- good
employment (e.g. off-farm):
- poor
- moderate
- good
markets:
- poor
- moderate
- good
energy:
- poor
- moderate
- good
roads and transport:
- poor
- moderate
- good
drinking water and sanitation:
- poor
- moderate
- good
financial services:
- poor
- moderate
- good
6. Impacts and concluding statements
6.1 On-site impacts the Technology has shown
Socio-economic impacts
Production
fodder production
Comments/ specify:
Increased soil moisture content and prolonged retention
fodder quality
Comments/ specify:
General biomass increase, pioneer species variable
production area
Comments/ specify:
Increased biomass on previously sealed and crusted soils
land management
Comments/ specify:
Slight increased production and maintenance.
Water availability and quality
water availability for livestock
Comments/ specify:
Increased infiltration, groundwater and surface water
Income and costs
workload
Socio-cultural impacts
community institutions
Comments/ specify:
Increased rangeland quality
SLM/ land degradation knowledge
Comments/ specify:
Consequences of overgrazing and subsequent erosion
Ecological impacts
Water cycle/ runoff
water quantity
Comments/ specify:
Reduction in runoff and siltation
harvesting/ collection of water
Comments/ specify:
Improved capture of surface runoff
surface runoff
Soil
soil moisture
Quantity before SLM:
5%
Quantity after SLM:
11.5%
Comments/ specify:
Gravametric soil moisture content increase (n=320; randomized pond vs control). The initial decrease is by cultivating soils to build the ponds
soil cover
Comments/ specify:
Significant increase of fractional green canopy cover
soil loss
Comments/ specify:
Decreased sheet erosion
soil accumulation
Comments/ specify:
Soil accumulation in the ponds
soil crusting/ sealing
Comments/ specify:
Localized
soil compaction
Comments/ specify:
Localized
Biodiversity: vegetation, animals
Vegetation cover
Comments/ specify:
Localized
biomass/ above ground C
Comments/ specify:
Localized
animal diversity
Quantity after SLM:
400%
Comments/ specify:
Insect diversity
Other ecological impacts
Plant recruitment
Comments/ specify:
Increase woody and herbaceous seedling recruitment
6.2 Off-site impacts the Technology has shown
downstream flooding
Comments/ specify:
Positive effect, reduced runoff
downstream siltation
Comments/ specify:
Positive effect, reduced siltation
6.3 Exposure and sensitivity of the Technology to gradual climate change and climate-related extremes/ disasters (as perceived by land users)
Gradual climate change
Gradual climate change
| Season | increase or decrease | How does the Technology cope with it? | |
|---|---|---|---|
| annual temperature | increase | moderately | |
| annual rainfall | decrease | moderately |
Climate-related extremes (disasters)
Meteorological disasters
| How does the Technology cope with it? | |
|---|---|
| local rainstorm | very well |
| local thunderstorm | well |
Climatological disasters
| How does the Technology cope with it? | |
|---|---|
| heatwave | well |
| drought | moderately |
| land fire | not known |
Hydrological disasters
| How does the Technology cope with it? | |
|---|---|
| general (river) flood | not well at all |
| flash flood | not well |
6.4 Cost-benefit analysis
How do the benefits compare with the establishment costs (from land users’ perspective)?
Short-term returns:
negative
Long-term returns:
slightly positive
How do the benefits compare with the maintenance/ recurrent costs (from land users' perspective)?
Short-term returns:
positive
Long-term returns:
very positive
6.5 Adoption of the Technology
- > 50%
If available, quantify (no. of households and/ or area covered):
600 ha
Of all those who have adopted the Technology, how many did so spontaneously, i.e. without receiving any material incentives/ payments?
- 0-10%
6.6 Adaptation
Has the Technology been modified recently to adapt to changing conditions?
Yes
If yes, indicate to which changing conditions it was adapted:
- climatic change/ extremes
Specify adaptation of the Technology (design, material/ species, etc.):
Packing with thorn brush from pruned pioneer trees (Vachelia karoo), planting of trees (Portulacaria afra) and seeding (Predominantly grass spp.)
6.7 Strengths/ advantages/ opportunities of the Technology
| Strengths/ advantages/ opportunities in the land user’s view |
|---|
| It creates employment opportunities for unskilled labourers |
| Plants return to barren areas |
| Increased grazing capacity for small stock |
| Strengths/ advantages/ opportunities in the compiler’s or other key resource person’s view |
|---|
| The technology is simple and extremely adaptable to ecological and economic variables through changes in density and dimension |
| The technology is relatively inexpensive and effective |
| The technology is relatively risk free when applied within application criteria |
6.8 Weaknesses/ disadvantages/ risks of the Technology and ways of overcoming them
| Weaknesses/ disadvantages/ risks in the land user’s view | How can they be overcome? |
|---|---|
| Production rates are slow, labourers require access to land to construct ponds for extended periods of time | Use larger labour forces to complete areas faster |
| Ponds are slow to revegetate in drought conditions | Seeding and brush-packing increase recruitment and survival rates |
| Unwanted pioneer weedy species may recruit and outcompete slower growing desired species | Seeding with or planting preferable pioneer species |
| Weaknesses/ disadvantages/ risks in the compiler’s or other key resource person’s view | How can they be overcome? |
|---|---|
| Ponds may silt up before recruiting new vegetation, particularly during heavy rain events and is highly dispersive soils | Apply more stringent site selection criteria based on climatic and soil conditions. Adjust pond size and density to reduce rate of siltation |
7. References and links
7.1 Methods/ sources of information
- field visits, field surveys
3 postgraduate research students
- interviews with land users
6 land owners
- interviews with SLM specialists/ experts
4 workshops
When were the data compiled (in the field)?
2019
Comments:
Data compiled between 2016 and 2019
7.2 References to available publications
Title, author, year, ISBN:
•Caring for Natural Rangelands, Ken Coetzee, University of KwaZulu-Natal Press, 2005, ISBN:1869140710, 9781869140717, 129 pages.
Available from where? Costs?
ZAR 129
Title, author, year, ISBN:
•De Abraeu,, P. 2011. Unpublished thesis. The effect of rehabilitation on ecosystem services in the semi-arid Succulent Karoo lowlands of the Little Karoo, South Africa. University of Cape Town, South Africa
Available from where? Costs?
http://www.pcu.uct.ac.za/sites/default/files/image_tool/images/192/de%20abreu%202010.pdf
7.3 Links to relevant online information
Title/ description:
Just dig it
URL:
www.justdigit.org https://www.youtube.com/watch?v=eXWVC3RKmb8
Title/ description:
Greener Land
URL:
http://www.greener.land/index.php/product/demi-lunes-semi-circular-bunds/
Title/ description:
Living Lands
URL:
www.livinglands.co.za https://youtu.be/BmhWMqEu-oU?list=PL4dQ3giQTjAxtMON61PFvLSIqrM7Xq_Jy
Title/ description:
Common Land
URL:
www.commonland.co.za
Title/ description:
•Environmental Monitoring Group
URL:
https://www.youtube.com/channel/UCjGScyyexvSqQVkJXtuat6w
Title/ description:
•UNDP GEF5 South Africa
URL:
https://www.za.undp.org/content/south_africa/en/home/operations/projects/environment_https://www.za.undp.org/content/south_africa/en/home/operations/projects/environment_and_energy/securing-multiple-ecosystems-benefit-through-sustainable-land-ma.htmland
Links and modules
Expand all Collapse allLinks
No links
Modules
No modules