Push-pull crop pest control [Kenya]
- Creation:
- Update:
- Compiler: William Akwanyi
- Editors: George Onyango, Innocent Faith, Noel Templer, JUSTINE OTSYULA
- Reviewers: William Critchley, Rima Mekdaschi Studer
technologies_6701 - Kenya
View sections
Expand all Collapse all1. General information
1.2 Contact details of resource persons and institutions involved in the assessment and documentation of the Technology
Key resource person(s)
land user:
Keya Andrew Mulaa
Welthungerhilfe farmer
Kenya
SLM specialist:
SLM specialist:
Name of project which facilitated the documentation/ evaluation of the Technology (if relevant)
Soil protection and rehabilitation for food security (ProSo(i)l)Name of the institution(s) which facilitated the documentation/ evaluation of the Technology (if relevant)
Deutsche Gesellschaft für Internationale Zusammenarbeit (GIZ)Name of the institution(s) which facilitated the documentation/ evaluation of the Technology (if relevant)
CIAT International Center for Tropical Agriculture (CIAT International Center for Tropical Agriculture) - Kenya1.3 Conditions regarding the use of data documented through WOCAT
The compiler and key resource person(s) accept the conditions regarding the use of data documented through WOCAT:
Yes
1.4 Declaration on sustainability of the described Technology
Is the Technology described here problematic with regard to land degradation, so that it cannot be declared a sustainable land management technology?
No
Comments:
The technology has not adversely affected the farms of farmers who have implemented the technology.
2. Description of the SLM Technology
2.1 Short description of the Technology
Definition of the Technology:
Push-pull technology is a strategy that controls pests, improves the productivity of cereal crops and fodder, and controls soil erosion.
2.2 Detailed description of the Technology
Description:
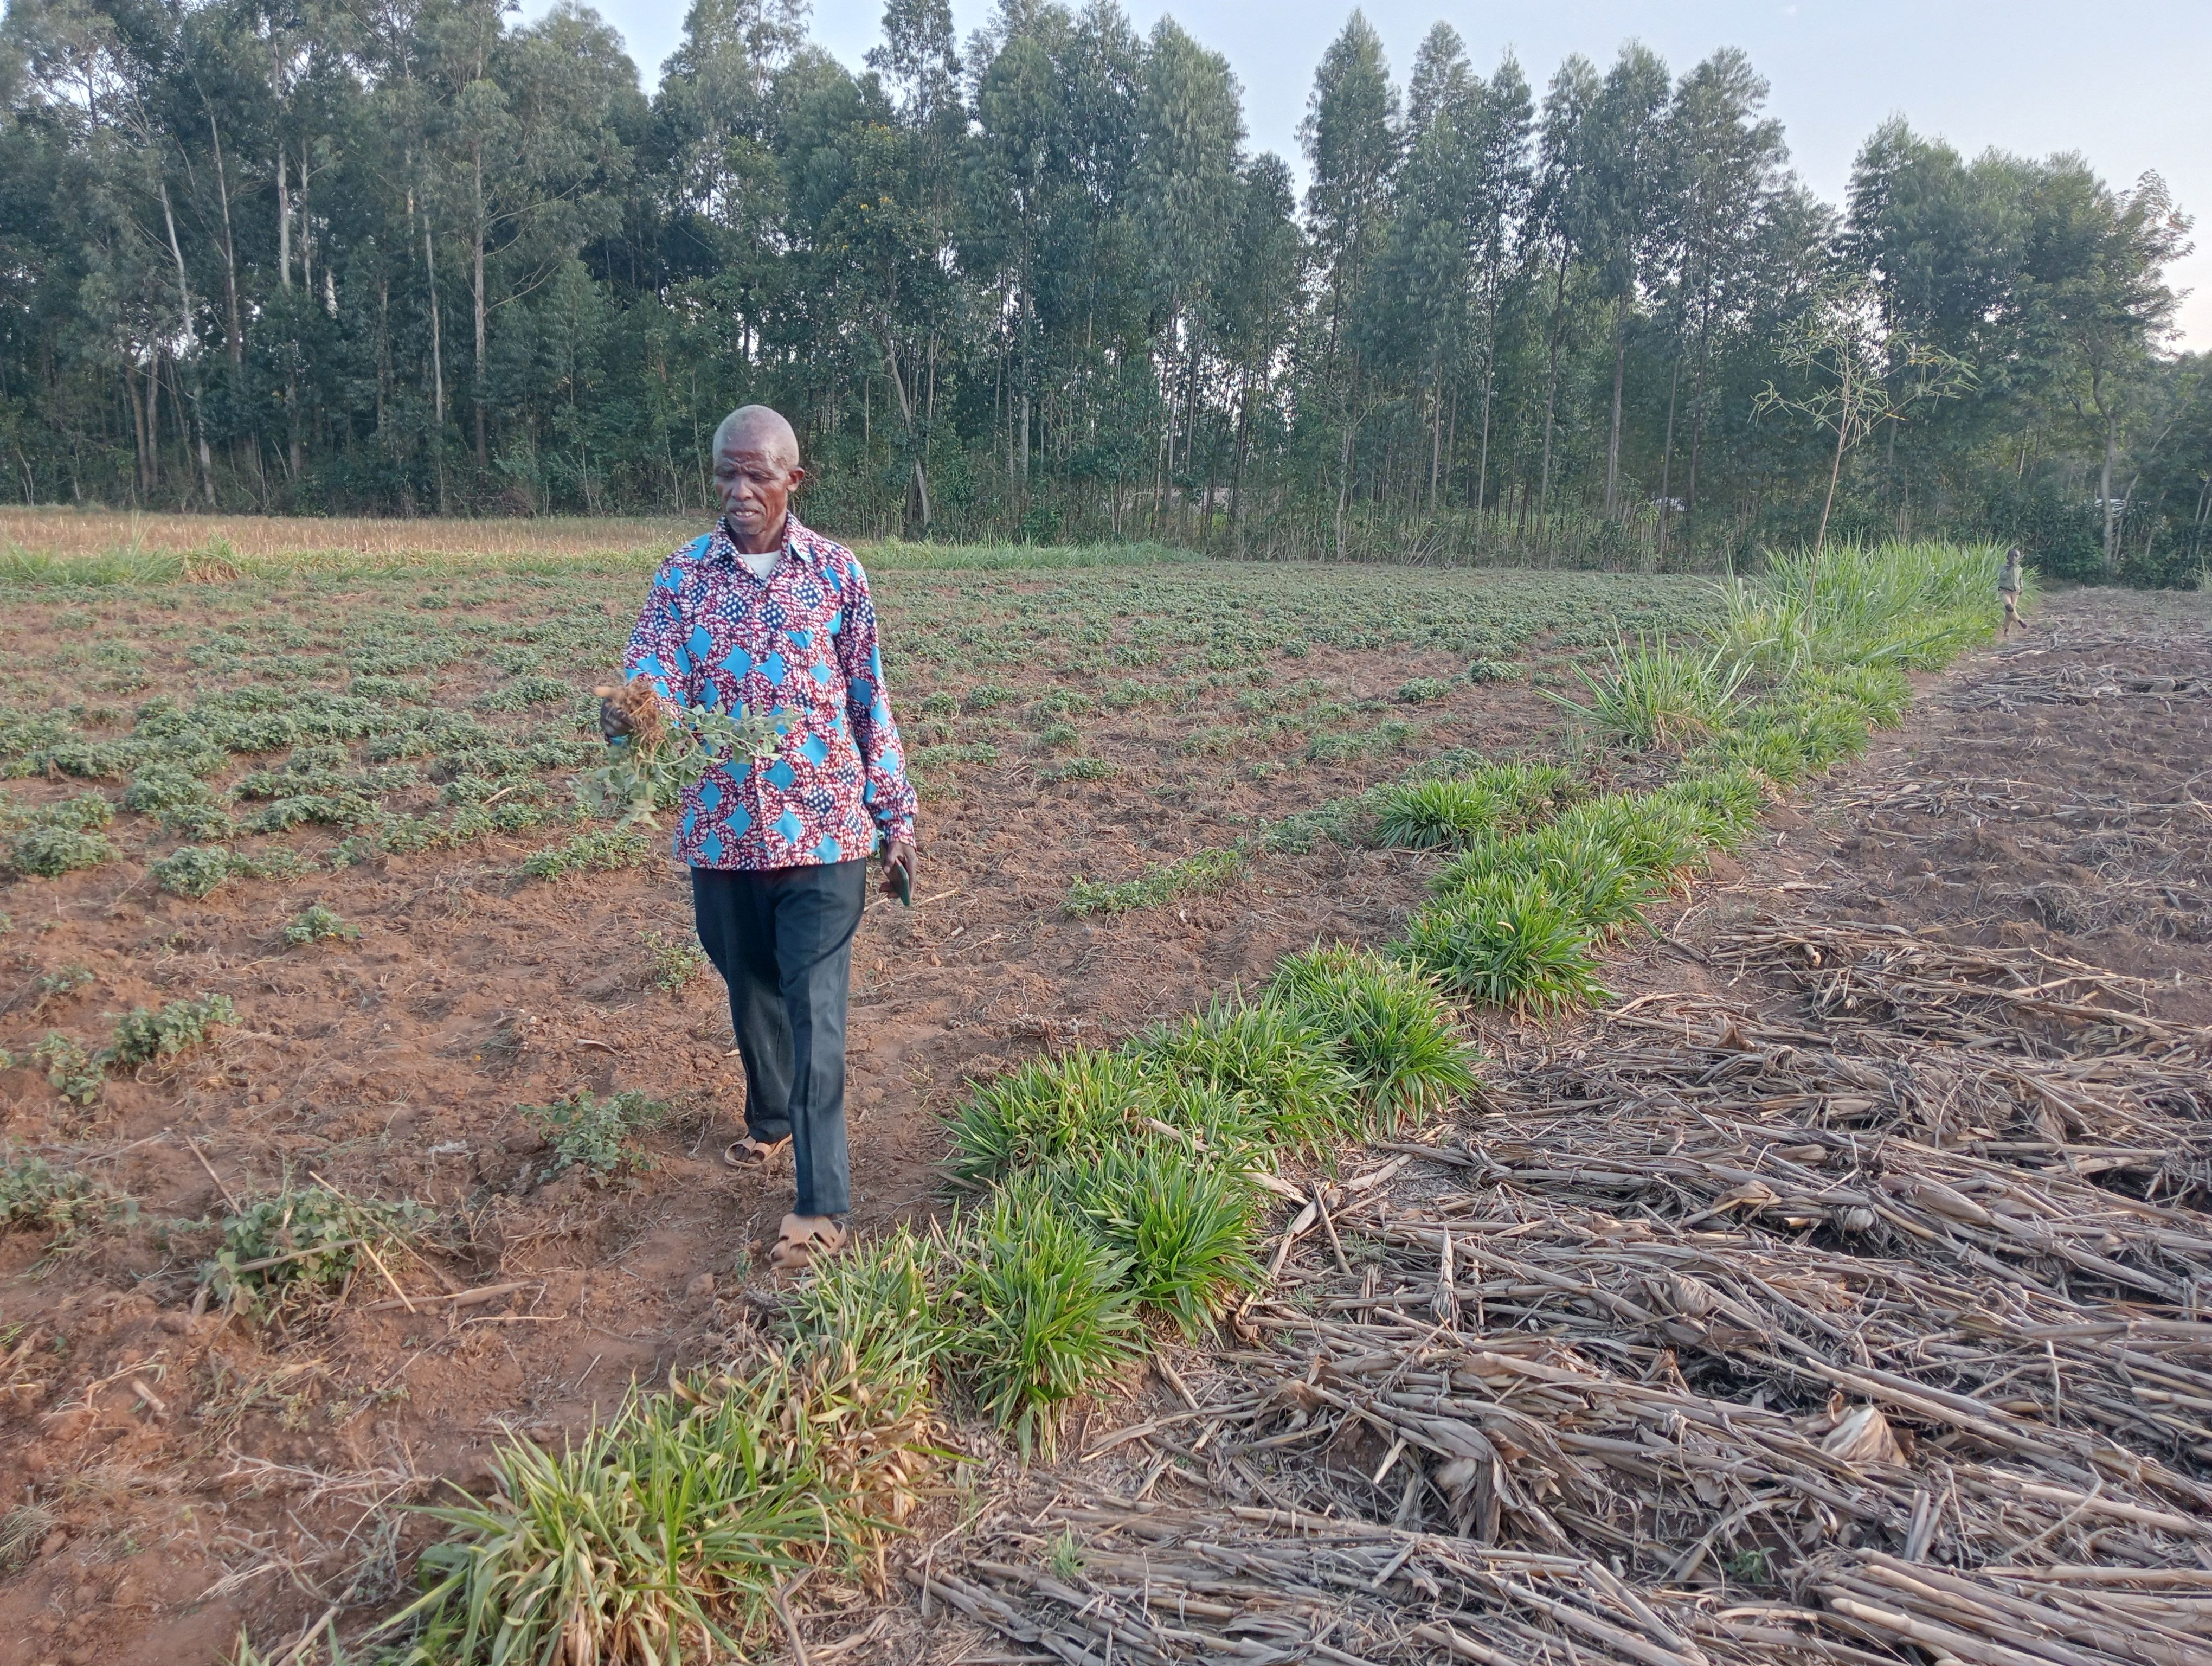
Push–pull technology was developed by the International Centre of Insect Physiology and Ecology (ICIPE) in collaboration with Rothamsted Research, (UK) in Kenya in the 1990s for the control of stemborer and striga weed in resource-poor maize farming systems. It is a strategy for controlling pests by using plants that repel them i.e., “push” crops and plants that trap pests i.e., “pull” crops. In Kakamega, Siaya, and Bungoma counties of western Kenya (i.e., the ProSoil project areas), the production of maize, millet, and sorghum has greatly been affected by poor soil fertility; insect pests, especially stemborer; and a parasitic weed called striga. Under the ProSoil project, Desmodium intortum is the main repellent “push” crop while napier grass (Pennisetum purpureum), brachiaria (Brachiaria decumbens), and mulatto (Brachiaria ruziziensis) are the main “pull” or trap plants.
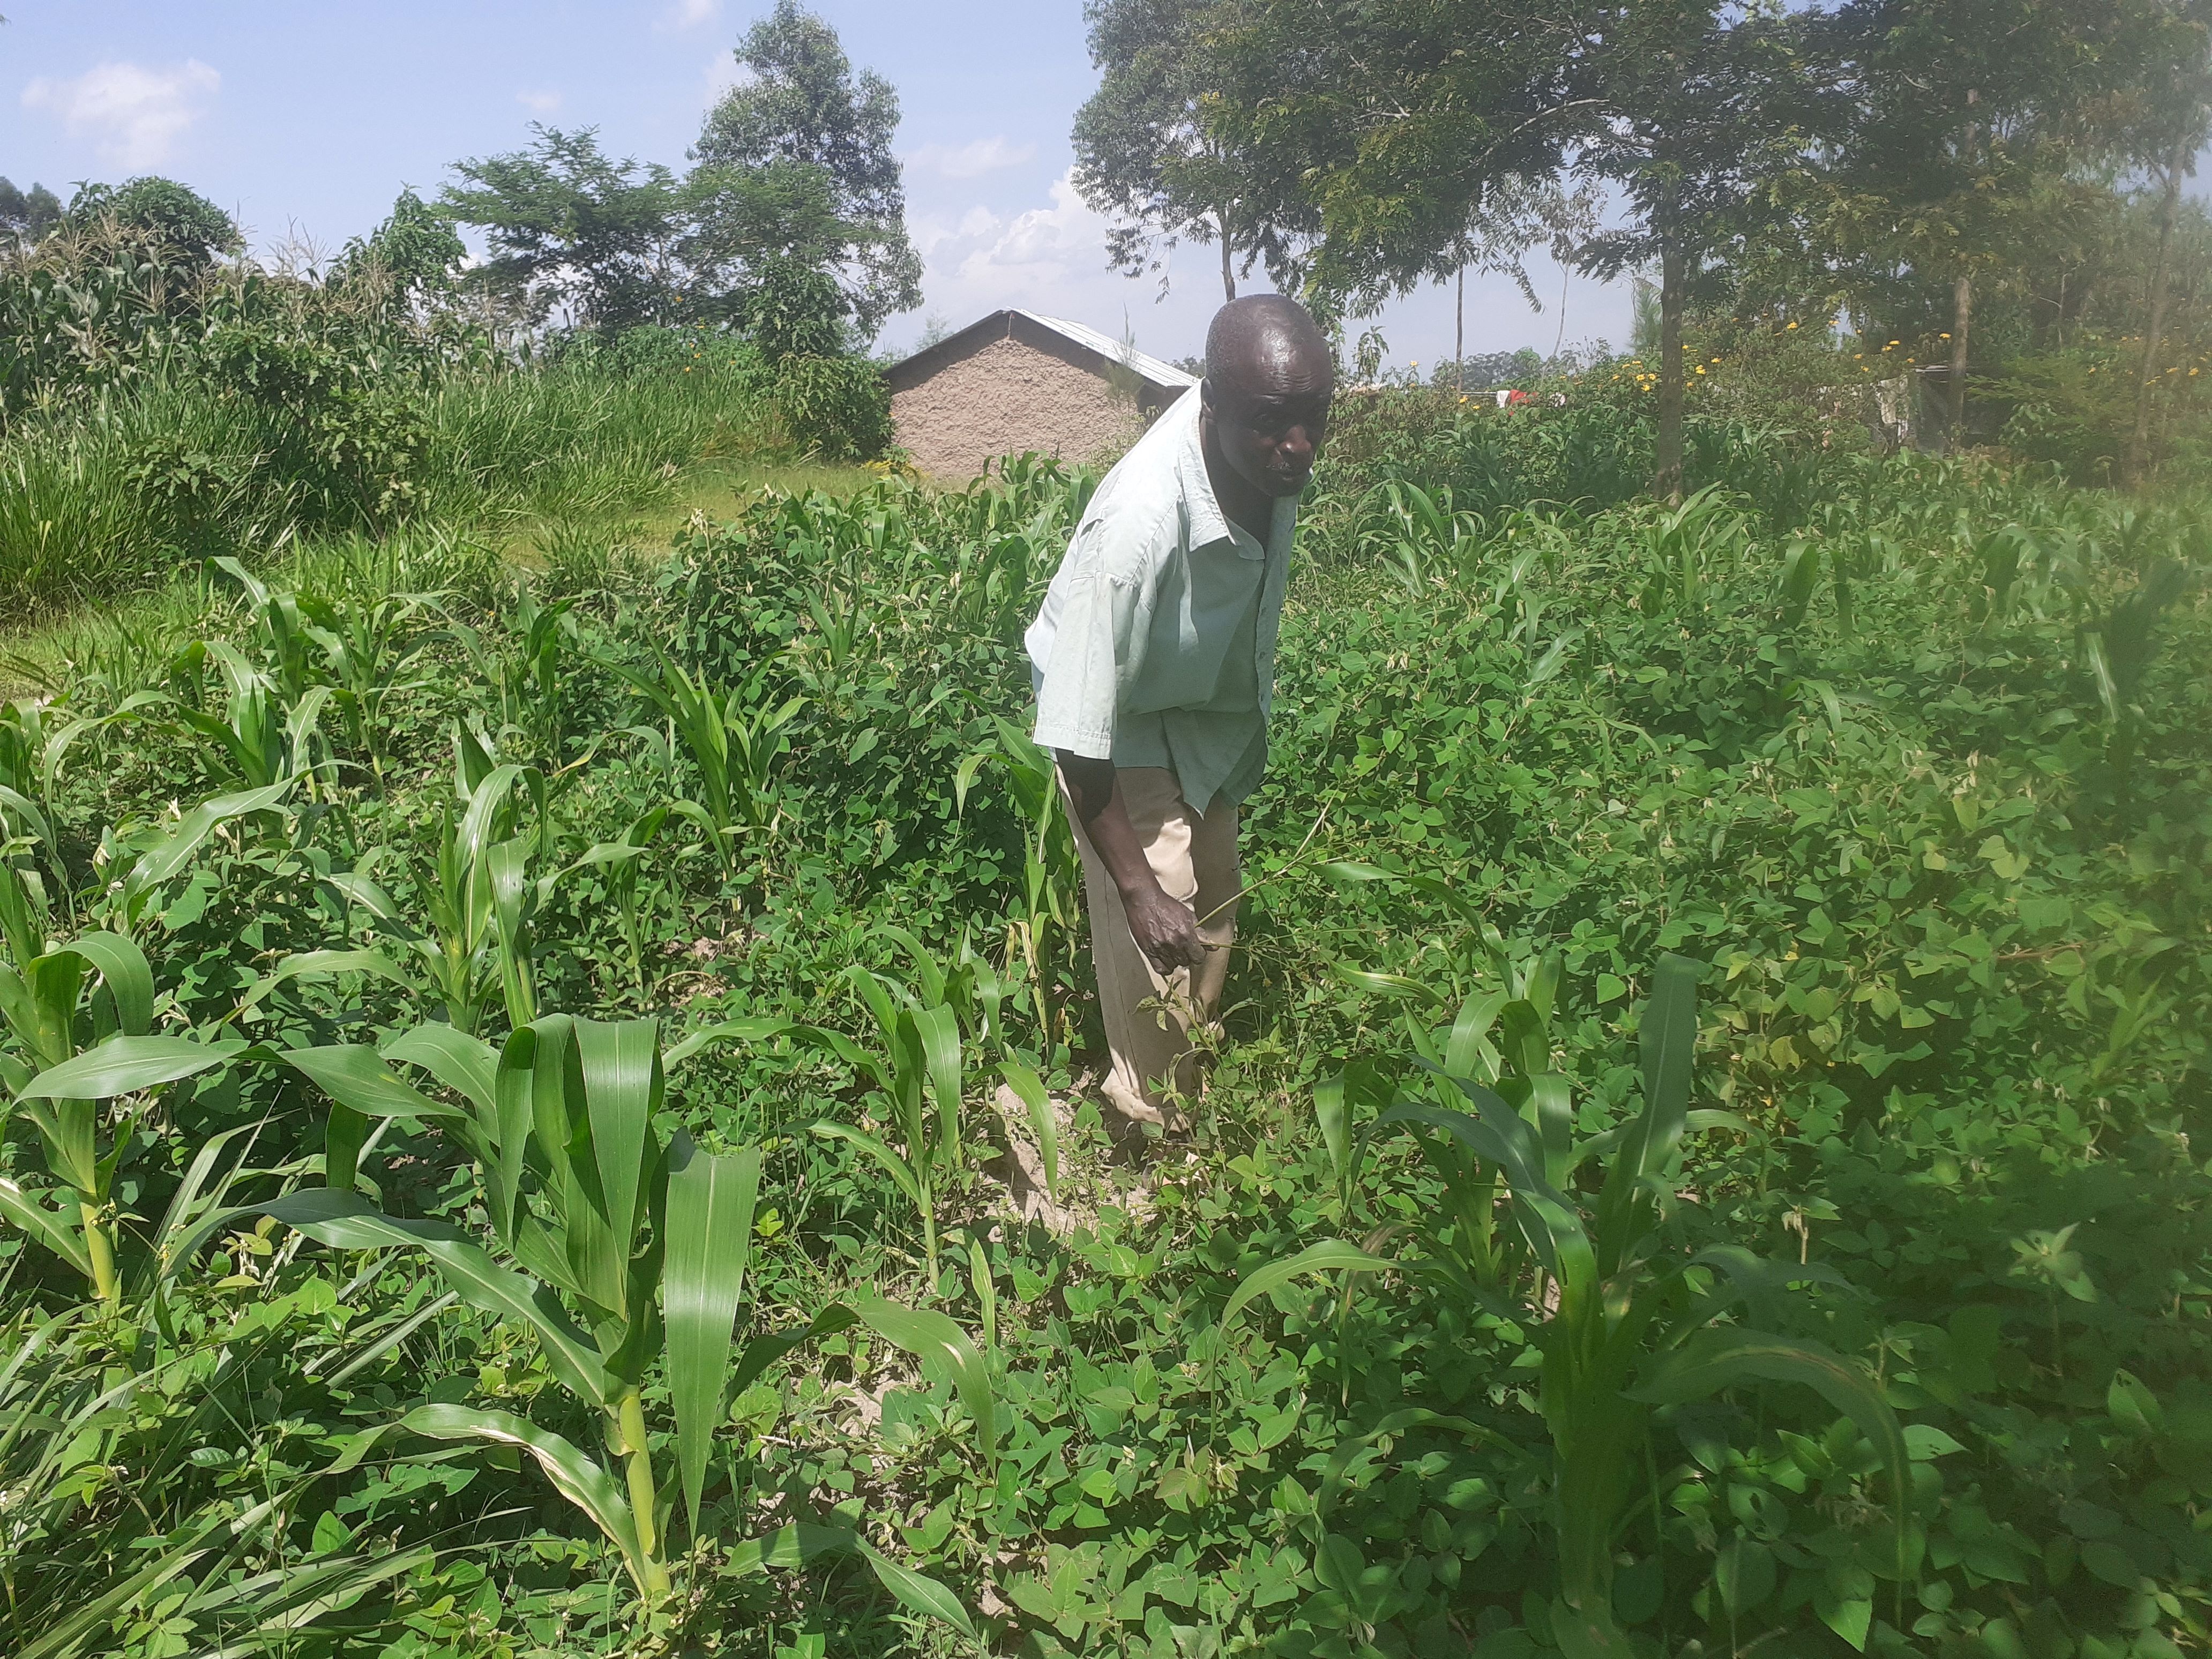
In a typical push-pull system, the attractant “pull” plant is planted as a border around the field where the main crop e.g., maize, millet, or sorghum has been intercropped with the “push” crop. Desmodium produces repellent volatile chemicals that push away stemborer moths from the main field towards the edge where there is the “pull” or trap crop. The attractant trap plant emits volatile compounds which serve as a haven for the stemborers. As the stemborer moths lay eggs on the pull/ trap plant (in this case bracharia) and the eggs hatch and develop into larvae or caterpillar stage, a sticky substance like glue secreted by the bracharia physically traps the larvae; hence, inhibiting further development. In addition, desmodium stimulates the germination of striga and then effectively inhibits its growth through its roots' exudates.
“Push-pull” technology improves the productivity of cereal crops, controls soil erosion, and contributes to conservation agriculture (minimum tillage). Desmodium and bracharia are both high-quality animal fodder plants and because of their perennial nature, they maintain ground cover. Bracharia is rich in crude protein. Desmodium is a leguminous green manure cover crop and, therefore, it fixes nitrogen in the soil and improves soil organic matter. Desmodium does not suppress the main crop since it is not a climber.
One acre (0.4 ha) of land (in a push-pull system) requires about 0.75 kg of desmodium seeds and about 0.5 kg of brachiaria seeds. Desmodium is planted at a spacing of 75 cm between rows and 60 cm between plants in the same row. The cereal crop is established in rows parallel to the desmodium crop rows (e.g., 75 cm from row to row and 30 cm from plant to plant in the same row for maize). Brachiaria is planted in two shallow trenches (50 cm apart) and because the seeds are very tiny, they are sown on the surface of the trenches and covered with a very thin layer of soil to keep them in place, in darkness, until they sprout. They are later thinned to give a spacing of 25 cm between plants.
2.3 Photos of the Technology
Media Gallery
2.4 Videos of the Technology
Comments, short description:
https://www.youtube.com/watch?v=QbX1RWBGZI4&ab_channel=WilliamOnura
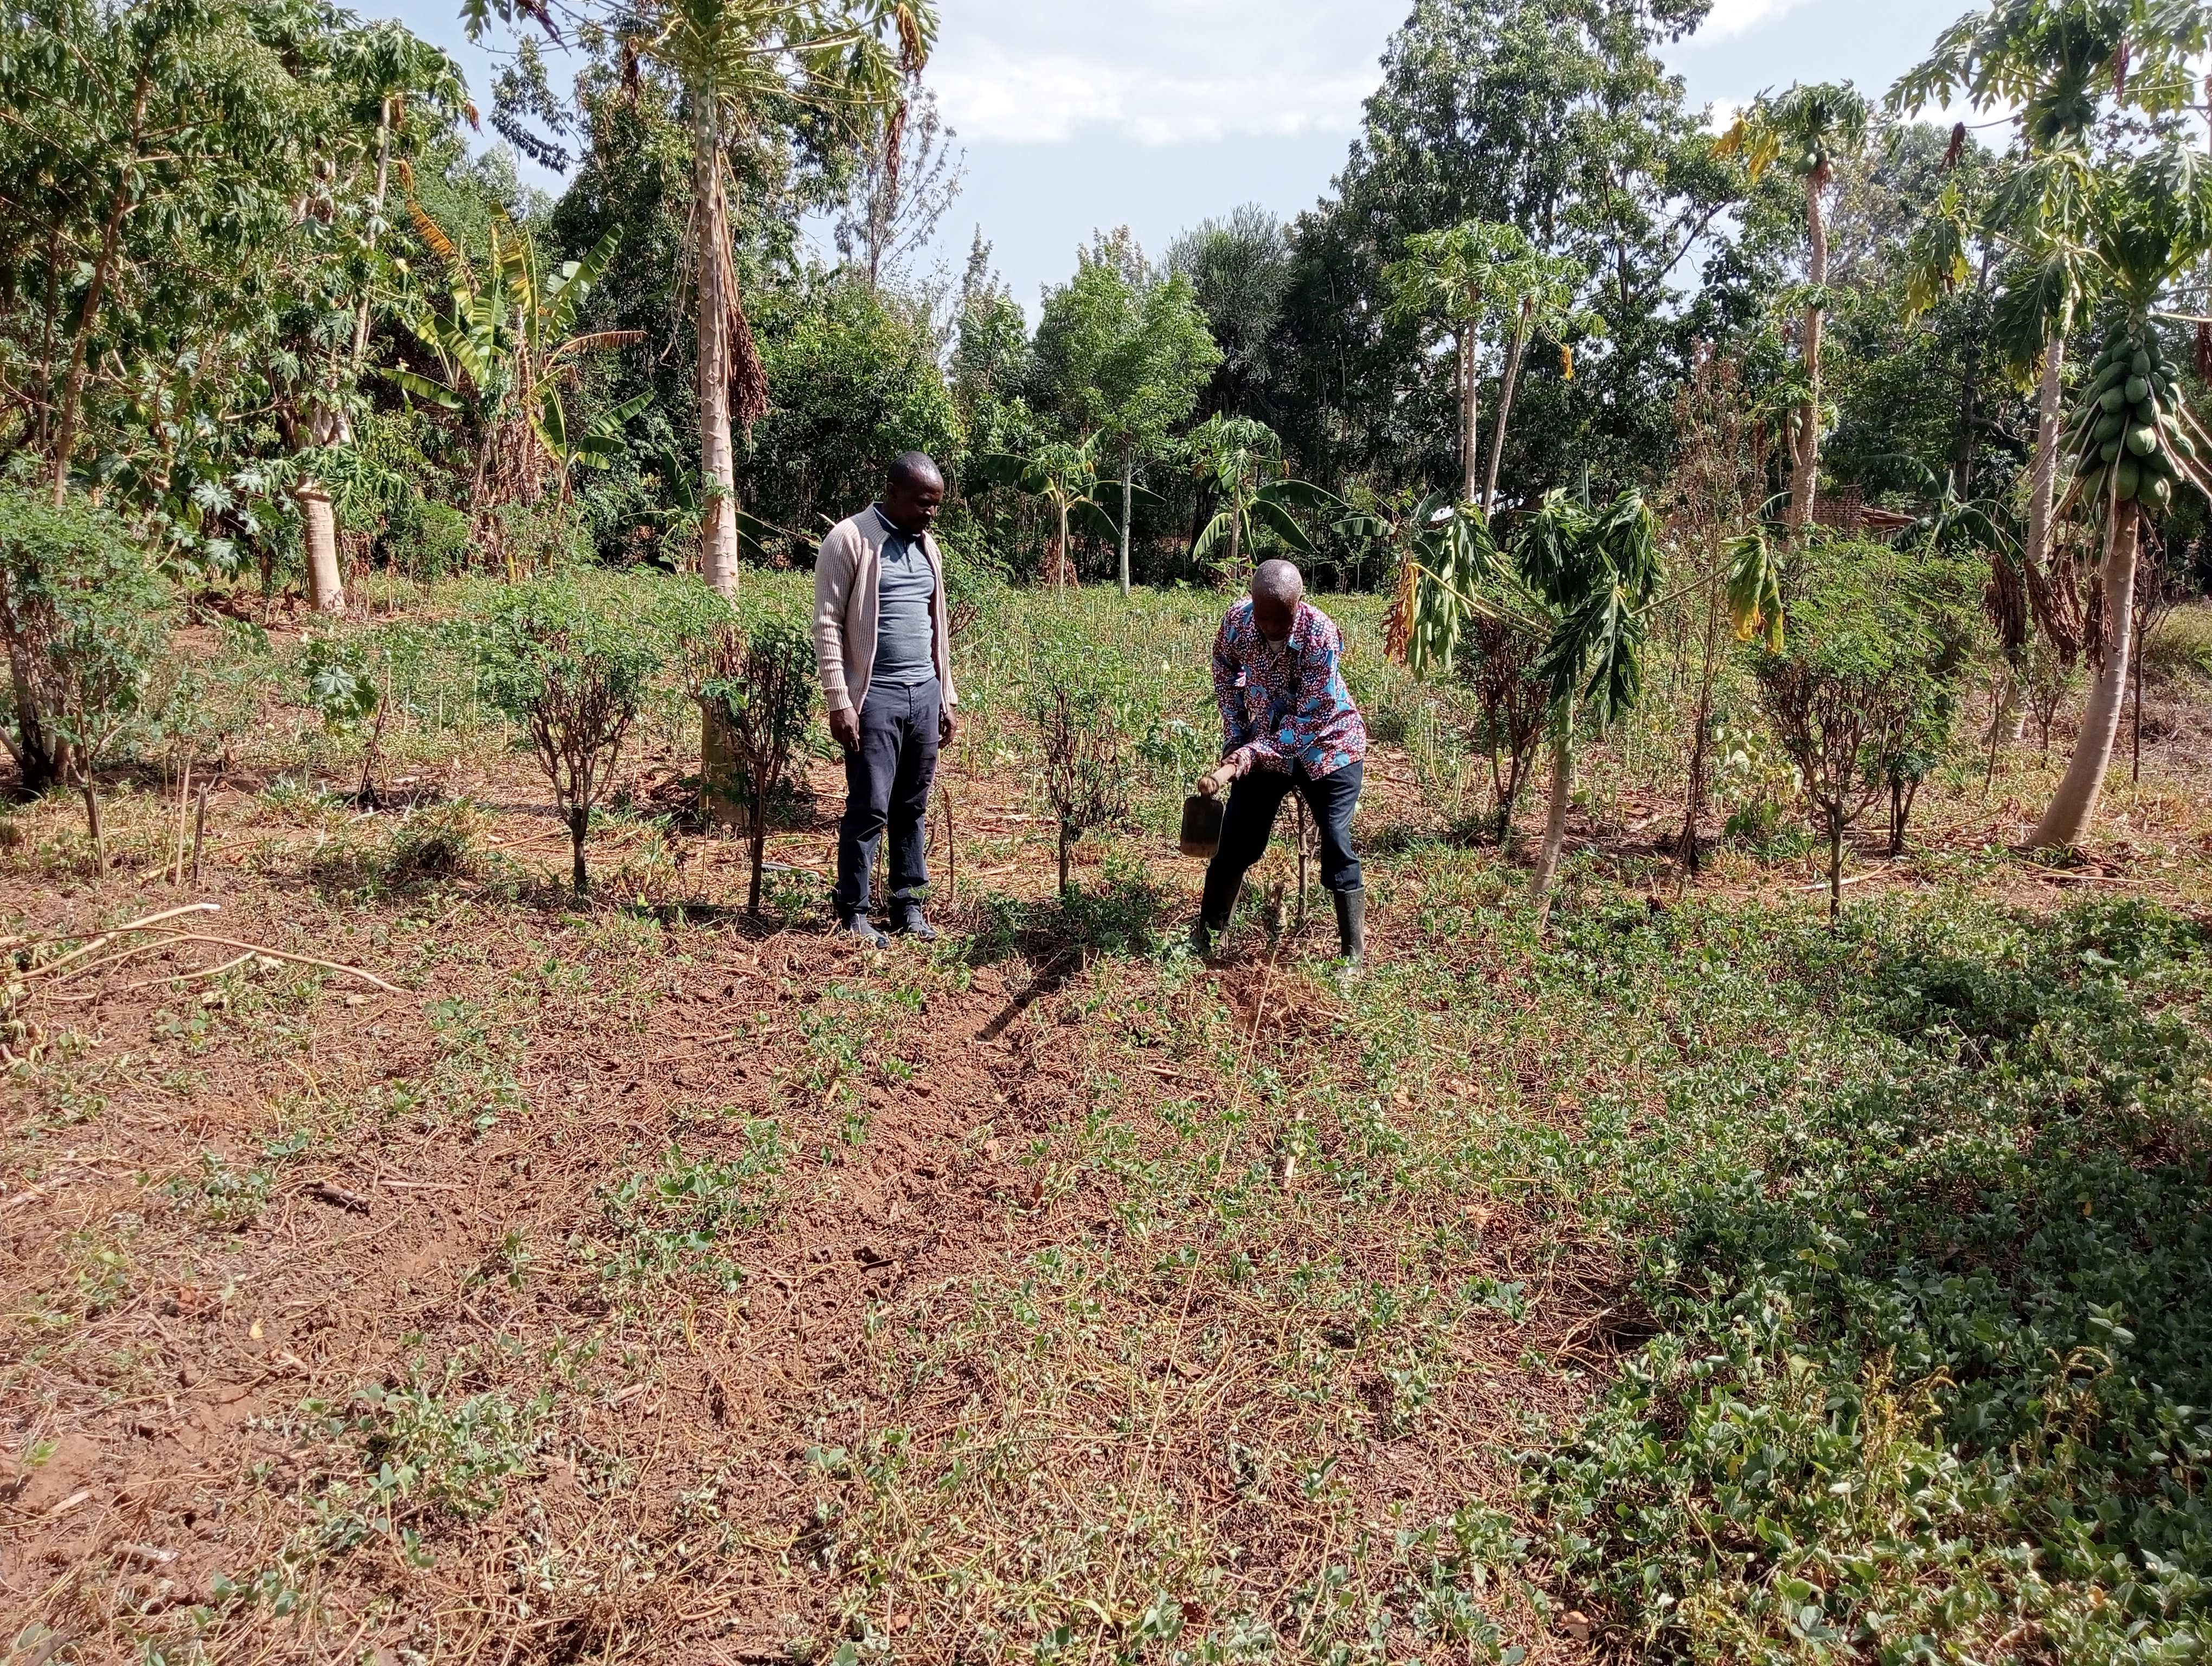
A farmer demonstrating how to prune desmodium roots using an African sword and how to break the ground/ soil using a chaka hoe.
Date:
11/02/2023
Location:
Andrew Mulla's farm in Lunyu Village, Khalaba Ward, Matungu Sub-county, in Kakamega County
Name of videographer:
William Akwanyi
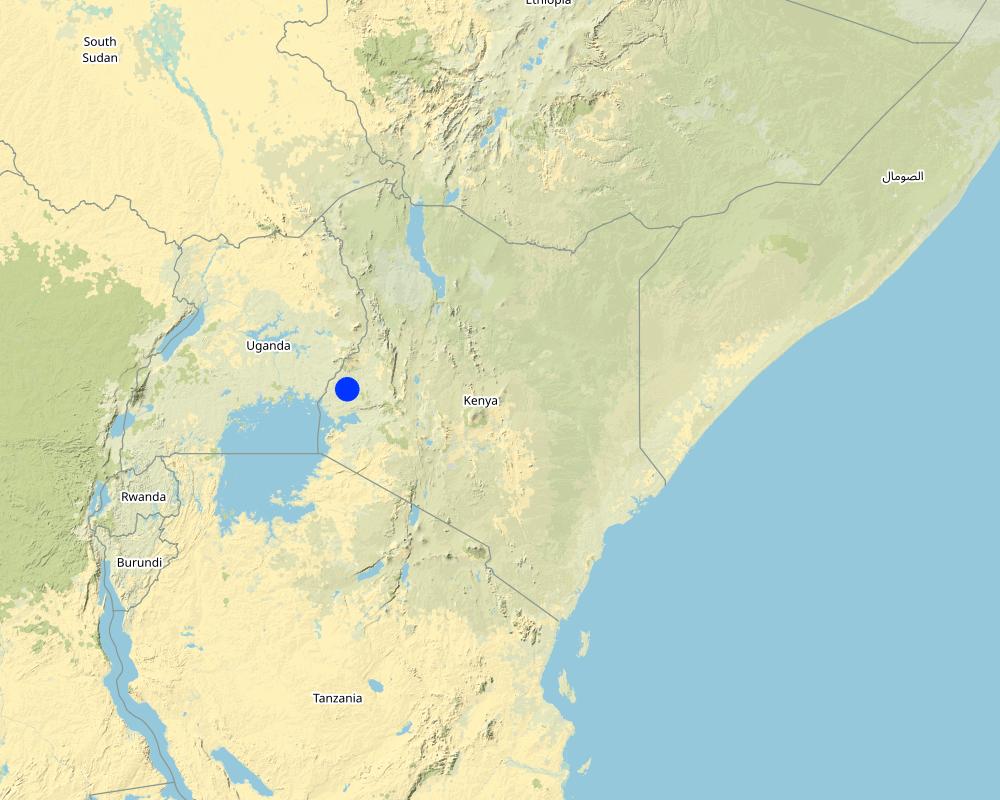
2.5 Country/ region/ locations where the Technology has been applied and which are covered by this assessment
Country:
Kenya
Region/ State/ Province:
Kakamega County in western Kenya
Further specification of location:
Khalaba Ward, Matungu Sub-county, in Kakamega County
Specify the spread of the Technology:
- evenly spread over an area
If precise area is not known, indicate approximate area covered:
- < 0.1 km2 (10 ha)
Is/are the technology site(s) located in a permanently protected area?
No
Comments:
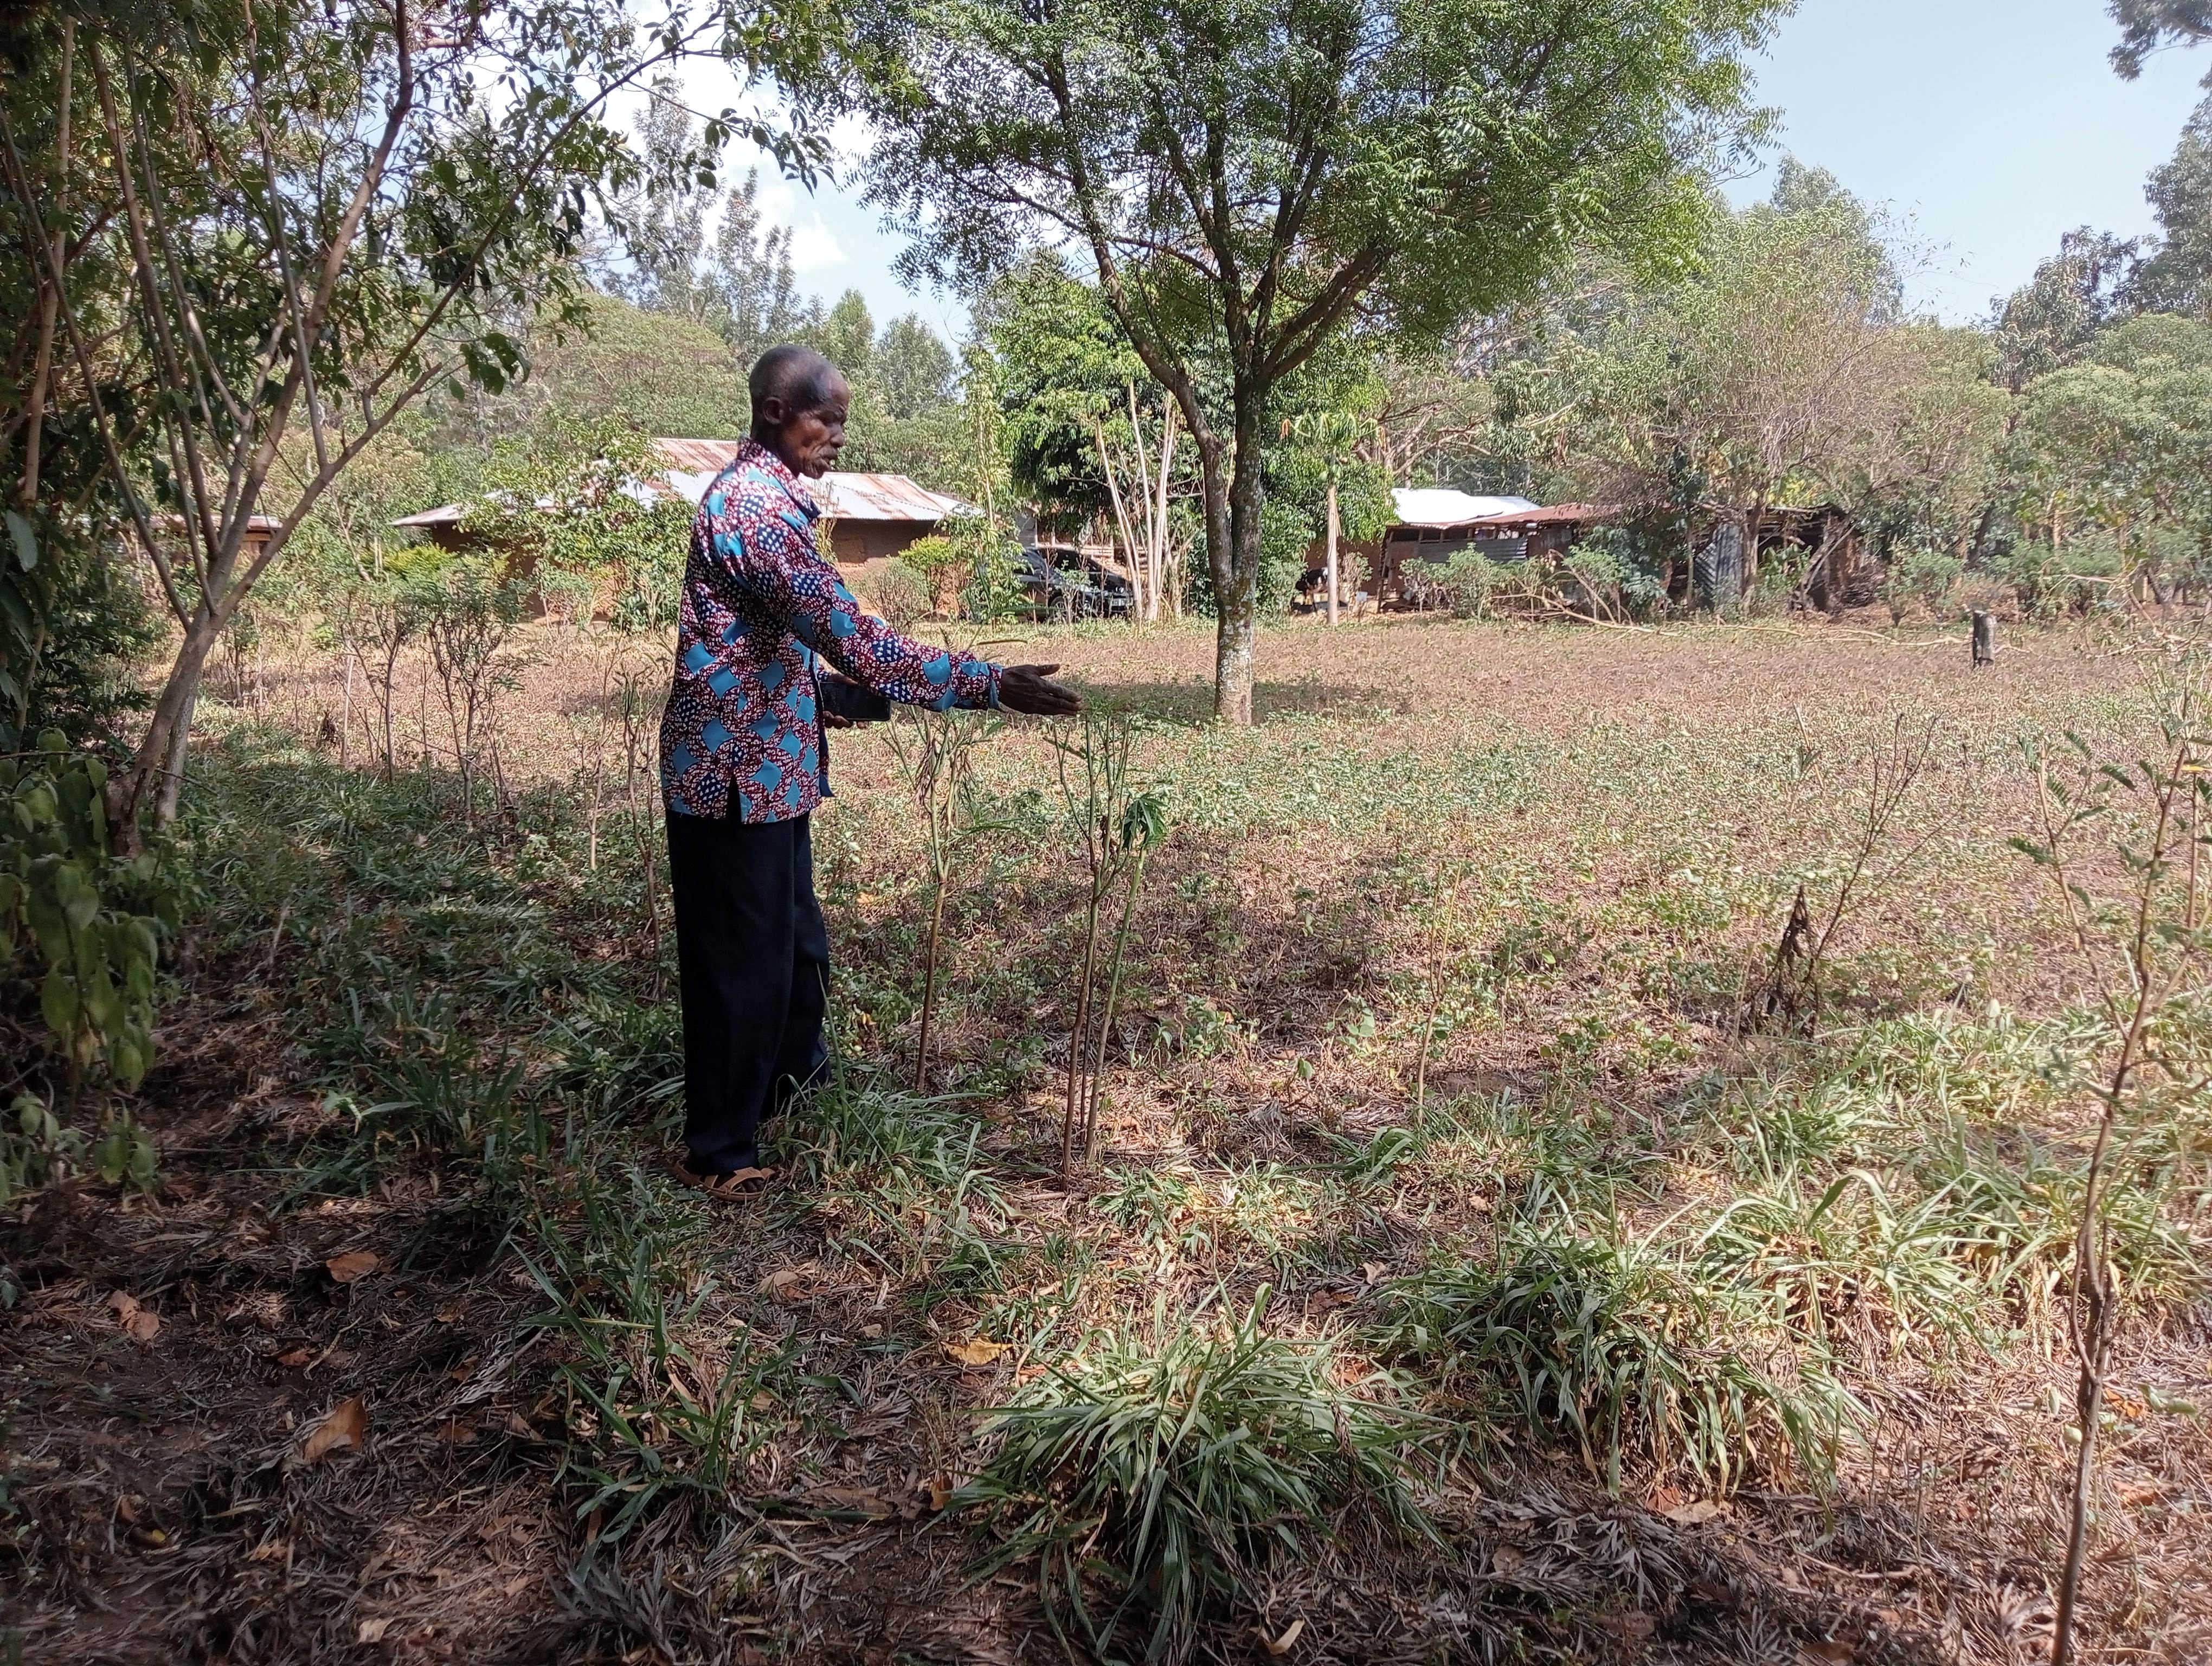
There are no protected areas in the areas covered by this assessment. The stated area is the total area of the two fields where the information that was used in this documentation was collected from. Only one field (Andrew's) was used for most of the documentation e.g., field measurements and costs estimation. Nice photos of the technology were taken in the other field (Patrick's).
Map
×2.6 Date of implementation
Indicate year of implementation:
2019
2.7 Introduction of the Technology
Specify how the Technology was introduced:
- through projects/ external interventions
Comments (type of project, etc.):
Technology introduced by the ProSoil project.
3. Classification of the SLM Technology
3.1 Main purpose(s) of the Technology
- improve production
- preserve/ improve biodiversity
- adapt to climate change/ extremes and its impacts
- mitigate climate change and its impacts
- create beneficial economic impact
3.2 Current land use type(s) where the Technology is applied
Land use mixed within the same land unit:
Yes
Specify mixed land use (crops/ grazing/ trees):
- Agro-silvopastoralism

Cropland
- Annual cropping
- Perennial (non-woody) cropping
- Tree and shrub cropping
Annual cropping - Specify crops:
- cereals - maize
- cereals - sorghum
- fodder crops - clover
- fodder crops - grasses
- legumes and pulses - beans
- vegetables - other
Annual cropping system:
Maize/sorghum/millet intercropped with legume
Perennial (non-woody) cropping - Specify crops:
- banana/plantain/abaca
- fodder crops - grasses
- fodder crops - legumes, clover
- sugar cane
Tree and shrub cropping - Specify crops:
- avocado
- fodder trees (Calliandra, Leucaena leucocephala, Prosopis, etc.)
- fruits, other
- mango, mangosteen, guava
- papaya
Number of growing seasons per year:
- 2
Specify:
Crops are grown during the long and short rain seasons.
Is intercropping practiced?
Yes
If yes, specify which crops are intercropped:
Cereal and legumes.
Is crop rotation practiced?
Yes
If yes, specify:
The push-pull plot is left fallow with only the repellant and attractant crops.

Grazing land
Intensive grazing/ fodder production:
- Cut-and-carry/ zero grazing
- Improved pastures
Animal type:
- cattle - dairy
- goats
- poultry
Is integrated crop-livestock management practiced?
Yes
If yes, specify:
Desmodium and napier grass are fodder crops - fed to livestock. Manure from the animals is applied on the cereal crops.
Products and services:
- economic security, investment prestige
- eggs
- manure as fertilizer/ energy production
- meat
- milk
Species:
cattle - dairy
Count:
3
Species:
poultry
Count:
55
Species:
goats
Count:
4
3.3 Has land use changed due to the implementation of the Technology?
Has land use changed due to the implementation of the Technology?
- No (Continue with question 3.4)
3.4 Water supply
Water supply for the land on which the Technology is applied:
- rainfed
Comments:
Crop establishment is dependent on availability of rainfall.
3.5 SLM group to which the Technology belongs
- rotational systems (crop rotation, fallows, shifting cultivation)
- integrated crop-livestock management
- integrated pest and disease management (incl. organic agriculture)
3.6 SLM measures comprising the Technology

agronomic measures
- A1: Vegetation/ soil cover
- A2: Organic matter/ soil fertility
- A3: Soil surface treatment

vegetative measures
- V2: Grasses and perennial herbaceous plants
3.7 Main types of land degradation addressed by the Technology

soil erosion by water
- Wt: loss of topsoil/ surface erosion
soil erosion by wind
- Et: loss of topsoil
3.8 Prevention, reduction, or restoration of land degradation
Specify the goal of the Technology with regard to land degradation:
- prevent land degradation
4. Technical specifications, implementation activities, inputs, and costs
4.1 Technical drawing of the Technology
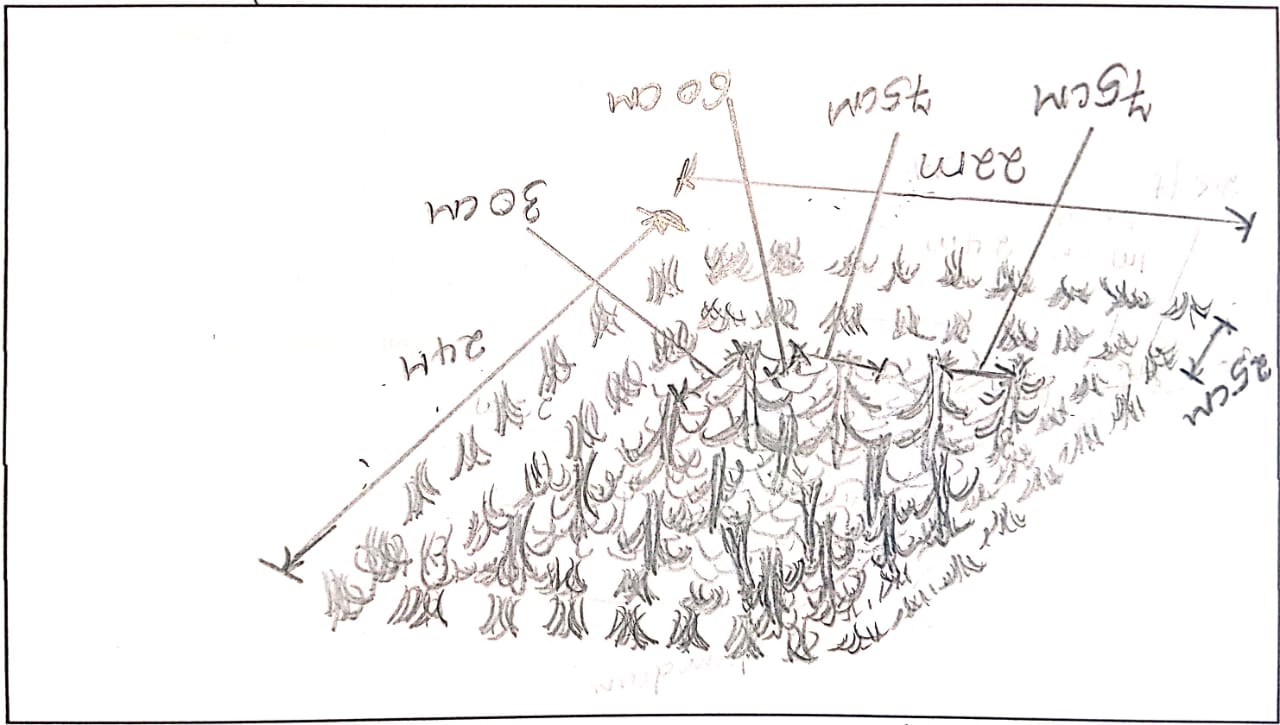
Technical specifications (related to technical drawing):
Trap crop at the edge (brachiaria): 50 cm x 25 cm
Repellant crop (desmodium): 75 cm x 60 cm
Cereal crop (maize intercropped with desmodium): 75 cm x 30 cm
Author:
William Akwanyi
Date:
11/02/2023
4.2 General information regarding the calculation of inputs and costs
Specify how costs and inputs were calculated:
- per Technology area
Indicate size and area unit:
0.0528 ha
other/ national currency (specify):
KES
If relevant, indicate exchange rate from USD to local currency (e.g. 1 USD = 79.9 Brazilian Real): 1 USD =:
124.21
Indicate average wage cost of hired labour per day:
KES 250.00
4.3 Establishment activities
| Activity | Timing (season) | |
|---|---|---|
| 1. | Land preparation | Before rains |
| 2. | Seed sourcing | Before rains |
| 3. | Planting | After rains |
Comments:
Land should be ploughed only when there are stubborn weeds.
4.4 Costs and inputs needed for establishment
| Specify input | Unit | Quantity | Costs per Unit | Total costs per input | % of costs borne by land users | |
|---|---|---|---|---|---|---|
| Labour | Land preparation | Man-days | 4.0 | 250.0 | 1000.0 | 100.0 |
| Equipment | Slasher | No. | 1.0 | 70.0 | 70.0 | |
| Equipment | African machete (panga) | No. | 1.0 | 80.0 | 80.0 | |
| Equipment | Jab planter | No. | 1.0 | 1000.0 | 1000.0 | |
| Plant material | Bracharia seeds | Kgs | 0.1 | 420.0 | 42.0 | |
| Plant material | Desmodium seeds | Kgs | 0.26 | 420.0 | 109.2 | |
| Plant material | Maize seeds | Kgs | 1.0 | 180.0 | 180.0 | 100.0 |
| Fertilizers and biocides | Manure | Wheelbarrows | 30.0 | 70.0 | 2100.0 | |
| Total costs for establishment of the Technology | 4581.2 | |||||
| Total costs for establishment of the Technology in USD | 36.88 | |||||
If land user bore less than 100% of costs, indicate who covered the remaining costs:
ProSoil project through Welthungerhilfe.
Comments:
The ProSoil project through Welthungerhilfe provided slashers, African swords, and jab planters to the farmers through their groups. The costs of these implements are KES 350/- for a slasher, KES 400/- for a panga (machete), and KES 5,000/- for a jab planter. It is assumed that the farmer will be able to use these implements over a period of 5 years before these implements will have depreciated to a point where they will not be useable. The cost is thus spread over the years when the farmer will be able to use the implement.
4.5 Maintenance/ recurrent activities
| Activity | Timing/ frequency | |
|---|---|---|
| 1. | Shallow weeding | Twice during maize crop growing period |
| 2. | Ripping | Before maize re-establishement |
| 3. | Root management | Before maize re-establishement |
4.6 Costs and inputs needed for maintenance/ recurrent activities (per year)
| Specify input | Unit | Quantity | Costs per Unit | Total costs per input | % of costs borne by land users | |
|---|---|---|---|---|---|---|
| Labour | Shallow weeding | Man-days | 2.0 | 250.0 | 500.0 | |
| Labour | Root management | Man-days | 2.0 | 250.0 | 500.0 | |
| Labour | Ripping | Man-days | 4.0 | 250.0 | 1000.0 | |
| Equipment | Shallow weeder | No. | 1.0 | 80.0 | 80.0 | |
| Equipment | Chaka hoe | No. | 1.0 | 130.0 | 130.0 | |
| Equipment | African machete (panga) | No. | 1.0 | 80.0 | 80.0 | |
| Total costs for maintenance of the Technology | 2290.0 | |||||
| Total costs for maintenance of the Technology in USD | 18.44 | |||||
If land user bore less than 100% of costs, indicate who covered the remaining costs:
ProSoil project through Welthungerhilfe.
Comments:
The ProSoil project through Welthungerhilfe provided Shallow weeders, pangas (machete), and chaka hoes to the farmers through their groups. The costs of these implements are KES 400/- for a slasher, KES 400/- for an African sword, and KES 650/- for a jab planter. It is assumed that the farmer will be able to use these implements over a period of 5 years before these implements will have depreciated to a point where they will not be useable. The cost is thus spread over the years when the farmer will be able to use the implement.
4.7 Most important factors affecting the costs
Describe the most determinate factors affecting the costs:
Rate of man-days vary from one place to another, farmer to farmer, and with type of work.
Exchange rate for February 2023, source: European Commission/ InfoEuro online at https://commission.europa.eu/funding-tenders/procedures-guidelines-tenders/information-contractors-and-beneficiaries/exchange-rate-inforeuro_en
5. Natural and human environment
5.1 Climate
Annual rainfall
- < 250 mm
- 251-500 mm
- 501-750 mm
- 751-1,000 mm
- 1,001-1,500 mm
- 1,501-2,000 mm
- 2,001-3,000 mm
- 3,001-4,000 mm
- > 4,000 mm
Specify average annual rainfall (if known), in mm:
1300.00
Specifications/ comments on rainfall:
Monthly rainfall variability is high with some months such as January recording less than 5 mm of total rainfall.
Indicate the name of the reference meteorological station considered:
Kakamega Meteorological Station
Agro-climatic zone
- humid
The climate in the area favours most agricultural activities.
5.2 Topography
Slopes on average:
- flat (0-2%)
- gentle (3-5%)
- moderate (6-10%)
- rolling (11-15%)
- hilly (16-30%)
- steep (31-60%)
- very steep (>60%)
Landforms:
- plateau/plains
- ridges
- mountain slopes
- hill slopes
- footslopes
- valley floors
Altitudinal zone:
- 0-100 m a.s.l.
- 101-500 m a.s.l.
- 501-1,000 m a.s.l.
- 1,001-1,500 m a.s.l.
- 1,501-2,000 m a.s.l.
- 2,001-2,500 m a.s.l.
- 2,501-3,000 m a.s.l.
- 3,001-4,000 m a.s.l.
- > 4,000 m a.s.l.
Indicate if the Technology is specifically applied in:
- not relevant
5.3 Soils
Soil depth on average:
- very shallow (0-20 cm)
- shallow (21-50 cm)
- moderately deep (51-80 cm)
- deep (81-120 cm)
- very deep (> 120 cm)
Soil texture (topsoil):
- medium (loamy, silty)
Soil texture (> 20 cm below surface):
- medium (loamy, silty)
Topsoil organic matter:
- medium (1-3%)
If available, attach full soil description or specify the available information, e.g. soil type, soil PH/ acidity, Cation Exchange Capacity, nitrogen, salinity etc.
Soil pH was 4.8 before push-pull was implented.
5.4 Water availability and quality
Ground water table:
5-50 m
Availability of surface water:
medium
Water quality (untreated):
good drinking water
Water quality refers to:
ground water
Is water salinity a problem?
No
Is flooding of the area occurring?
No
Comments and further specifications on water quality and quantity:
There are several boreholes in the area and according to interviews with some borehole owners, the depths are not more than 50 metres.
5.5 Biodiversity
Species diversity:
- high
Habitat diversity:
- high
Comments and further specifications on biodiversity:
Most farms are under crops and trees therefore the agrobiodiversity is high.
5.6 Characteristics of land users applying the Technology
Sedentary or nomadic:
- Sedentary
Market orientation of production system:
- mixed (subsistence/ commercial)
Off-farm income:
- > 50% of all income
Relative level of wealth:
- average
Individuals or groups:
- individual/ household
Level of mechanization:
- manual work
Gender:
- women
- men
Age of land users:
- youth
- middle-aged
- elderly
5.7 Average area of land used by land users applying the Technology
- < 0.5 ha
- 0.5-1 ha
- 1-2 ha
- 2-5 ha
- 5-15 ha
- 15-50 ha
- 50-100 ha
- 100-500 ha
- 500-1,000 ha
- 1,000-10,000 ha
- > 10,000 ha
Is this considered small-, medium- or large-scale (referring to local context)?
- medium-scale
5.8 Land ownership, land use rights, and water use rights
Land ownership:
- individual, not titled
- individual, titled
Land use rights:
- leased
- individual
Water use rights:
- communal (organized)
Are land use rights based on a traditional legal system?
No
Comments:
The farmer has a title for his piece of land. He also leases other people's pieces of land for farming. Water in the streams and springs is freely accessed with restrictions.
5.9 Access to services and infrastructure
health:
- poor
- moderate
- good
education:
- poor
- moderate
- good
technical assistance:
- poor
- moderate
- good
employment (e.g. off-farm):
- poor
- moderate
- good
markets:
- poor
- moderate
- good
energy:
- poor
- moderate
- good
roads and transport:
- poor
- moderate
- good
drinking water and sanitation:
- poor
- moderate
- good
financial services:
- poor
- moderate
- good
Comments:
The above rating varies from one village to the other.
6. Impacts and concluding statements
6.1 On-site impacts the Technology has shown
Socio-economic impacts
Production
crop production
Quantity before SLM:
2
Quantity after SLM:
5
Comments/ specify:
Quantity refers to the number of 90 Kg bags of maize produced per acre. Based on the farmer's experience.
crop quality
Comments/ specify:
Not easy to quantify. The crops do better compared to the past. Based on the farmer's estimate.
fodder production
Quantity before SLM:
0
Quantity after SLM:
10
Comments/ specify:
Quantity refers to amount of bracharia and desmodium in tonnes per year. Based on the farmer's estimate.
fodder quality
Comments/ specify:
Not easy to quantify. Fodder does better compared to how it was before the technology. Based on the farmer's estimate.
animal production
Quantity before SLM:
2
Quantity after SLM:
8
Comments/ specify:
Quantity refers to the amount of milk in litres from one cow. Based on the farmer's estimate.
risk of production failure
Quantity before SLM:
70
Quantity after SLM:
30
Comments/ specify:
Quantity refers to the percentage probability of the crop failing to do well. Based on the farmer's estimate.
land management
Comments/ specify:
Not easy to quantify but it is easier to prepare land through no tillage than to plough. Based on the farmer's estimate.
Income and costs
expenses on agricultural inputs
Quantity before SLM:
7,000
Quantity after SLM:
0
Comments/ specify:
Quantity refers to the amount of money in Kenya shillings spend on inorganic fertilizers in a season. The farmer no longer buys money inorganic fertilizers.
farm income
Quantity before SLM:
1,000
Quantity after SLM:
15,000
Comments/ specify:
Quantity refers to amount of money from farming per year.
diversity of income sources
Quantity before SLM:
2
Quantity after SLM:
4
Comments/ specify:
Quantity refers to the number of household income sources. Based on the farmer's estimate.
workload
Comments/ specify:
Not easy to quantify but it is easier to prepare land through no tillage than to plough. Based on the farmer's estimate.
Socio-cultural impacts
food security/ self-sufficiency
Quantity before SLM:
1
Quantity after SLM:
0
Comments/ specify:
Quantity refers to the number of months in a year when there is total lack of food in the house, and the farmer has to buy all the food required in the house.
SLM/ land degradation knowledge
Quantity before SLM:
20
Quantity after SLM:
80
Comments/ specify:
Quantity refers to the estimated percentage of knowledge in SLM/ land management. Based on the farmer's estimate. He says his SLM knowledge has greatly increased.
Ecological impacts
Soil
soil moisture
Quantity before SLM:
10
Quantity after SLM:
30
Comments/ specify:
Quantity refers to the farmer's estimated soil moisture content during the dry season when soil moisture challenges are expected to be high.
soil cover
Quantity before SLM:
20
Quantity after SLM:
70
Comments/ specify:
Quantity refers to the farmer's estimated percentage soil cover at the farm.
soil loss
Comments/ specify:
Not easy for the farmer to quantify. Based on the farmer's estimate. Soil erosion has been controlled to some considerable degree at the farm.
soil accumulation
Comments/ specify:
Not easy for the farmer to quantify. Based on the farmer's estimate.
soil organic matter/ below ground C
Quantity before SLM:
20
Quantity after SLM:
60
Comments/ specify:
Quantity refers to the farmer's estimated percentage of organic matter at the farm.
Biodiversity: vegetation, animals
Vegetation cover
Quantity before SLM:
30
Quantity after SLM:
60
Comments/ specify:
Quantity refers to the farmer's estimated percentage vegetation cover at the farm.
plant diversity
Quantity before SLM:
6
Quantity after SLM:
20
Comments/ specify:
Quantity refers to the number of plants (crops) that the farmer establishes at the farm.
habitat diversity
Comments/ specify:
Not easy for the farmer to quantify. The number of plants at the farm has increased.
Specify assessment of on-site impacts (measurements):
No recorded data is available for reference. All are estimates based on the farmer's explanation or as given by him.
6.2 Off-site impacts the Technology has shown
buffering/ filtering capacity
Comments/ specify:
Not easy for the farmer to quantify.
6.3 Exposure and sensitivity of the Technology to gradual climate change and climate-related extremes/ disasters (as perceived by land users)
Gradual climate change
Gradual climate change
| Season | increase or decrease | How does the Technology cope with it? | |
|---|---|---|---|
| annual temperature | increase | well | |
| seasonal temperature | dry season | increase | well |
Climate-related extremes (disasters)
Biological disasters
| How does the Technology cope with it? | |
|---|---|
| insect/ worm infestation | very well |
6.4 Cost-benefit analysis
How do the benefits compare with the establishment costs (from land users’ perspective)?
Short-term returns:
very positive
Long-term returns:
very positive
How do the benefits compare with the maintenance/ recurrent costs (from land users' perspective)?
Short-term returns:
very positive
Long-term returns:
very positive
6.5 Adoption of the Technology
- 1-10%
Of all those who have adopted the Technology, how many did so spontaneously, i.e. without receiving any material incentives/ payments?
- 91-100%
6.6 Adaptation
Has the Technology been modified recently to adapt to changing conditions?
No
6.7 Strengths/ advantages/ opportunities of the Technology
| Strengths/ advantages/ opportunities in the land user’s view |
|---|
| Controls pests and weeds (striga). |
| Controls soil erosion. |
| Reduces workload due to permanent cover on the soil - minimum tillage. |
| Desmodium does not interfere with the cereal crop. |
6.8 Weaknesses/ disadvantages/ risks of the Technology and ways of overcoming them
| Weaknesses/ disadvantages/ risks in the land user’s view | How can they be overcome? |
|---|---|
| Can be problematic if desmodium roots are not managed. | Root pruning before cereal crop establishment. |
7. References and links
7.1 Methods/ sources of information
- field visits, field surveys
Visit to two farms, only one farmer provided farm-based information used for this documentation.
- interviews with land users
One farmer interviewed at his farm. Follow-up questions on phone.
- interviews with SLM specialists/ experts
ProSoil team and project implementers from GFA consulted.
- compilation from reports and other existing documentation
two online sources reviewed.
When were the data compiled (in the field)?
11/02/2023
7.2 References to available publications
Title, author, year, ISBN:
Soil cover
Available from where? Costs?
Free download at http://www.act-africa.org/image/05SOIL~1.PDF
7.3 Links to relevant online information
Title/ description:
Push-Pull Technology
URL:
http://www.icipe.org/impacts/demonstration-research-impacts-communities/push-pull-technology#:~:text=Cereals%2C%20which%20include%20maize%2C%20sorghum,sub%20Saharan%20Africa%20(SSA).
7.4 General comments
1. Provide a function to be able to link the documented SLM to similar work that has been documented in other databases e.g., LandPortal, UNCCD, etc.
2. Some of the impacts (section 6) cannot be quantified.
Links and modules
Expand all Collapse allLinks
No links
Modules
No modules