No-till with controlled traffic [أستراليا]
- تاريخ الإنشاء:
- تحديث:
- جامع المعلومات: Des McGarry
- المحرر: –
- المراجعون: Alexandra Gavilano, Fabian Ottiger
no-till, permanent uncropped wheel tracks,eliminate soil compaction, judiciois spraying
technologies_945 - أستراليا
عرض الأقسام
توسيع الكل طي الكل1. معلومات عامة
1.2 تفاصيل الاتصال بالأشخاص الرئيسيين لمصدر المعلومات والمؤسسات المشاركة في تقييم وتوثيق التقنية
متخصص في الإدارة المستدامة للأراضي:
Griffith Noel
اسم المشروع الذي سهّل توثيق/تقييم التقنية (إذا كان ذلك على صلة)
Book project: where the land is greener - Case Studies and Analysis of Soil and Water Conservation Initiatives Worldwide (where the land is greener)1.3 الشروط المتعلقة باستخدام البيانات الموثقة من خلال WOCAT
يوافق جامع المعلومات والشخص (لاشخاص) الرئيسي لمصدر المعلومات على الشروط المتعلقة باستخدام البيانات الموثقة من خلال WOCAT:
نعم
1.4 إعلان بشأن استدامة التقنية الموصوفة
هل التقنية الموصوفة هنا تمثل مشكلة فيما يتعلق بتدهور الأراضي، بحيث لا يمكن إعلانها تقنية مستدامة لإدارة الأراضي؟:
كلا
2. وصف تقنيةالإدارة المستدامي للأراضي
2.1 وصف مختصر للتقنية
تعريف التقنية:
Large-scale no-till grain production with permanent wheel tracks
common to all on-farm equipment.
2.2 وصف تفصيلي للتقنية
الوصف:
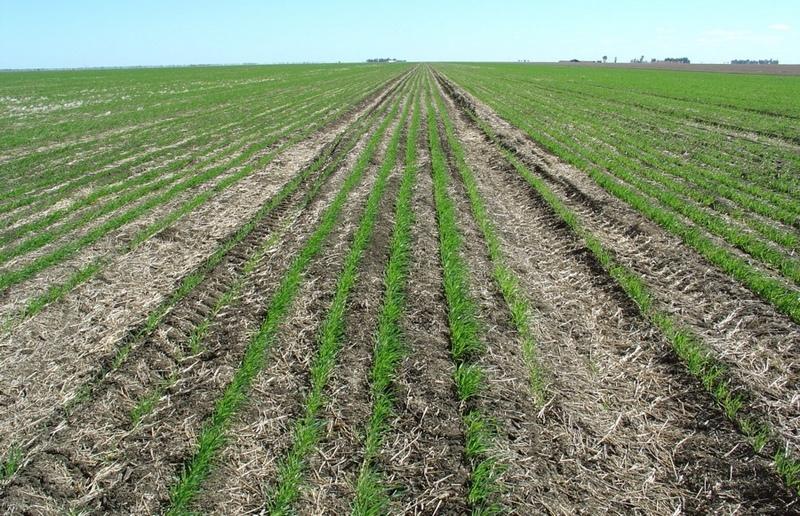
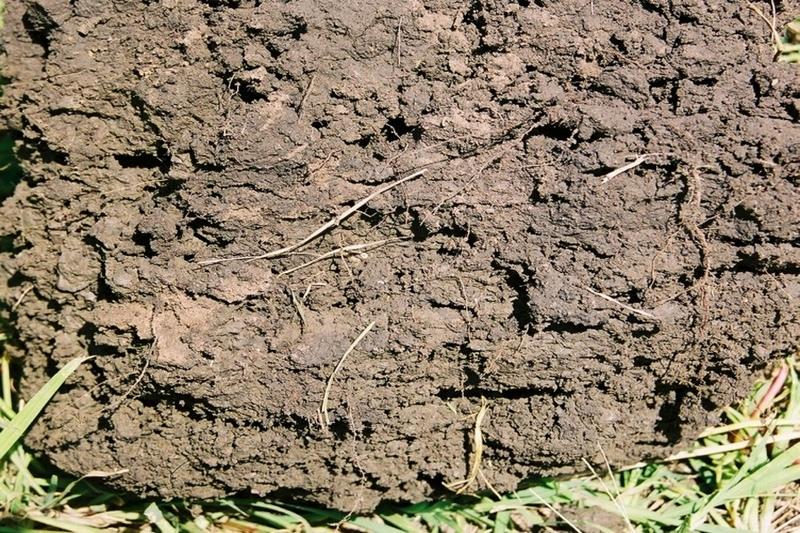
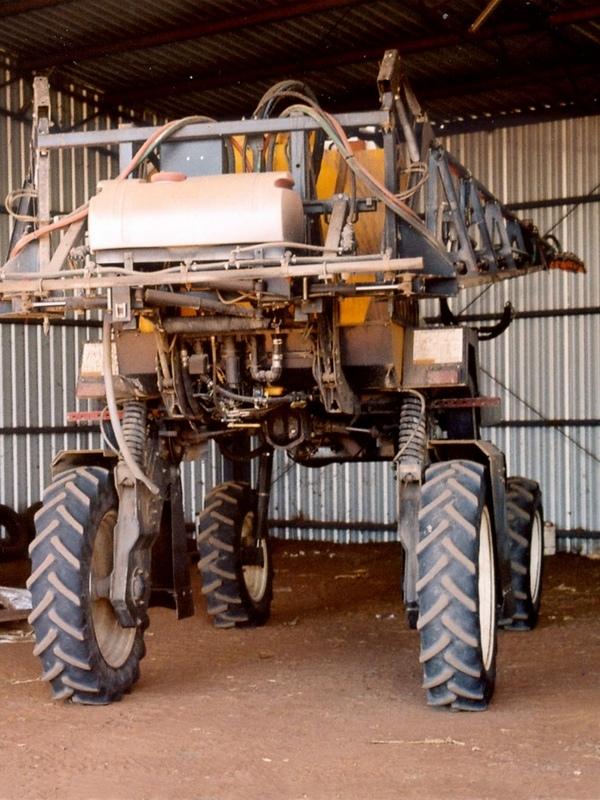
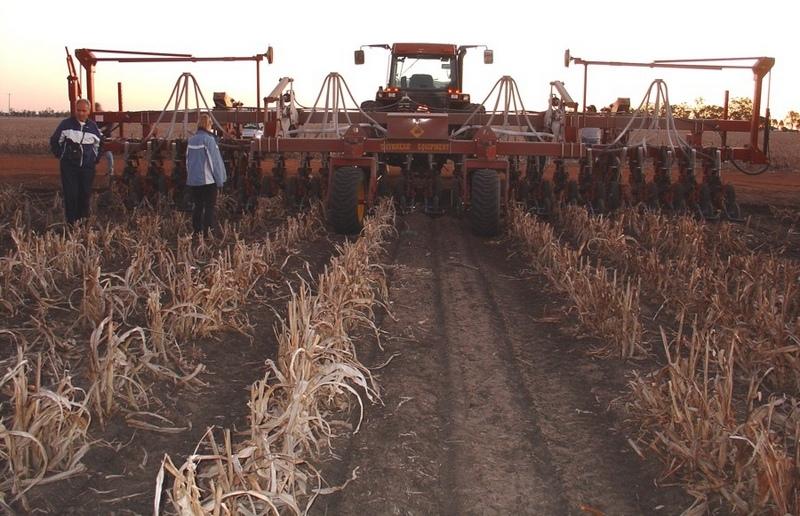
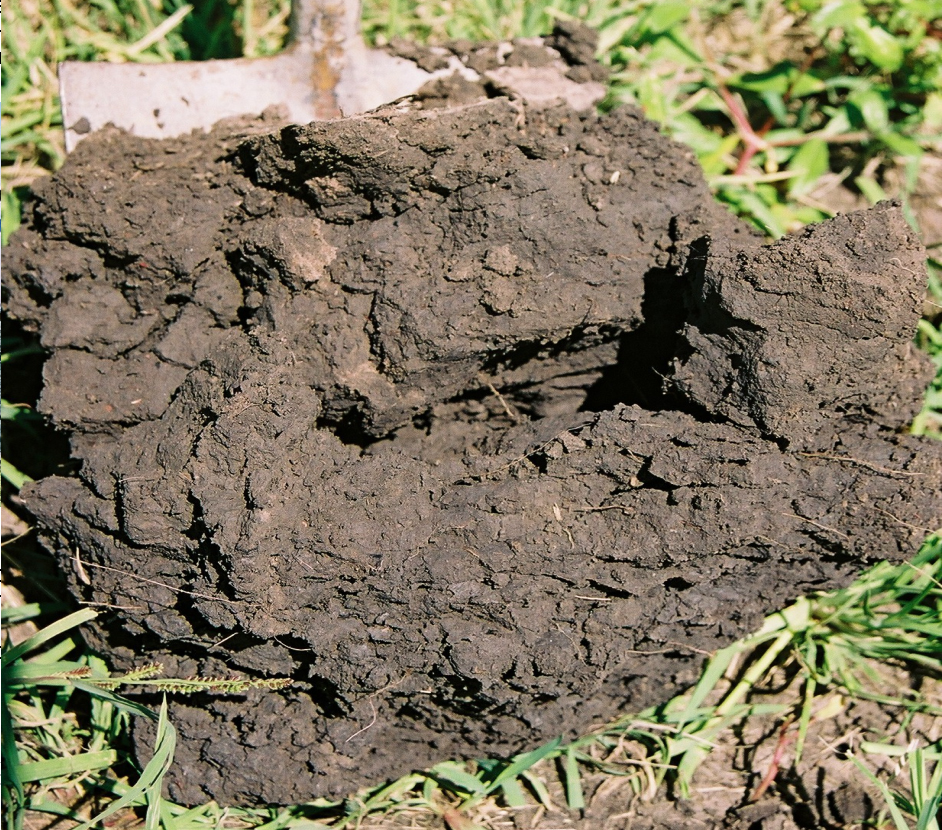
This controlled traffic, no-till farming system (CT/NT) is practiced on a 1,900 ha farm on the broad, almost flat Jandowae Plains in semi-arid Queensland, Australia. Principal soil types are vertisols, with some poorer areas where the sand content is greater, and these have a tendency to hard-set and crust. Over the past five years, the farm owner has changed the farming system completely from conventional farming to no-till with controlled traffic. Controlled traffic means permanent uncropped wheel tracks or ‘tramlines’: all equipment has 2 metre axles. The total farm machinery comprises a tractor, a spray rig and two 11 meter zero-till planter/fertilizer units; one each for wheat and sorghum sowing. The tramlines were laid out two years ago by a contractor using Geographical Positioning System (GPS).
The main technical objective was to eliminate soil compaction. The CT/NT combination ensures the land -between the tramlines - remains in excellent condition. There has been no ploughing or tillage at all in those 5 years. He practices a three year rotation between winter wheat, summer sorghum and fallow, but the system is not fixed: it depends very much on soil moisture status and thus on the rainfall (opportunity cropping). Generally in summer about one third is in summer sorghum and in winter about one third in winter wheat, the rest of the land is
under fallow. The one-year fallow is maintained through the use of herbicides sprayed onto the undisturbed residue from the previous crop. The system is designed for rain capture - to build up soil moisture stores in the fallow periods for subsequent crops - and for disease control (to ‘spell’ the land). During the cropping cycle, the key to his effective weed control system is ‘to get in early’ and ‘actively chase weeds’ through judicious spraying. The farm is now free of the locally common persistent weed Erigeron annuus. In the five years his sorghum yields have risen from 3 to 7 tons per hectares. Over the last three years the soil has improved, becoming soft, friable and moist between his plant lines. Infiltration has improved a lot and soil structure is now excellent.
Tractor use and overall fuel consumption has decreased to less than one quarter of that under conventional tillage. Correspondingly the workload is hugely reduced: from four men required under the conventional system for an equivalent area, the farmer is the sole operator, very occasionally assisted by his son, and a paid contractor for harvesting. He is so satisfied with the CT/NT system that he is attempting to purchase a nearby property to extend the area that he can farm using his current machinery.
2.3 صور التقنية
معرض الوسائط
2.5 البلد/المنطقة/المواقع التي تم تنفيذ التقنية فيها والتي يغطيها هذا التقييم
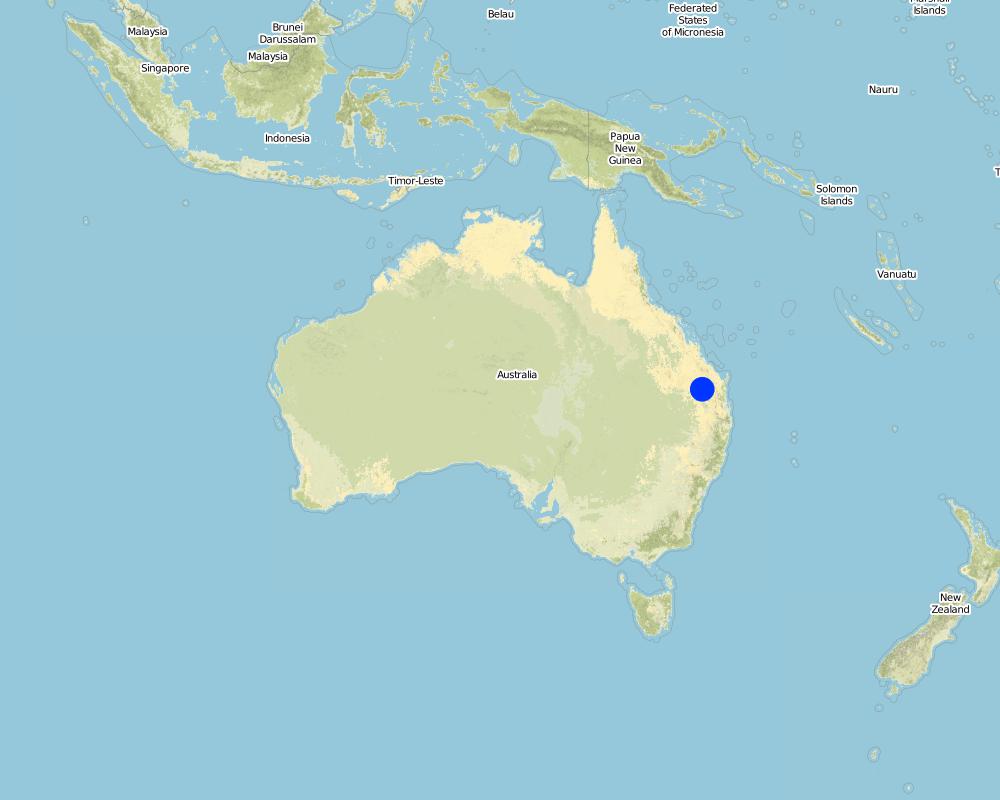
البلد:
أستراليا
المنطقة/الولاية/المحافظة:
Jimbour (north of Dalby), Queensland
حدد انتشار التقنية:
- منتشرة بالتساوي على مساحة
إذا كانت التقنيةا موزعة بالتساوي على منطقة ما، حدد المساحة المغطاة (بالكيلومتر المربع):
19,0
إذا كانت المساحة الدقيقة غير معروفة، فيرجى الإشارة إلى المنطقة التقريبية المغطاة:
- 100-10 كم2
Map
×2.7 إدخال التقنية
حدد كيف تم إدخال التقنية:
- أثناء التجارب/الأبحاث
3. تصنيف تقنية الإدارة المستدامي للأراضي
3.1 الغرض الرئيسي ( الأغراض الرئيسية) للتقنية
- تحسين الإنتاج
- الحد من تدهور الأراضي ومنعه وعكسه
- خلق أثر اقتصادي مفيد
3.2 نوع (أنواع) استخدام الأراضي الحالية حيث يتم تطبيق التقنية
استخدامات الأراضي مختلطة ضمن نفس وحدة الأرض:
كلا

الأراضي الزراعية
- زراعة سنوية
الزراعة السنوية - حدد المحاصيل:
- الحبوب - الذرة الرفيعة
- الحبوب - قمح (شتوي)
عدد مواسم الزراعة في السنة:
- 2
حدد:
Longest growing period in days: 180 Longest growing period from month to month: Oct - AprS econd longest growing period in days: 180 Second longest growing period from month to month: Apr - Sep
هل يتم ممارسة الزراعة البينية؟:
كلا
هل تتم ممارسة تناوب المحاصيل؟:
نعم
إذا كانت الإجابة بنعم، حدد:
wheat-sorghum-fallow
التعليقات:
Major land use problems (compiler’s opinion): The farmer’s main reason for starting the combination of CT and NT was to rid himself of soil compaction, in order to achieve better utilisation of locally low and unpredictable rainfall amounts while minimising costs and reducing labour and machinery requirements.
3.3 هل تغير استخدام الأراضي نتيجة لتنفيذ التقنية؟
هل تغير استخدام الأراضي نتيجة لتنفيذ التقنية؟:
- لا (تابع مع السؤال 3.4)
3.4 إمدادات المياه
إمدادات المياه للأرض التي يتم تنفيذ التقنية عليها:
- بعلية
3.5 مجموعةالإدارة المستدامة للأراضي التي تنتمي إليها هذه التقنية
- الحد الأدنى من اختلال التربة
3.6 التدابير التقنية في مجال إلادارة المستدامة للأراضي

التدابير الزراعية
- A3: معالجة سطح التربة
A3: التمييز بين أنظمة الحراثة:
A 3.1: لا حرث
التعليقات:
Main measures: agronomic measures
3.7 الأنواع الرئيسية من تدهور الأراضي التي تناولتها التقنية

تآكل التربة بالمياه
- الوزن(Wt): فقدان التربة السطحية/تآكل السطح
- (Wg):الانجراف الخلجاني/ الخلجان
تآكل التربة الناتج عن الرياح
- (Et): فقدان التربة السطحية

التدهور المادي أو الفيزيائي للتربة
- (Pc) : تراص التربة
التعليقات:
Main type of degradation addressed: Wt: loss of topsoil / surface erosion, Pc: compaction
Secondary types of degradation addressed: Wg: gully erosion / gullying, Et: loss of topsoil
3.8 منع أو حد أو عكس تدهور الأراضي
تحديد هدف التقنية فيما يتعلق بتدهور الأراضي:
- الحد من تدهور الأراضي
4. المواصفات الفنية، وأنشطة التنفيذ، والمدخلات، والتكاليف
4.1 الرسم الفني للتقنية
المواصفات الفنية (المتعلقة بالرسم الفني):
Main technical functions: control of raindrop splash, control of dispersed runoff: retain / trap, improvement of ground cover, increase in organic matter, increase of infiltration, increase / maintain water stored in soil, improvement of soil structure, reduction of compaction by traffic, increase of soil fertility
Technical knowledge required for field staff / advisors: moderate; Technical knowledge required for land users: moderate
4.2 معلومات عامة بخصوص حساب المدخلات والتكاليف
حدد العملة المستخدمة لحساب التكاليف:
- دولار أمريكي USD
اذكر متوسط تكلفة أجر العمالة المستأجرة في اليوم الواحد:
160
4.3 أنشطة التأسيس
| النشاط | التوقيت (الموسم) | |
|---|---|---|
| 1. | layout of the controlled traffic lines (tramlines) using GPS mounted in a 4x4 vehicle. Two days were adequate for the whole farm. |
4.4 التكاليف والمدخلات اللازمة للتأسيس
| تحديد المدخلات | الوحدة | الكمية | التكاليف لكل وحدة | إجمالي التكاليف لكل مدخل | % من التكاليف التي يتحملها مستخدمو الأراضي | |
|---|---|---|---|---|---|---|
| العمالة | Labour | ha | 1,0 | 5,0 | 5,0 | 100,0 |
| إجمالي تكاليف إنشاء التقنية | 5,0 | |||||
| إجمالي تكاليف إنشاء التقنية بالدولار الأمريكي | 5,0 | |||||
التعليقات:
Duration of establishment phase: 12 month(s)
4.5 الصيانة/الأنشطة المتكررة
| النشاط | التوقيت/الوتيرة | |
|---|---|---|
| 1. | Layout of the controlled traffic lines (tramlines) | Two days were adequate for the establishment on the whole farm. |
| 2. | Weed control (spray-coupe) with roundup | Summer sorghum (650 ha, during 1 season or half a year) |
| 3. | Fertilizing | Summer sorghum (650 ha, during 1 season or half a year) |
| 4. | Sowing and simultaneous application of starter fertilizer | Mid October, Summer sorghum (650 ha, during 1 season or half a year) |
| 5. | Spraying pre-emergent herbicide to kill summer grasses | Summer sorghum (650 ha, during 1 season or half a year) |
| 6. | Harvest by contractors | early March, Summer sorghum (650 ha, during 1 season or half a year) |
| 7. | Weed control | Winter wheat (650 ha, during 1 season or half a year) |
| 8. | Fertilizing (Urea) | Winter wheat (650 ha, during 1 season or half a year) |
| 9. | Sowing and simultaneous application of starter fertilizer | Mid May, Winter wheat (650 ha, during 1 season or half a year) |
| 10. | In-crop weed spray | Winter wheat (650 ha, during 1 season or half a year) |
| 11. | Harvest by contractors | October |
| 12. | Fallow (1,250 ha) | During 2 seasons or totally 1 year |
| 13. | Weed control (combination of roundup mixed with broadleaf herbicide) | 5–6 times per fallow period |
| 14. | Determine the soil moisture (To determine soil moisture he uses an iron rod; if he can push it into the heavy clay soil, then the soil is moist. Additionally, he measures rainfall) |
4.6 التكاليف والمدخلات اللازمة للصيانة/للأنشطة المتكررة (سنويًا)
| تحديد المدخلات | الوحدة | الكمية | التكاليف لكل وحدة | إجمالي التكاليف لكل مدخل | % من التكاليف التي يتحملها مستخدمو الأراضي | |
|---|---|---|---|---|---|---|
| العمالة | Labour | ha | 1,0 | 5,0 | 5,0 | 100,0 |
| معدات | Animal traction | ha | 1,0 | 6,0 | 6,0 | 100,0 |
| معدات | Harvesting by contractor | ha | 1,0 | 17,0 | 17,0 | 100,0 |
| المواد النباتية | Seeds | ha | 1,0 | 8,0 | 8,0 | 100,0 |
| الأسمدة والمبيدات الحيوية | Fertilizer | ha | 1,0 | 53,0 | 53,0 | 100,0 |
| الأسمدة والمبيدات الحيوية | Biocides | ha | 1,0 | 22,0 | 22,0 | 100,0 |
| إجمالي تكاليف صيانة التقنية | 111,0 | |||||
| إجمالي تكاليف صيانة التقنية بالدولار الأمريكي | 111,0 | |||||
التعليقات:
Machinery/ tools: tactor,spray rig, zero-till planter/fertilizer, iron rod
Comparison of costs between conventional tillage and no-till farming (CT/NT): (1) Labour costs are 4x less in CT/NT: 4 men used to work on the farm (conventional), now the farmer is alone – (plus contractors for harvesting). (2) Average annual diesel consumption: reduced from 108,333 litres (conventional) to 13,636 litres (no-till) which is 8 times less. (3) Costs of equipment to set up a CT/NT system (US$ 240,000) are 3 times less than that for conventional tillage equipment (US$ 700,000).
(4) For biocides he has to invest 5 times more in CT/NT. The conventional values are estimates.
4.7 أهم العوامل المؤثرة على التكاليف
قدم وصفا لأهم العوامل التي تؤثر على التكاليف:
In average one third of the farm area is in crop and two thirds are fallow. This means that overall farming costs per
ha are reduced, since during fallow period activities are limited to spraying herbicides. Labour costs approximately US$ 160 per day. Machinery costs average out at US$ 20 per hour (diesel costs US$ 0.9 per litre). All the data comes from this single farmer. Purchase of equipment is not included in the table above.
5. البيئة الطبيعية والبشرية
5.1 المناخ
هطول الأمطار السنوي
- < 250 مم
- 251- 500 ملم
- 501 - 750ملم
- 1,000-751 ملم
- 1,500-1,100 ملم
- 2,000-1,500 ملم
- 3,000-2,001 ملم
- 4,000-3,100 ملم
- > 4000 ملم
المنطقة المناخية الزراعية
- شبه قاحلة
- قاحلة
Thermal climate class: subtropics
5.2 طوبوغرافيا
متوسط الانحدارات:
- مسطح (0-2%)
- بسيط (3-5%)
- معتدل (6-10%)
- متدحرج (11-15%)
- تلال (16-30%)
- شديدة الانحدار(31-60%)
- فائقة الانحدار (>60%)
التضاريس:
- هضاب/سهول
- أثلام مرتفعة
- المنحدرات الجبلية
- منحدرات التلال
- منحدرات في السفوح
- قاع الوادي
المنطقة الارتفاعية:
- 100-0 متر فوق سطح البحر
- 500-101 متر فوق سطح البحر
- 1,000-501 متر فوق سطح البحر
- 1,500-1,001 متر فوق سطح البحر
- 2,000-1,501 متر فوق سطح البحر
- 2,500-2,100 متر فوق سطح البحر
- 3,000-2,501 متر فوق سطح البحر
- 4,000-3,001 متر فوق سطح البحر
- > 4000 متر فوق سطح البحر
التعليقات والمواصفات الإضافية بشأن التضاريس:
Landforms: Also footslopes and valley floors (both ranked 2)
Slopes on average: Also moderate (ranked 2) and rolling (ranked 3)
5.3 التربة
متوسط عمق التربة:
- ضحل جدًا (0-20 سم)
- ضحلة (21-50 سم)
- متوسطة العمق (51-80 سم)
- عميقة (81-120 سم)
- عميقة جدًا (> 120 سم)
قوام التربة (التربة السطحية):
- ناعم/ثقيل (طيني)
المواد العضوية في التربة السطحية:
- متوسطة (1-3%)
- منخفضة (<1%)
إذا كان متاحًا، قم بإرفاق وصف كامل للتربة أو تحديد المعلومات المتوفرة، على سبيل المثال نوع التربة، الرقم الهيدروجيني/ درجة حموضة التربة، قدرة التبادل الكاتيوني، النيتروجين، الملوحة وما إلى ذلك.
Soil depth on average: Also shallow and deep (both ranked 2)
Soil fertility: Medium (ranked 1) and high (ranked 2)
Soil drainage: Poor
5.6 خصائص مستخدمي الأراضي الذين يطبقون التقنية
التوجه السوقي لنظام الإنتاج:
- تجاري/سوق
الدخل من خارج المزرعة:
- أقل من % 10من كامل الدخل
المستوى النسبي للثروة:
- متوسط
اذكر الخصائص الأخرى ذات الصلة لمستخدمي الأراضي:
and own 88% of the land.
5.7 متوسط مساحة الأرض التي يستخدمها مستخدمو الأراضي الذين يطبقون التقنية
- < 0.5 هكتارا
- 0.5 - 1 هكتار
- 1 -2 هكتار
- 2 - 5 هكتار
- 5 - 15 هكتار
- 15 - 50 هكتار
- 50 - 100هكتار
- 500-100 هكتار
- 1,000-500 هكتار
- 10,000-1,000 هكتار
- > 10,000 هكتار
5.8 ملكية الأراضي، وحقوق استخدام الأراضي، وحقوق استخدام المياه
ملكية الارض:
- فردية، يوجد سند ملكية
حقوق استخدام الأراضي:
- فردي
6. الآثار والتصريحات الختامية
6.1 الآثار التي أظهرتها التقنية في الموقع
الآثار الاجتماعية والاقتصادية
الإنتاج
إنتاج المحاصيل
الدخل والتكاليف
دخل المزرعة
الآثار الاجتماعية والثقافية
المعرفة بالإدارة المستدامة للأراضي/تدهور الأراضي
الآثار الايكولوجية
دورة المياه / الجريان السطحي
تصريف المياه الزائدة
التربة
رطوبة التربة
غطاء التربة
فقدان التربة
تراص التربة
المادة العضوية في التربة/تحت الطبقة c
التنوع البيولوجي: الغطاء النباتي، الحيوانات
التنوع النباتي
التنوع الحيواني
تنوع الموائل
الآثار الايكولوجية الأخرى
Soil fertility
6.2 الآثار التي أظهرتها التقنية خارج الموقع
تدفقات مائية موثوقة ومستقرة في موسم الجفاف
الفيضان في اتجاه مجرى النهر
تراكم الطمي باتجاه مصب النهر
تلوث المياه الجوفية/الأنهار
Transported sediments
6.4 تحليل التكلفة والعائد
كيف يمكن مقارنة العوائد نسبة لتكاليف الإنشاء (من وجهة نظر مستخدمي الأراضي)؟
عوائد قصيرة الأجل:
ايجابي جدا
عوائد طويلة الأجل:
ايجابي جدا
كيف تتم مقارنة العوائدمع كلفة الصيانة/التكاليف المتكررة (من وجهة نظر مستخدمي الأراضي)؟
عوائد قصيرة الأجل:
ايجابي جدا
عوائد طويلة الأجل:
ايجابي جدا
6.5 اعتماد التقنية
إذا كان متاحًا، قم بتحديد الكمية (عدد الأسر المعيشية و/أو المساحةالمغطاة):
200
التعليقات:
200 land user families have adopted the Technology without any external material support
There is no trend towards spontaneous adoption of the Technology
Comments on adoption trend: There isn’t a strong trend now towards growing spontaneous adoption: uptake has slowed dramatically as many conservative farmers prefer to continue their traditional tillage practices.
6.7 نقاط القوة / المزايا / الفرص التي توفرها التقنية
| نقاط القوة/ المزايا/ الفرص من وجهة نظر جامع المعلومات أو غيره من الاشخاص الرئيسيين لمصدر المعلومات |
|---|
|
Land that previously was un-farmable is now under crops. Site inspection shows initially poor land to be now in good condition (after only 5 years). The value of the land has increased How can they be sustained / enhanced? Farmers practising CT/NT can and are buying/leasing more land, which will improve the overall state of the land in Queensland. |
|
Farmers can manage much larger growing areas with less personnel and equipment. A single operator is well able to run a large arable farm on his own How can they be sustained / enhanced? Ditto. |
|
Cereal farming is now less prone to yield losses (and crop failure) in drought years – as there is better rainwater infiltration and water use efficiency with CT/NT How can they be sustained / enhanced? Continue with the system. |
| He has all weeds under control (without need for tillage). |
6.8 نقاط ضعف / مساوىء / مخاطر التقنية وسبل التغلب عليها
| نقاط الضعف/ المساوىء/ المخاطر من وجهة نظر جامع المعلومات أو غيره من الاشخاص الرئيسيين لمصدر المعلومات | كيف يمكن التغلب عليها؟ |
|---|---|
| The contract harvester runs on 3 m wide axles, so the wheels run on the beds. However, there has only been one wet harvest in 5 years so the incidence of soil compaction from harvesting is negligible | This is not really seen as a problem. One solution would be to build a dedicated harvester (too expensive) or find a contractor with equipment that fitted the system. |
| A conservative mentality towards conservation agriculture is constraining the adoption of the system by other farmers | Continue demonstrating and disseminating knowledge about benefits. |
7. المراجع والروابط
7.1 طرق جمع/مصادر المعلومات
7.2 المراجع للمنشورات المتاحة
العنوان، المؤلف، السنة، النظام القياسي الدولي لترقيم الكتب ISBN:
Blackwell P (1998) Customised controlled traffic farming systems, instead of standard recommendations or ‘tramlines ain’t tramlines’.In Second national controlled farming conference, pp. 23–26. Eds JN Tullberg and DF Yule.
متاح من أين؟كم التكلفة؟:
Gatton College: University of Queensland
العنوان، المؤلف، السنة، النظام القياسي الدولي لترقيم الكتب ISBN:
Hulme PJ, McKenzie DC, MacLeod DA and Anthony DTW (1996) An evaluation of controlled traffic with reduced tillage for irrigated cotton on a Vertisol.
Soil and Tillage Research 38:217–237
العنوان، المؤلف، السنة، النظام القياسي الدولي لترقيم الكتب ISBN:
McGarry D, Bridge BJ and Radford BJ (2000). Contrasting soil physical properties after zero and traditional tillage of an alluvial soil in the semi-arid tropics. Soil and Tillage Research 53:105–115
الروابط والوحدات المواضيعية
توسيع الكل طي الكلالروابط
لا يوجد روابط
الوحدات المواضيعية
لا يوجد وحدات مواضيعية