FISH FARMING (AQUACULTURE) FOR INCOME GENERATION AND WATER CONSERVATION [Uganda]
- Creation:
- Update:
- Compiler: betty adoch
- Editors: JOY TUKAHIRWA, Kamugisha Rick Nelson
- Reviewer: Udo Höggel
gwoko rec
technologies_2894 - Uganda
View sections
Expand all Collapse all1. General information
1.2 Contact details of resource persons and institutions involved in the assessment and documentation of the Technology
Key resource person(s)
land user:
okecocon alex
Amuru District Farmers Association
Pabo Subcounty, Palwong parish, Kari Kari B village
Uganda
Name of project which facilitated the documentation/ evaluation of the Technology (if relevant)
Scaling-up SLM practices by smallholder farmers (IFAD)Name of the institution(s) which facilitated the documentation/ evaluation of the Technology (if relevant)
CDE Centre for Development and Environment (CDE Centre for Development and Environment) - Switzerland1.3 Conditions regarding the use of data documented through WOCAT
When were the data compiled (in the field)?
26/05/2017
The compiler and key resource person(s) accept the conditions regarding the use of data documented through WOCAT:
Yes
1.4 Declaration on sustainability of the described Technology
Is the Technology described here problematic with regard to land degradation, so that it cannot be declared a sustainable land management technology?
No
2. Description of the SLM Technology
2.1 Short description of the Technology
Definition of the Technology:
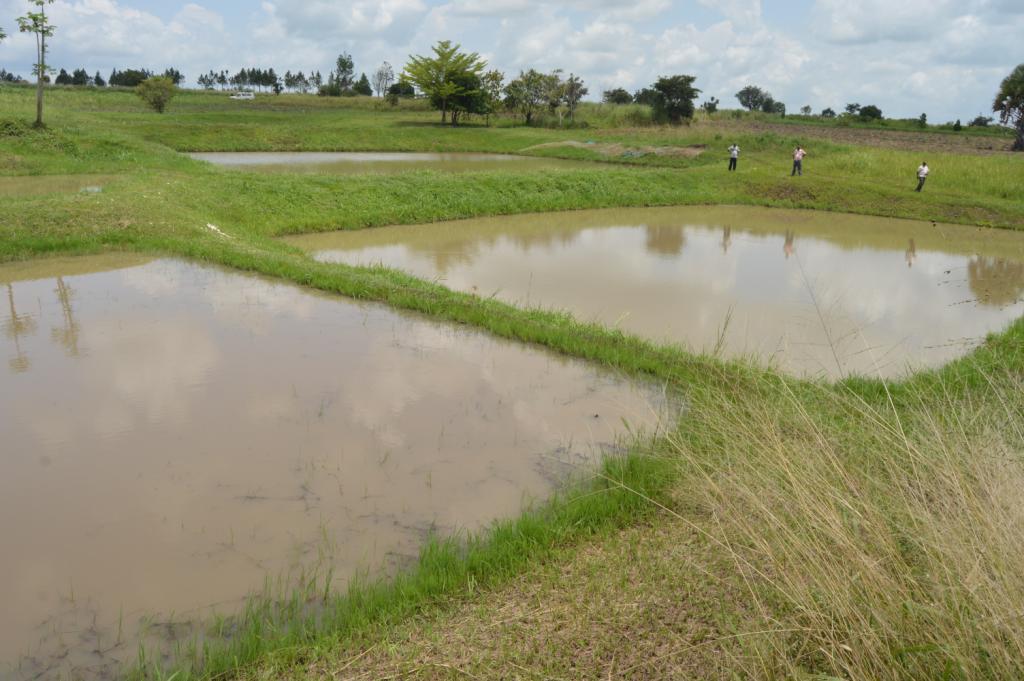
Fish farming, commonly referred to as aquaculture, is one of the common practices promoted by small, medium and large scale farmers in Amuru District, Northern Uganda. Labour, hoes, wheelbarrows, spades and slashers are used for establishment. The technology is established on a gently sloping physical environment located mainly at the valley bottom for purposes of obtaining food security and household income.
2.2 Detailed description of the Technology
Description:
Fish farming requires initial consultation with the extension agents or experts to access knowledge and skills on establishment as well as proper procedures including testing the water suitability and the reliabilty of water sources to constantly provide water to the fish pond.
The farmer has seven big fish ponds of various sizes ranging from 30m*40m, 40m*50m, 20m*25m, 20m*26m, 15m*15m, 20m*18m and 18m *16m, which serve different purposes including the bigger ones are for breeding fish of different sizes, another for production, one is meant for cat fish (omel), another pond has mixed species of tilapia (lapok) and cat fish, another pond is meant for a rare species known as singida. The farmer has established another pond meant for only male tilapia ready for sale and the last one inhabits mixed mature species ready for sale.
Usually, the fish ponds are restocked by bringing young species from another fish pond. To ensure hygine and survival, fish ponds are maintained by clearing the bushes around the ponds weekly. Feeds are provided to the fish at a specific time interval that is regularly 10:00 am, 3:00 pm and 6:00 pm.
At the end of the day; once the technology is established the pond system requires only maintenance costs for removing weeds, feeding, restocking and slashing around the pond. What is not liked about this technology is that it relies on a natural spring. In case of drought survival of the fish is not guaranteed.
2.3 Photos of the Technology
Media Gallery
2.5 Country/ region/ locations where the Technology has been applied and which are covered by this assessment
Country:
Uganda
Region/ State/ Province:
Northern Uganda
Further specification of location:
Amuru town council
2.6 Date of implementation
Indicate year of implementation:
2012
2.7 Introduction of the Technology
Specify how the Technology was introduced:
- through land users' innovation
Comments (type of project, etc.):
The land user once had a fish pond at a young age.
3. Classification of the SLM Technology
3.1 Main purpose(s) of the Technology
- improve production
- reduce risk of disasters
- adapt to climate change/ extremes and its impacts
- create beneficial economic impact
3.2 Current land use type(s) where the Technology is applied

Waterways, waterbodies, wetlands
- Ponds, dams
Main products/ services:
Fish, Water conservation
If land use has changed due to the implementation of the Technology, indicate land use before implementation of the Technology:
Crop production.
3.3 Further information about land use
Water supply for the land on which the Technology is applied:
- rainfed
Specify:
Throughout the year.
Livestock density (if relevant):
Not applicable.
3.4 SLM group to which the Technology belongs
- water harvesting
- surface water management (spring, river, lakes, sea)
- ground water management
3.5 Spread of the Technology
Specify the spread of the Technology:
- applied at specific points/ concentrated on a small area
3.6 SLM measures comprising the Technology
structural measures
- S5: Dams, pans, ponds
3.7 Main types of land degradation addressed by the Technology

other
Comments:
Surface water is used to fill water ponds for aqualuture. This has also a beneficial effect on the the groundwater level and water security in the immediate area.
3.8 Prevention, reduction, or restoration of land degradation
Specify the goal of the Technology with regard to land degradation:
- not applicable
4. Technical specifications, implementation activities, inputs, and costs
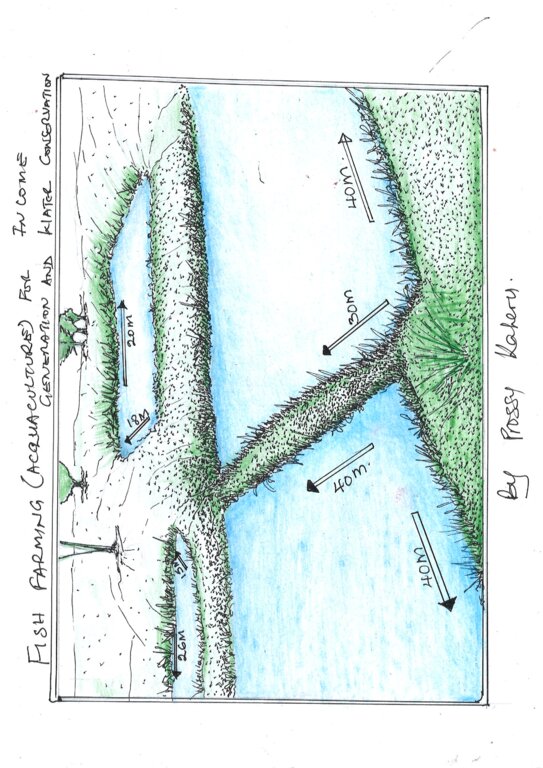
4.1 Technical drawing of the Technology
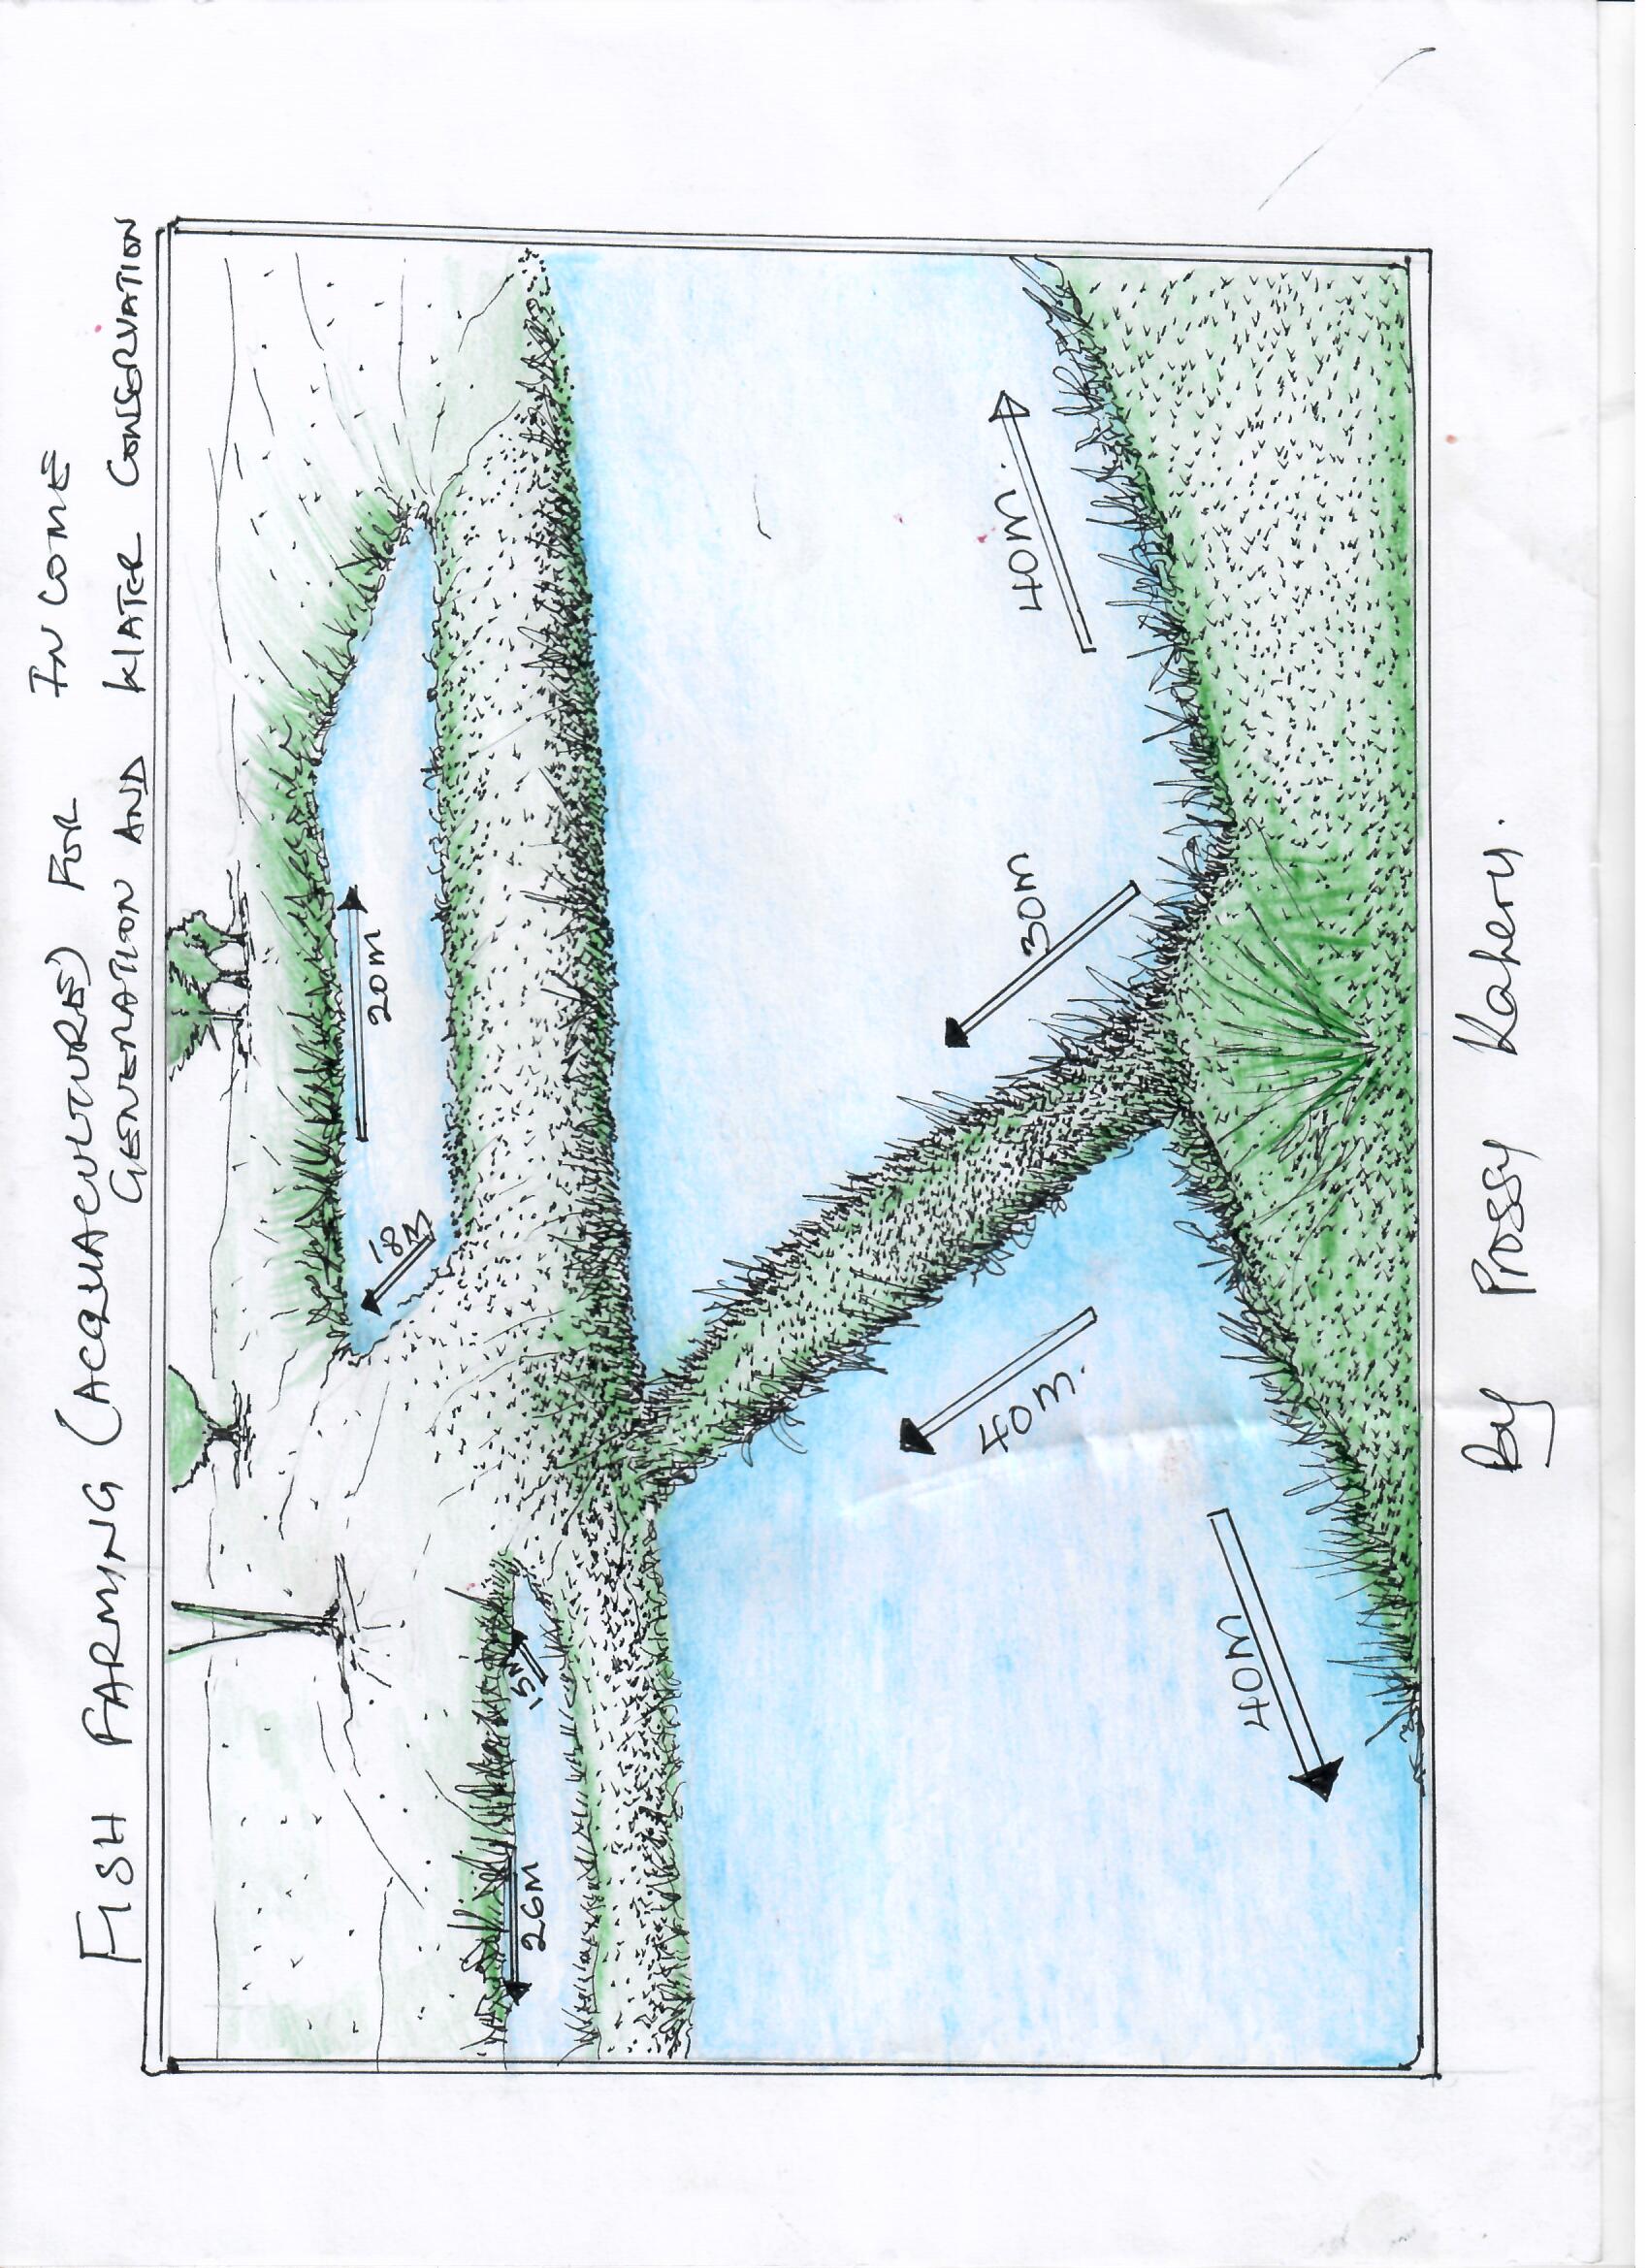
Author:
Betty Adoch
Date:
26/5/2017
4.2 Technical specifications/ explanations of technical drawing
The farmer has seven big fish ponds of various sizes ranging from 30m*40m, 40m*50m, 20m*25m, 20m*26m, 15m*15m, 20m*18m and 18m*16m established in the valley bottom.
4.3 General information regarding the calculation of inputs and costs
Specify how costs and inputs were calculated:
- per Technology area
Indicate size and area unit:
6 acres
other/ national currency (specify):
UGX
Indicate exchange rate from USD to local currency (if relevant): 1 USD =:
3500.0
Indicate average wage cost of hired labour per day:
3000shs
4.4 Establishment activities
| Activity | Type of measure | Timing | |
|---|---|---|---|
| 1. | Digging of ponds | Structural | dry and wet |
| 2. | Water is drained out of the dam during constructions | Structural | dry and wet |
| 3. | The dam gets filled by water from underneath | Structural | dry and wet |
| 4. | Fish introduction into the pond | Management | dry and wet |
4.5 Costs and inputs needed for establishment
| Specify input | Unit | Quantity | Costs per Unit | Total costs per input | % of costs borne by land users | |
|---|---|---|---|---|---|---|
| Labour | Labour on monthly basis | workers | 5.0 | 150000.0 | 750000.0 | 100.0 |
| Equipment | Spades | pieces | 5.0 | 7000.0 | 35000.0 | 100.0 |
| Equipment | Slasher | pieces | 5.0 | 7000.0 | 35000.0 | 100.0 |
| Equipment | Wheelbarrow | pieces | 1.0 | 8000.0 | 8000.0 | 100.0 |
| Other | Fish fry | pieces | 200.0 | 1000.0 | 200000.0 | 100.0 |
| Other | Feeds per week | kgs | 100.0 | 1000.0 | 100000.0 | 100.0 |
| Other | Fish nets | pieces | 5.0 | 4000.0 | 20000.0 | 100.0 |
| Total costs for establishment of the Technology | 1148000.0 | |||||
4.6 Maintenance/ recurrent activities
| Activity | Type of measure | Timing/ frequency | |
|---|---|---|---|
| 1. | Removing water weed | Management | dry and wet |
| 2. | Fertilizer application(lime), chicken waste, cow dung to promote growth of plankton | Management | dry and wet |
| 3. | Replacement of water | Management | dry and wet |
| 4. | Feeding the fish | Management | dry and wet |
| 5. | Slashing the dam sides | Management | dry and wet |
4.7 Costs and inputs needed for maintenance/ recurrent activities (per year)
| Specify input | Unit | Quantity | Costs per Unit | Total costs per input | % of costs borne by land users | |
|---|---|---|---|---|---|---|
| Labour | Labour on monthly basis | workers | 1.0 | 150000.0 | 150000.0 | 100.0 |
| Total costs for maintenance of the Technology | 150000.0 | |||||
Comments:
1 worker in a monthly basis carries out all recurrent works listed above.
4.8 Most important factors affecting the costs
Describe the most determinate factors affecting the costs:
Labour is the important factor that influences costs. The farmer used own money to hire labour.
5. Natural and human environment
5.1 Climate
Annual rainfall
- < 250 mm
- 251-500 mm
- 501-750 mm
- 751-1,000 mm
- 1,001-1,500 mm
- 1,501-2,000 mm
- 2,001-3,000 mm
- 3,001-4,000 mm
- > 4,000 mm
Specify average annual rainfall (if known), in mm:
850.00
Specifications/ comments on rainfall:
Two rainy seasons and two dry season
Agro-climatic zone
- sub-humid
5.2 Topography
Slopes on average:
- flat (0-2%)
- gentle (3-5%)
- moderate (6-10%)
- rolling (11-15%)
- hilly (16-30%)
- steep (31-60%)
- very steep (>60%)
Landforms:
- plateau/plains
- ridges
- mountain slopes
- hill slopes
- footslopes
- valley floors
Altitudinal zone:
- 0-100 m a.s.l.
- 101-500 m a.s.l.
- 501-1,000 m a.s.l.
- 1,001-1,500 m a.s.l.
- 1,501-2,000 m a.s.l.
- 2,001-2,500 m a.s.l.
- 2,501-3,000 m a.s.l.
- 3,001-4,000 m a.s.l.
- > 4,000 m a.s.l.
Indicate if the Technology is specifically applied in:
- concave situations
5.3 Soils
Soil depth on average:
- very shallow (0-20 cm)
- shallow (21-50 cm)
- moderately deep (51-80 cm)
- deep (81-120 cm)
- very deep (> 120 cm)
Soil texture (topsoil):
- fine/ heavy (clay)
Soil texture (> 20 cm below surface):
- fine/ heavy (clay)
Topsoil organic matter:
- medium (1-3%)
5.4 Water availability and quality
Ground water table:
on surface
Availability of surface water:
excess
Water quality (untreated):
good drinking water
Is water salinity a problem?
No
Is flooding of the area occurring?
Yes
Regularity:
episodically
5.5 Biodiversity
Species diversity:
- high
Habitat diversity:
- high
5.6 Characteristics of land users applying the Technology
Sedentary or nomadic:
- Sedentary
Market orientation of production system:
- mixed (subsistence/ commercial
Off-farm income:
- less than 10% of all income
Relative level of wealth:
- average
Individuals or groups:
- individual/ household
Level of mechanization:
- manual work
Gender:
- women
- men
Age of land users:
- middle-aged
- elderly
5.7 Average area of land owned or leased by land users applying the Technology
- < 0.5 ha
- 0.5-1 ha
- 1-2 ha
- 2-5 ha
- 5-15 ha
- 15-50 ha
- 50-100 ha
- 100-500 ha
- 500-1,000 ha
- 1,000-10,000 ha
- > 10,000 ha
Is this considered small-, medium- or large-scale (referring to local context)?
- medium-scale
5.8 Land ownership, land use rights, and water use rights
Land ownership:
- individual, not titled
Land use rights:
- individual
Water use rights:
- communal (organized)
5.9 Access to services and infrastructure
health:
- poor
- moderate
- good
education:
- poor
- moderate
- good
technical assistance:
- poor
- moderate
- good
employment (e.g. off-farm):
- poor
- moderate
- good
markets:
- poor
- moderate
- good
energy:
- poor
- moderate
- good
roads and transport:
- poor
- moderate
- good
drinking water and sanitation:
- poor
- moderate
- good
financial services:
- poor
- moderate
- good
6. Impacts and concluding statements
6.1 On-site impacts the Technology has shown
Socio-economic impacts
Production
fodder quality
Comments/ specify:
Fodder planted on the pond levee.
risk of production failure
Comments/ specify:
Monitoring and supervision by the extension worker and the land user.
land management
Comments/ specify:
Running water retained in the ponds.
Income and costs
expenses on agricultural inputs
Comments/ specify:
Only for purchase of fish feeds.
farm income
Comments/ specify:
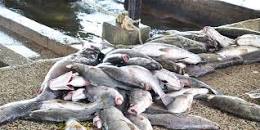
From the sale of fish.
workload
Comments/ specify:
Only for feeding, fishing and clearing the bush around the pond.
Socio-cultural impacts
food security/ self-sufficiency
Comments/ specify:
Income from the sale of fish is used to purchase other food stuffs.
community institutions
Comments/ specify:
Fish farming associations in place to enhance fishing and negotiate for better prices.
SLM/ land degradation knowledge
Comments/ specify:
On fishing farming extended by fisheries office and partners
Ecological impacts
Water cycle/ runoff
groundwater table/ aquifer
6.2 Off-site impacts the Technology has shown
water availability
Comments/ specify:
Via the increased groundwater table.
6.3 Exposure and sensitivity of the Technology to gradual climate change and climate-related extremes/ disasters (as perceived by land users)
Gradual climate change
Gradual climate change
| Season | Type of climatic change/ extreme | How does the Technology cope with it? | |
|---|---|---|---|
| annual temperature | increase | moderately | |
| annual rainfall | decrease | moderately |
6.4 Cost-benefit analysis
How do the benefits compare with the establishment costs (from land users’ perspective)?
Short-term returns:
positive
Long-term returns:
very positive
How do the benefits compare with the maintenance/ recurrent costs (from land users' perspective)?
Short-term returns:
positive
Long-term returns:
very positive
6.5 Adoption of the Technology
- 10-50%
If available, quantify (no. of households and/ or area covered):
60
Of all those who have adopted the Technology, how many have did so spontaneously, i.e. without receiving any material incentives/ payments?
- 90-100%
6.6 Adaptation
Has the Technology been modified recently to adapt to changing conditions?
Yes
If yes, indicate to which changing conditions it was adapted:
- changing markets
6.7 Strengths/ advantages/ opportunities of the Technology
| Strengths/ advantages/ opportunities in the land user’s view |
|---|
| The technology is a good source of food. |
| Easy to maintain. |
| Provides income from the sale of the fish. |
| Strengths/ advantages/ opportunities in the compiler’s or other key resource person’s view |
|---|
| Does not require high maintenance costs once established. |
| Requires technical advice which is available with extension workers. |
6.8 Weaknesses/ disadvantages/ risks of the Technology and ways of overcoming them
| Weaknesses/ disadvantages/ risks in the land user’s view | How can they be overcome? |
|---|---|
| Easily affected by drought especially during the dry season. | Water harvesting. |
| Easily destructed by wild birds. | Tide security through watchman. |
| Flooding can lead to overflow hence fishes may escape. | Channel created to drain away excess water from the pond. |
| Weaknesses/ disadvantages/ risks in the compiler’s or other key resource person’s view | How can they be overcome? |
|---|---|
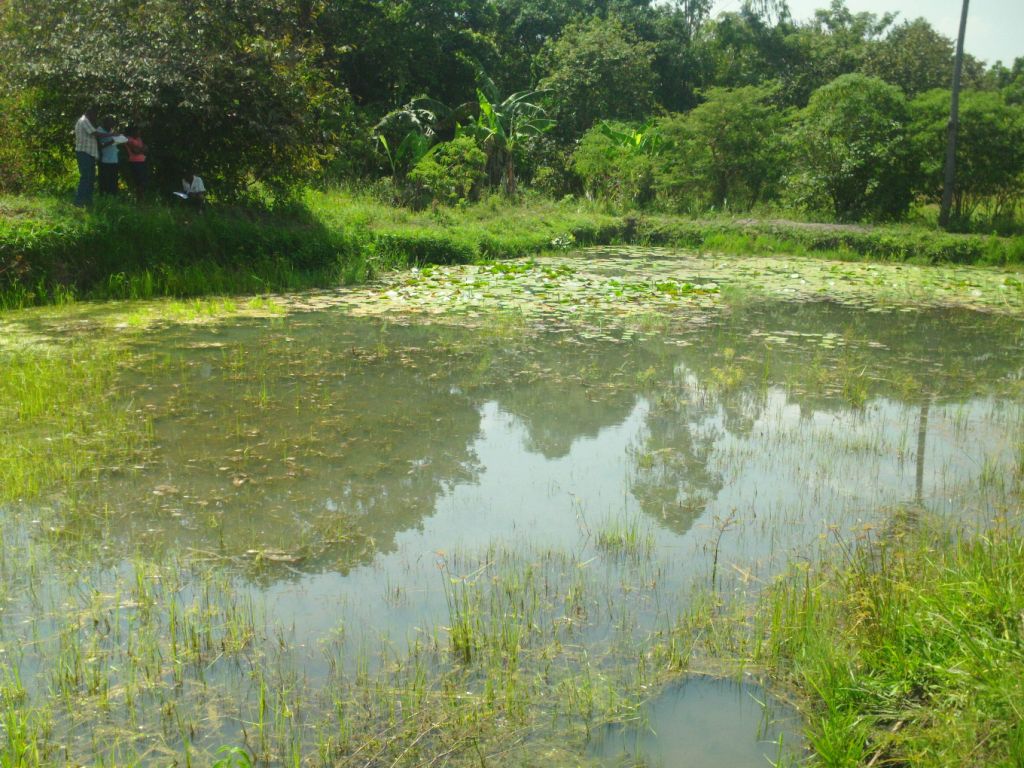
| Presence of water weeds may affect fish growth and feeding. | Constant removal of weeds which might be an extra cost. |
7. References and links
7.1 Methods/ sources of information
- field visits, field surveys
01
- interviews with land users
01
7.2 References to available publications
Title, author, year, ISBN:
Aquaculture production and its contribution to development in the Rwenzori region Uganda, Ronald Rulijwa, June 2018
Available from where? Costs?
https://www.researchgate.net/publication/326059904_Aquaculture_production_and_its_contribution_to_development_in_the_Rwenzori_region_Uganda
7.3 Links to relevant information which is available online
Title/ description:
The Effect of Water Quality on Aquaculture Productivity in Ibanda District, Uganda ,Received: 8 November 2021 / Revised: 16 December 2021 / Accepted: 21 February 2022 / Published: 4 March 2022
URL:
https://www.mdpi.com/2673-9496/2/1/3
Links and modules
Expand all Collapse allLinks
No links
Modules
No modules