Revegetation and re-seeding [South Africa]
- Creation:
- Update:
- Compiler: Klaus Kellner
- Editor: –
- Reviewers: David Streiff, Alexandra Gavilano
Rehabilitation/Restoration of old and degraded land
technologies_1381 - South Africa
View sections
Expand all Collapse all1. General information
1.2 Contact details of resource persons and institutions involved in the assessment and documentation of the Technology
Name of the institution(s) which facilitated the documentation/ evaluation of the Technology (if relevant)
Potchefstroom Universiteit vir CHO (Potchefstroom Universiteit vir CHO) - South Africa1.3 Conditions regarding the use of data documented through WOCAT
The compiler and key resource person(s) accept the conditions regarding the use of data documented through WOCAT:
Yes
1.5 Reference to Questionnaire(s) on SLM Approaches (documented using WOCAT)
Government funded demonstrations [South Africa]
Government funded restoration demonstration site to restore degraded land - by community participation. Community becoming the key sake holders - Capacity building.
- Compiler: Klaus Kellner
2. Description of the SLM Technology
2.1 Short description of the Technology
Definition of the Technology:
Revegetation of old, degraded land. Restoring area to increase grazing capacity and production.
2.2 Detailed description of the Technology
Description:
Vegetative (revegetation/re-seeding) improvement for an increase in grass production and to increase the grazing capacity of the area.
The rural community identified an old degraded land - the area was fenced to exclude grazing by large herbivores. The woody species that encroached the area were debushed. Area was ploughed and re-seeded with palatable, climax, big tufted, perennial grass species. Some plots were covered with twigs (bush packing). The area was protected from grazing. Monitoring of vegetation was done at the end of the growing season.
2.3 Photos of the Technology
Media Gallery
2.5 Country/ region/ locations where the Technology has been applied and which are covered by this assessment
Country:
South Africa
Region/ State/ Province:
Limpopo
Further specification of location:
Pietersburg
Specify the spread of the Technology:
- evenly spread over an area
If the Technology is evenly spread over an area, specify area covered (in km2):
1.0
If precise area is not known, indicate approximate area covered:
- 0.1-1 km2
Comments:
Total area covered by the SLM Technology is 1 km2.
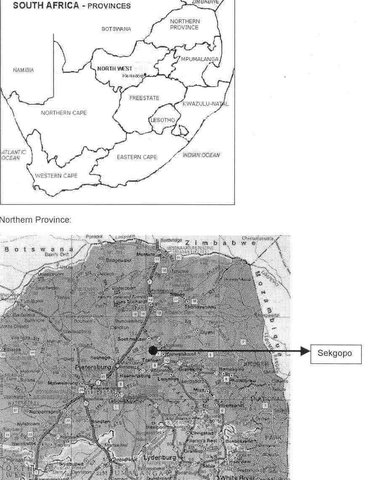
Old land near rural villages, Sekgopo, 50 km north of Pietersburg in the Northern Province of South Africa. Old land degraded.
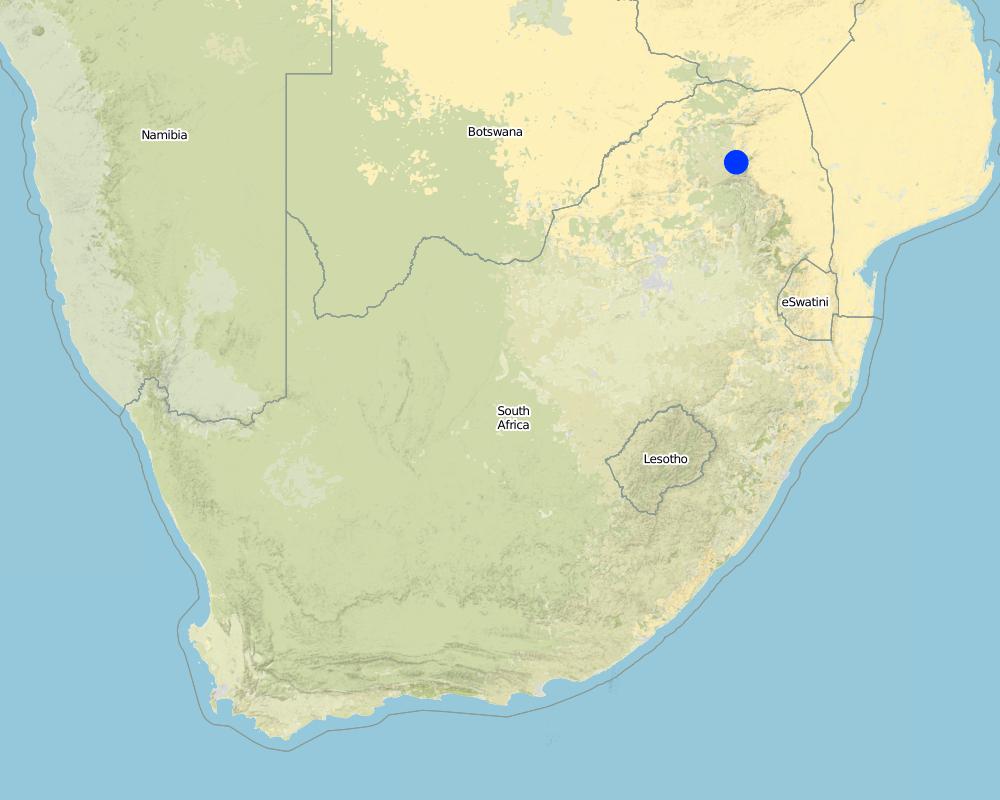
Map
×2.6 Date of implementation
If precise year is not known, indicate approximate date:
- less than 10 years ago (recently)
2.7 Introduction of the Technology
Specify how the Technology was introduced:
- during experiments/ research
Comments (type of project, etc.):
Restore degraded areas
3. Classification of the SLM Technology
3.1 Main purpose(s) of the Technology
- reduce, prevent, restore land degradation
3.2 Current land use type(s) where the Technology is applied

Grazing land
Extensive grazing:
- Semi-nomadic pastoralism
Comments:
Main animal species and products: Communal land, some commercial
Major land use problems (compiler’s opinion): Overgrazing and loss of palatable, climax vegetation.
Major land use problems (land users’ perception): No grazing for animals; bush/woody encroachment.
Semi-nomadism / pastoralism: Communal land, some commercial
Grazingland comments: Large herds of livestock - but not owned individually - communally managed.
Land users owned few cattle/small stock in herd.
Type of grazing system comments: Large herds of livestock - but not owned individually - communally managed.
Land users owned few cattle/small stock in herd.
Number of growing seasons per year: 1
Longest growing period in days: 210; Longest growing period from month to month: Oct - Apr
3.4 Water supply
Water supply for the land on which the Technology is applied:
- rainfed
3.5 SLM group to which the Technology belongs
- area closure (stop use, support restoration)
3.6 SLM measures comprising the Technology

vegetative measures
- V2: Grasses and perennial herbaceous plants
Comments:
Main measures: vegetative measures
Type of vegetative measures: aligned: -graded strips *<sup>3</sup>
3.7 Main types of land degradation addressed by the Technology

soil erosion by water
- Wt: loss of topsoil/ surface erosion
- Wg: gully erosion/ gullying

chemical soil deterioration
- Cn: fertility decline and reduced organic matter content (not caused by erosion)
water degradation
- Ha: aridification
Comments:
Secondary types of degradation addressed: Wt: loss of topsoil / surface erosion, Wg: gully erosion / gullying, Ha: aridification
Main causes of degradation: over-exploitation of vegetation for domestic use, overgrazing, education, access to knowledge and support services (Lack of knowledge)
Secondary causes of degradation: other human induced causes (specify) (Cropping on marginal lands), labour availability (Lack of labour)
3.8 Prevention, reduction, or restoration of land degradation
Specify the goal of the Technology with regard to land degradation:
- reduce land degradation
- restore/ rehabilitate severely degraded land
Comments:
Secondary goals: prevention of land degradation
4. Technical specifications, implementation activities, inputs, and costs
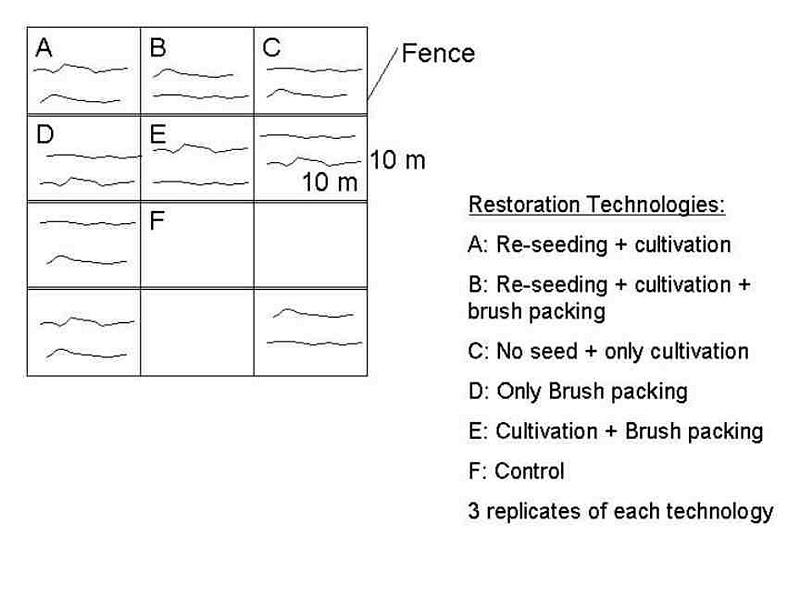
4.1 Technical drawing of the Technology
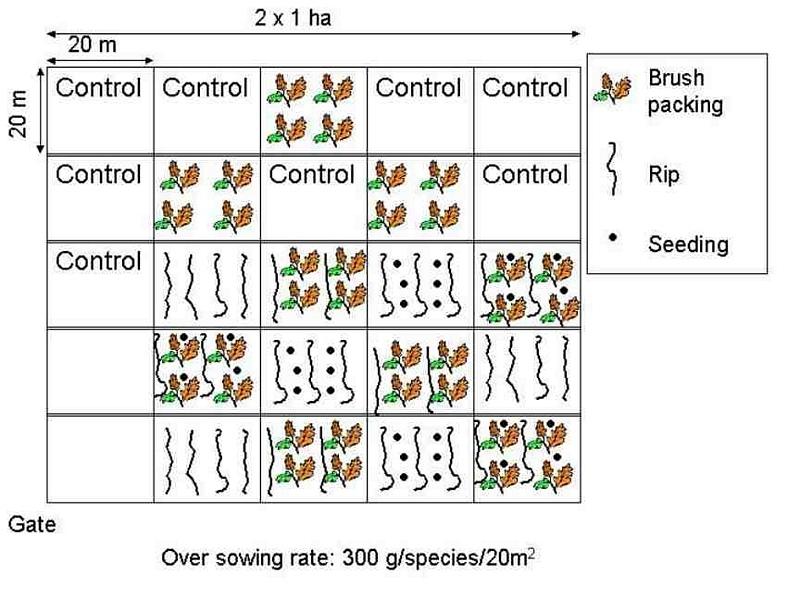
Technical specifications (related to technical drawing):
Experimental plot
Location: Sekgopo. Northern Province
Technical knowledge required for field staff / advisors: moderate
Technical knowledge required for land users: moderate
Main technical functions: control of raindrop splash, increase in organic matter, increase in soil fertility, improvement of ground cover
Secondary technical functions: control of dispersed runoff: retain / trap, control of dispersed runoff: impede / retard, control of concentrated runoff: impede / retard, reduction of slope angle, increase of surface roughness, increase of infiltration, increase / maintain water stored in soil, water harvesting / increase water supply, water spreading, sediment retention / trapping, sediment harvesting, reduction in wind speed, improvement of soil structure
Aligned: -graded strips
Vegetative material: G : grass
Vertical interval between rows / strips / blocks (m): 0.00
Spacing between rows / strips / blocks (m): 1.00
Vertical interval within rows / strips / blocks (m): 1.00
Width within rows / strips / blocks (m): 0.30
Grass species: 5 Perennial, climax grass types
Slope (which determines the spacing indicated above): 4.00%
Author:
Klaus Kellner
4.2 General information regarding the calculation of inputs and costs
Specify currency used for cost calculations:
- USD
Indicate average wage cost of hired labour per day:
3.60
4.3 Establishment activities
| Activity | Timing (season) | |
|---|---|---|
| 1. | Ripping | At start of technology and beginning of rainy season |
| 2. | Oversowing | At start of technology and beginning of rainy season |
| 3. | Bush packing | At start of technology and beginning of rainy season |
4.4 Costs and inputs needed for establishment
| Specify input | Unit | Quantity | Costs per Unit | Total costs per input | % of costs borne by land users | |
|---|---|---|---|---|---|---|
| Labour | Bush packing, sowing and ripping | persons/day/ha | 172.0 | 3.2 | 550.4 | 10.0 |
| Equipment | Machine use | ha | 1.0 | 30.0 | 30.0 | |
| Equipment | Tools | ha | 1.0 | 20.0 | 20.0 | |
| Plant material | Seeds | ha | 1.0 | 150.0 | 150.0 | |
| Construction material | Fencing | ha | 1.0 | 1100.0 | 1100.0 | |
| Total costs for establishment of the Technology | 1850.4 | |||||
| Total costs for establishment of the Technology in USD | 1850.4 | |||||
Comments:
Duration of establishment phase: 12 month(s)
4.5 Maintenance/ recurrent activities
| Activity | Timing/ frequency | |
|---|---|---|
| 1. | No maintenance | |
| 2. | Fencing in tact | /Once a year |
4.6 Costs and inputs needed for maintenance/ recurrent activities (per year)
| Specify input | Unit | Quantity | Costs per Unit | Total costs per input | % of costs borne by land users | |
|---|---|---|---|---|---|---|
| Labour | Maintain fence | persons/day/ha | 62.5 | 3.2 | 200.0 | 10.0 |
| Construction material | Fence | ha | 1.0 | 50.0 | 50.0 | |
| Total costs for maintenance of the Technology | 250.0 | |||||
| Total costs for maintenance of the Technology in USD | 250.0 | |||||
Comments:
Seeds purchasing, Erection of restoration demonstration site.
4.7 Most important factors affecting the costs
Describe the most determinate factors affecting the costs:
Labour, fencing and maintenance. Maintenance costs include man days and travelling for vegetation monitoring and sampling.
5. Natural and human environment
5.1 Climate
Annual rainfall
- < 250 mm
- 251-500 mm
- 501-750 mm
- 751-1,000 mm
- 1,001-1,500 mm
- 1,501-2,000 mm
- 2,001-3,000 mm
- 3,001-4,000 mm
- > 4,000 mm
Specify average annual rainfall (if known), in mm:
450.00
Agro-climatic zone
- semi-arid
5.2 Topography
Slopes on average:
- flat (0-2%)
- gentle (3-5%)
- moderate (6-10%)
- rolling (11-15%)
- hilly (16-30%)
- steep (31-60%)
- very steep (>60%)
Landforms:
- plateau/plains
- ridges
- mountain slopes
- hill slopes
- footslopes
- valley floors
Altitudinal zone:
- 0-100 m a.s.l.
- 101-500 m a.s.l.
- 501-1,000 m a.s.l.
- 1,001-1,500 m a.s.l.
- 1,501-2,000 m a.s.l.
- 2,001-2,500 m a.s.l.
- 2,501-3,000 m a.s.l.
- 3,001-4,000 m a.s.l.
- > 4,000 m a.s.l.
5.3 Soils
Soil depth on average:
- very shallow (0-20 cm)
- shallow (21-50 cm)
- moderately deep (51-80 cm)
- deep (81-120 cm)
- very deep (> 120 cm)
Soil texture (topsoil):
- medium (loamy, silty)
Topsoil organic matter:
- low (<1%)
If available, attach full soil description or specify the available information, e.g. soil type, soil PH/ acidity, Cation Exchange Capacity, nitrogen, salinity etc.
Soil fertility is low
Soil drainage / infiltration is medium
Soil water storage capacity is low
5.6 Characteristics of land users applying the Technology
Market orientation of production system:
- subsistence (self-supply)
Off-farm income:
- > 50% of all income
Relative level of wealth:
- poor
Indicate other relevant characteristics of the land users:
Population density: 50-100 persons/km2
Annual population growth: 3% - 4%
100% of the land users are poor and own 100% of the land (Communal land).
Off-farm income specification: Old age pensions (state pensions), Mine workers (family members working in Cities).
5.7 Average area of land used by land users applying the Technology
- < 0.5 ha
- 0.5-1 ha
- 1-2 ha
- 2-5 ha
- 5-15 ha
- 15-50 ha
- 50-100 ha
- 100-500 ha
- 500-1,000 ha
- 1,000-10,000 ha
- > 10,000 ha
Comments:
Communal land
5.8 Land ownership, land use rights, and water use rights
Land ownership:
- communal/ village
Land use rights:
- communal (organized)
6. Impacts and concluding statements
6.1 On-site impacts the Technology has shown
Socio-economic impacts
Production
crop production
fodder production
Comments/ specify:
Grazing increase
fodder quality
Comments/ specify:
Grazing increase
Income and costs
farm income
workload
Comments/ specify:
Only few people could be employed - more would have liked to earn money
Socio-cultural impacts
community institutions
national institutions
SLM/ land degradation knowledge
Comments/ specify:
Capacity building awareness
conflict mitigation
Comments/ specify:
Farmers and land users did not all agree to the SWC technology
job - creation
Ecological impacts
Water cycle/ runoff
excess water drainage
Soil
soil moisture
soil cover
soil loss
Quantity before SLM:
2
Quantity after SLM:
0
Climate and disaster risk reduction
wind velocity
Other ecological impacts
soil fertility
biodiversity
6.2 Off-site impacts the Technology has shown
reliable and stable stream flows in dry season
downstream flooding
downstream siltation
groundwater/ river pollution
wind transported sediments
6.4 Cost-benefit analysis
How do the benefits compare with the establishment costs (from land users’ perspective)?
Short-term returns:
slightly negative
Long-term returns:
positive
How do the benefits compare with the maintenance/ recurrent costs (from land users' perspective)?
Short-term returns:
slightly negative
Long-term returns:
positive
6.5 Adoption of the Technology
- > 50%
If available, quantify (no. of households and/ or area covered):
11 households, covering 100 percent of the stated area
Of all those who have adopted the Technology, how many did so spontaneously, i.e. without receiving any material incentives/ payments?
- 0-10%
Comments:
10 land user families have adopted the Technology with external material support
Comments on acceptance with external material support: estimates
1 land user families have adopted the Technology without any external material support
Comments on spontaneous adoption: estimates
There is a moderate trend towards spontaneous adoption of the Technology
Comments on adoption trend: With proper awareness and participation, adoption and implementation rate will be higher.
7. References and links
7.1 Methods/ sources of information
Links and modules
Expand all Collapse allLinks
Government funded demonstrations [South Africa]
Government funded restoration demonstration site to restore degraded land - by community participation. Community becoming the key sake holders - Capacity building.
- Compiler: Klaus Kellner
Modules
No modules