
Riparian buffer strip with naturally recovered vegetation [Germany]
- Creation:
- Update:
- Compiler: Felix Witing
- Editors: Michael Strauch, Mona Pauer
- Reviewers: William Critchley, Rima Mekdaschi Studer
Selbstbegrünte Brache als Gewässerrandstreifen
technologies_6258 - Germany
View sections
Expand all Collapse all1. General information
1.2 Contact details of resource persons and institutions involved in the assessment and documentation of the Technology
SLM specialist:
SLM specialist:
Name of project which facilitated the documentation/ evaluation of the Technology (if relevant)
OPtimal strategies to retAIN and re-use water and nutrients in small agricultural catchments across different soil-climatic regions in Europe (OPTAIN)Name of the institution(s) which facilitated the documentation/ evaluation of the Technology (if relevant)
Helmholtz Centre for Environmental Research (UFZ) - Germany1.3 Conditions regarding the use of data documented through WOCAT
The compiler and key resource person(s) accept the conditions regarding the use of data documented through WOCAT:
Yes
1.4 Declaration on sustainability of the described Technology
Is the Technology described here problematic with regard to land degradation, so that it cannot be declared a sustainable land management technology?
No
2. Description of the SLM Technology
2.1 Short description of the Technology
Definition of the Technology:
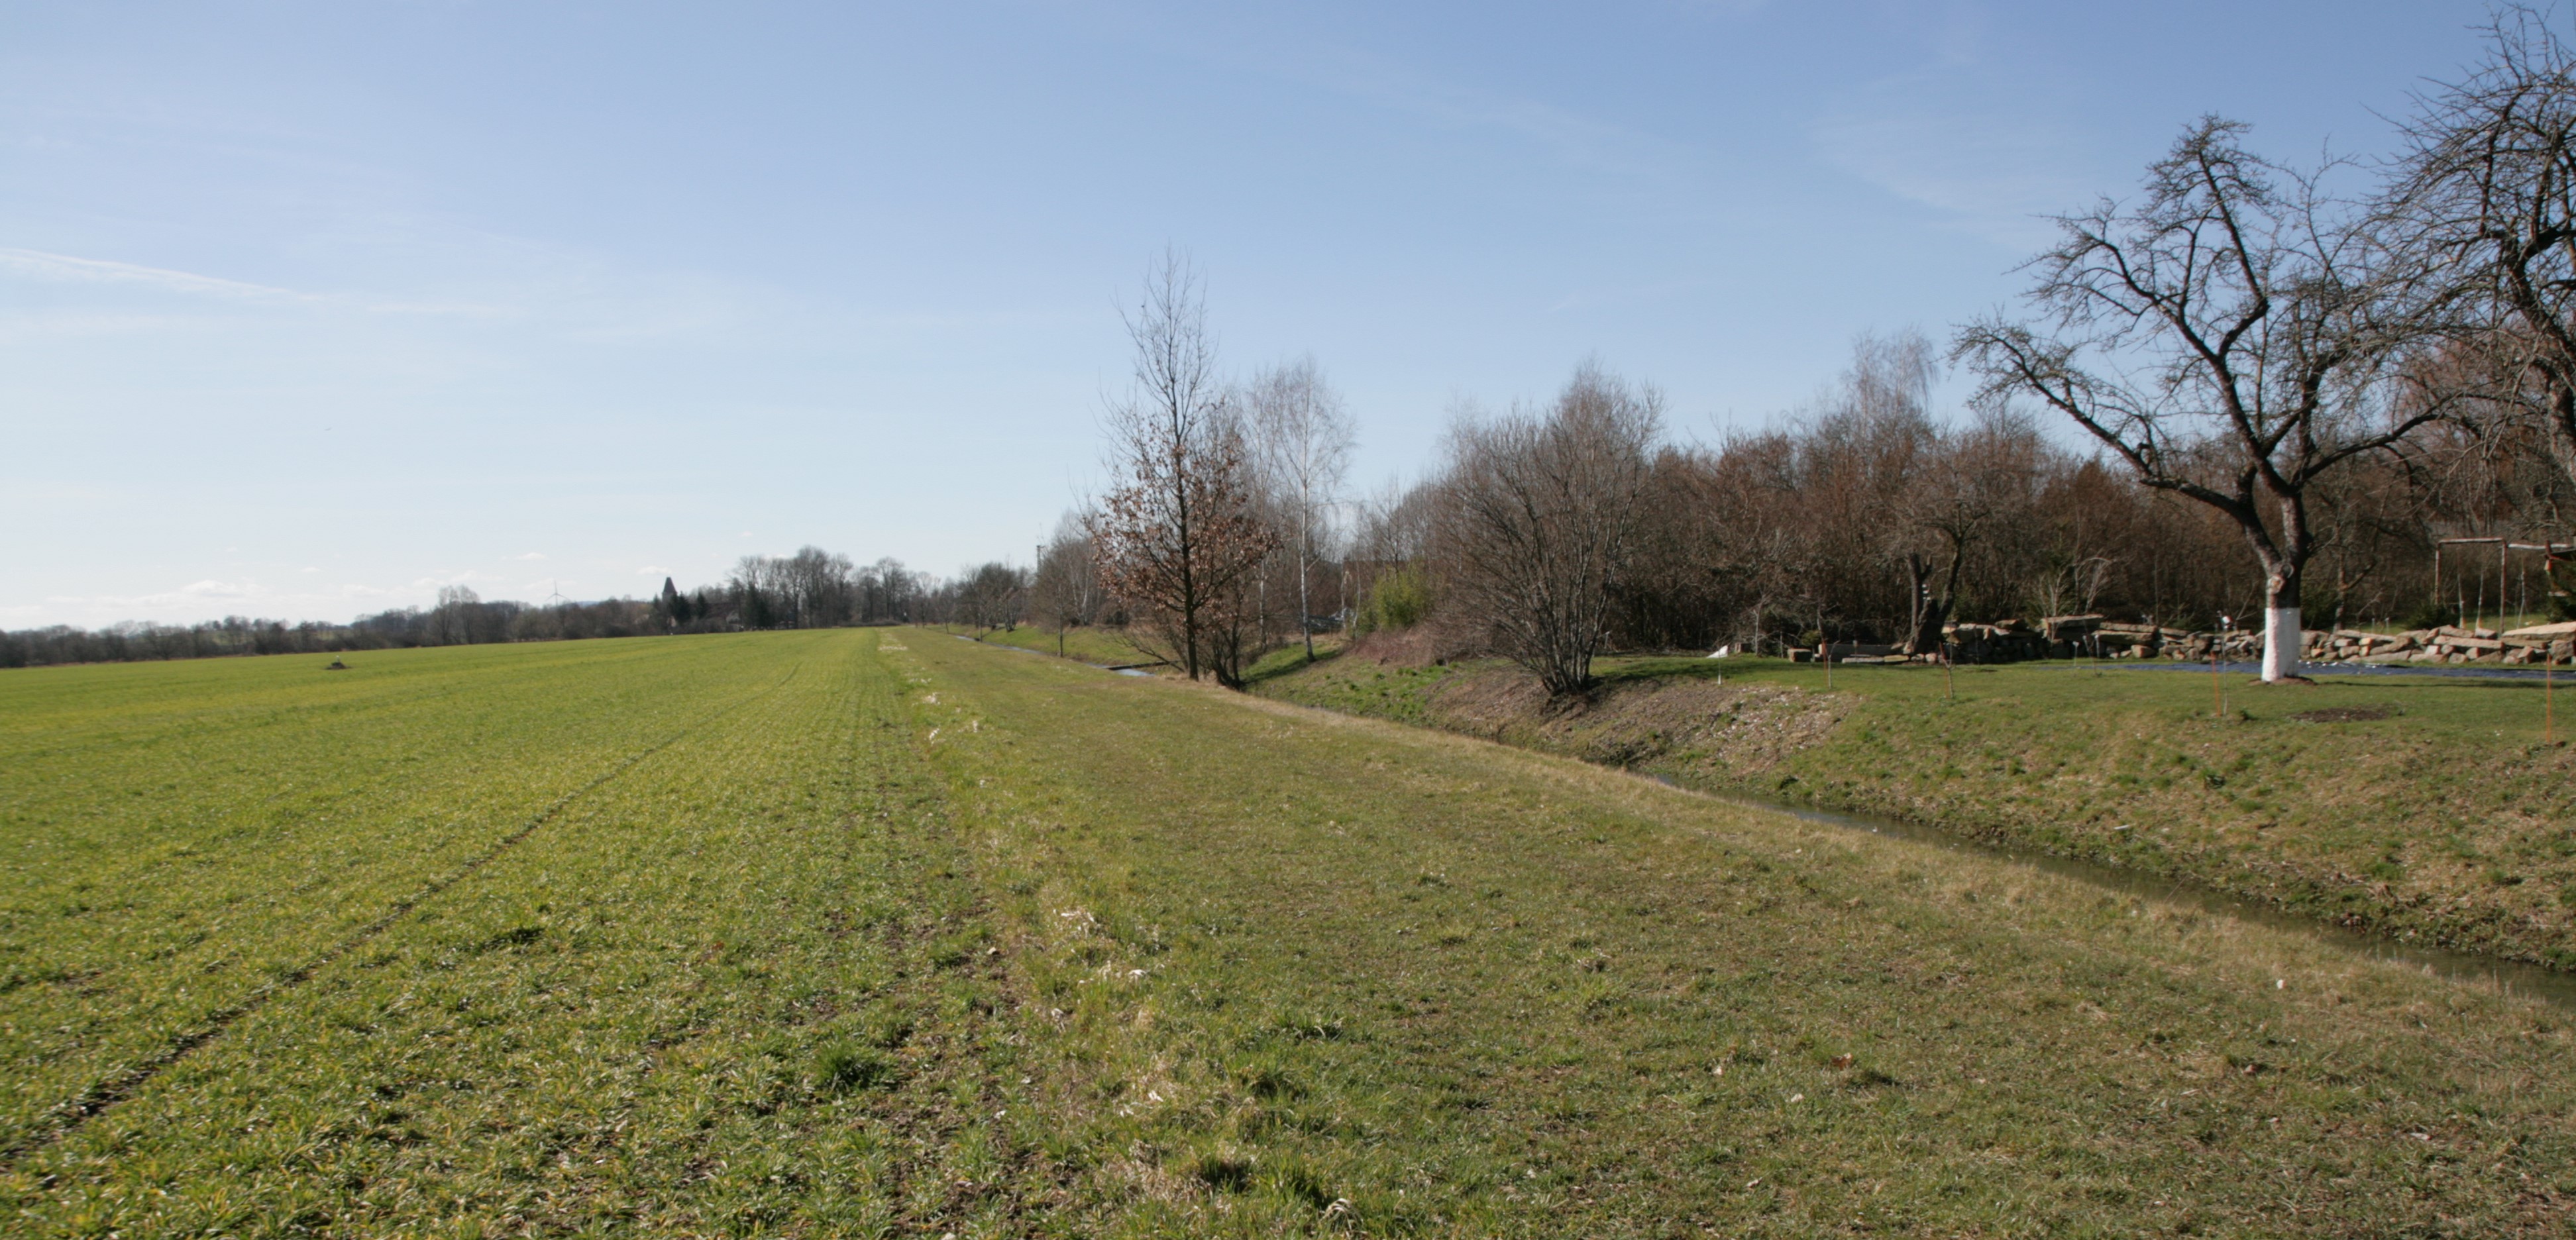
Riparian buffer strips refer to the permanent greening of arable land alongside streams and other water bodies. By slowing down runoff water from the land, they help to protect water bodies from diffuse pollution. Riparian buffer strips have multiple other environmental benefits, but disadvantages also.
2.2 Detailed description of the Technology
Description:
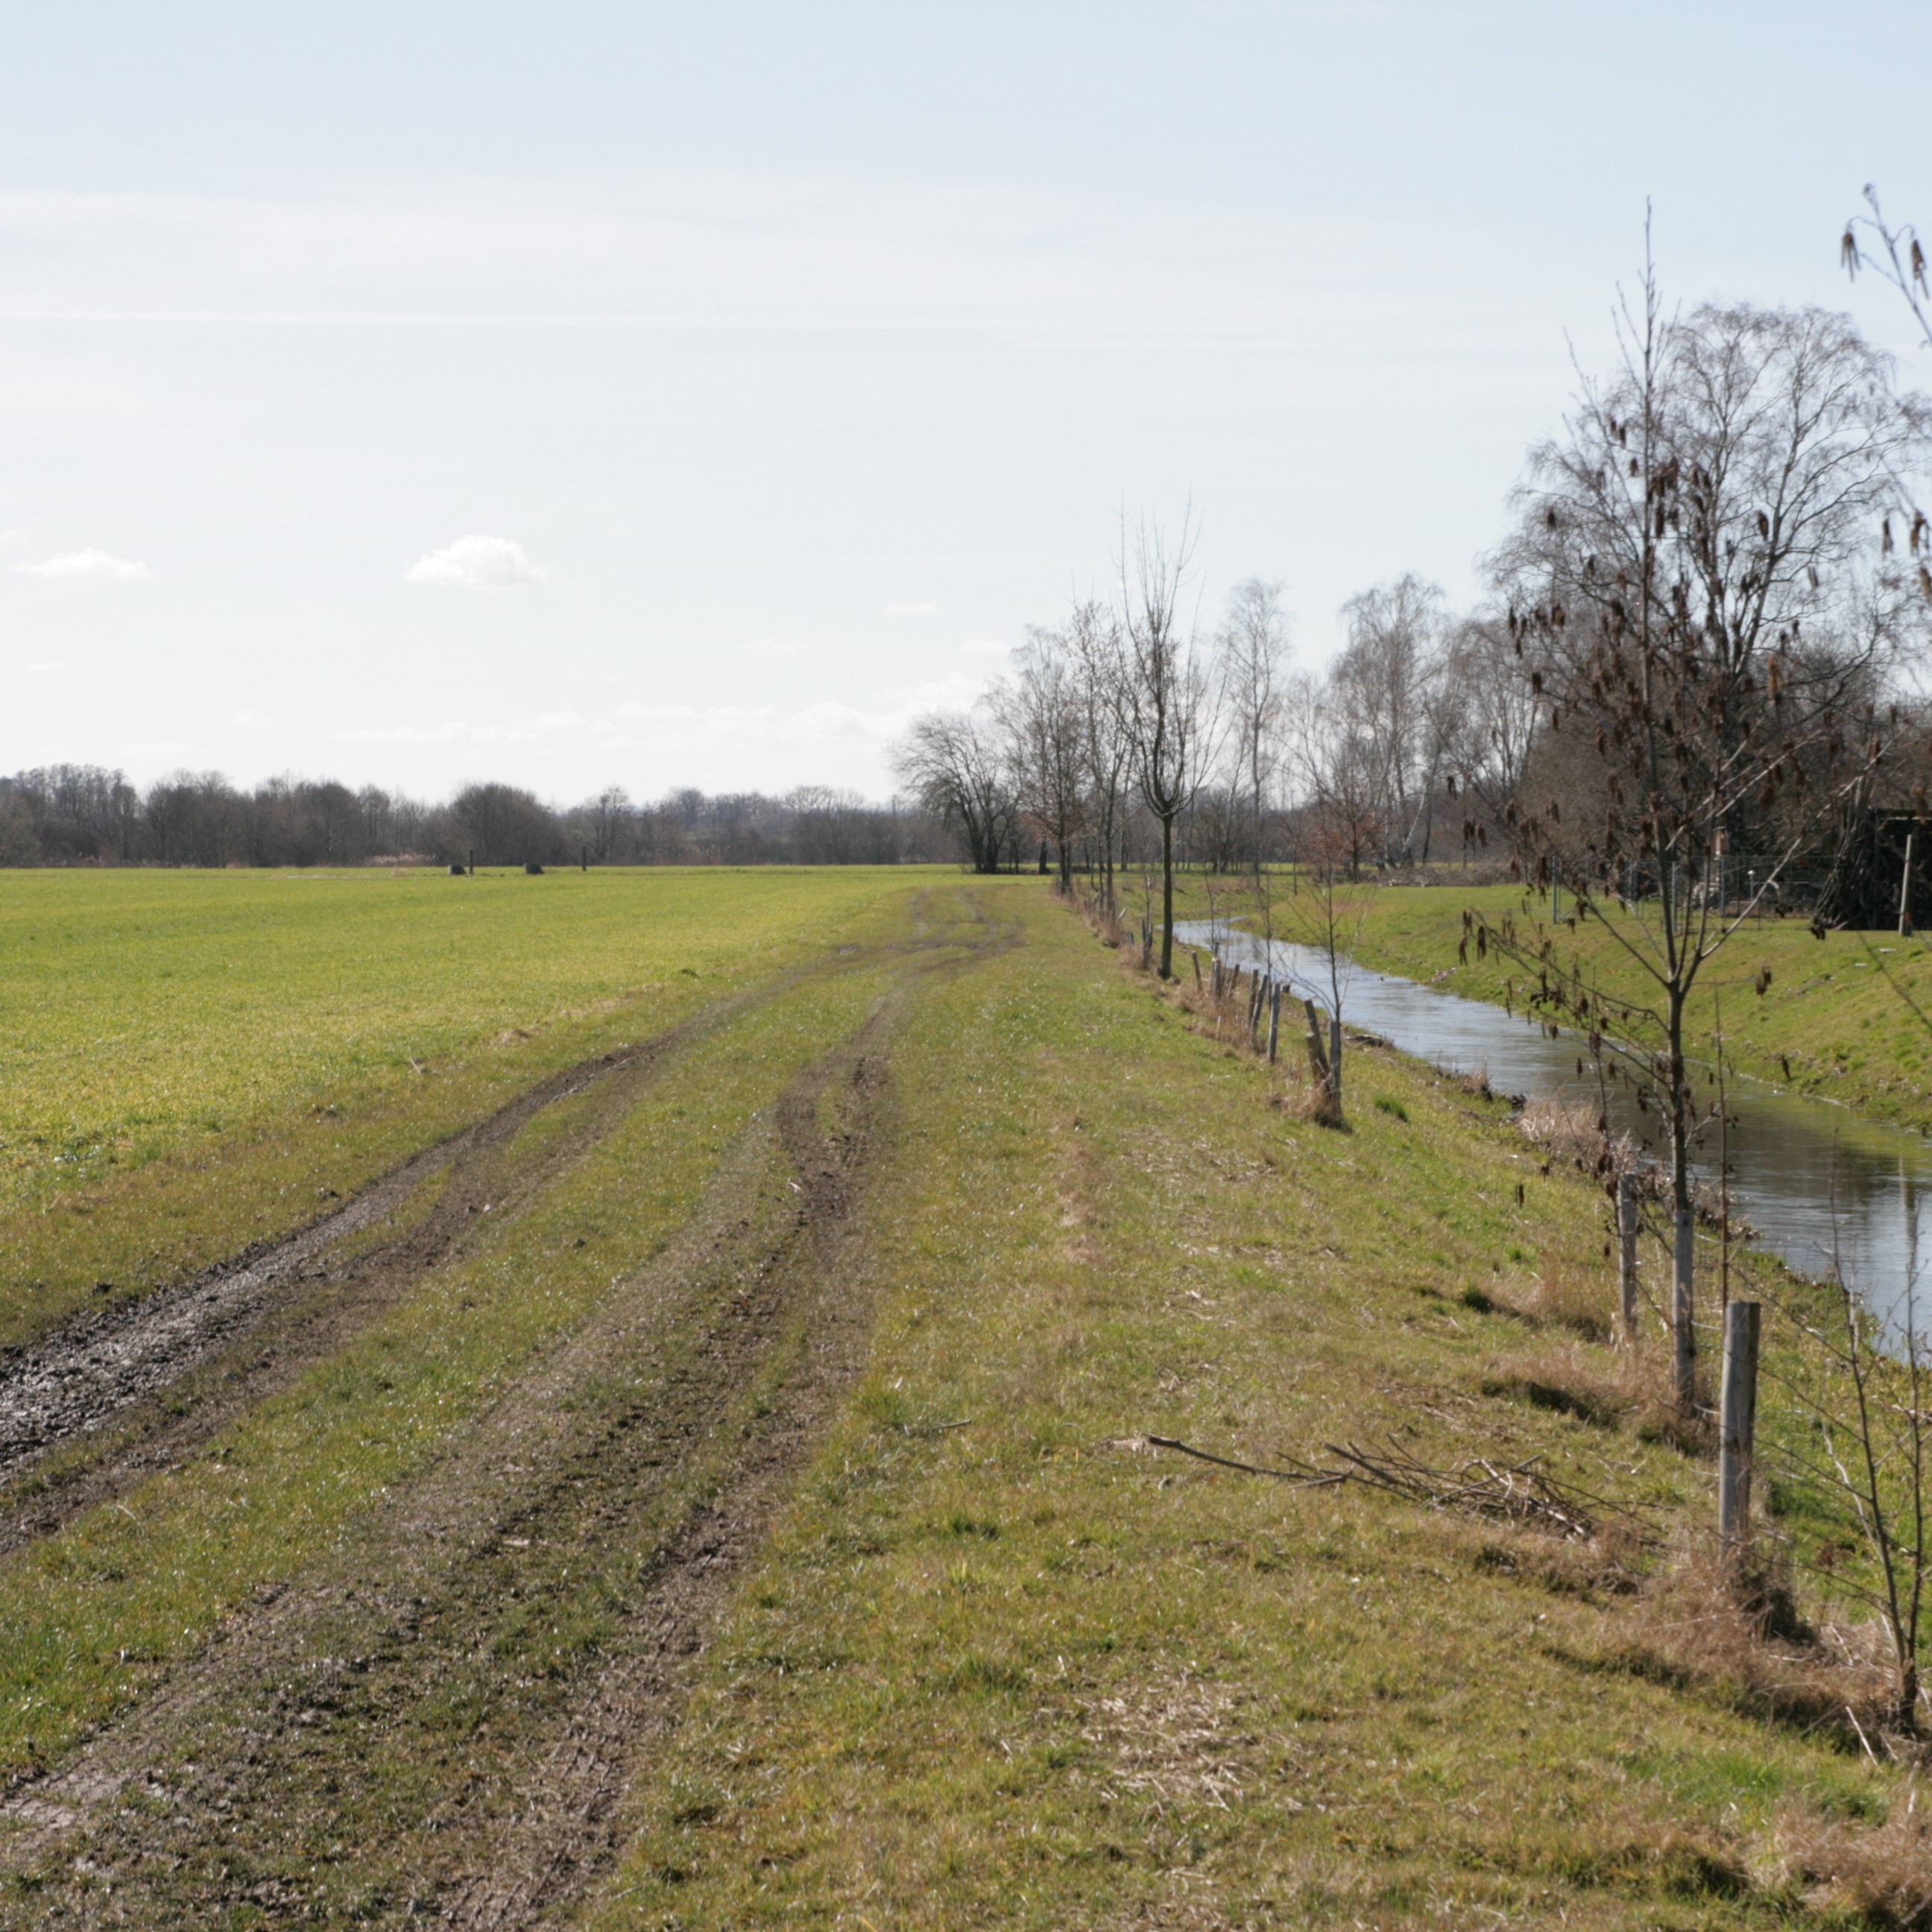
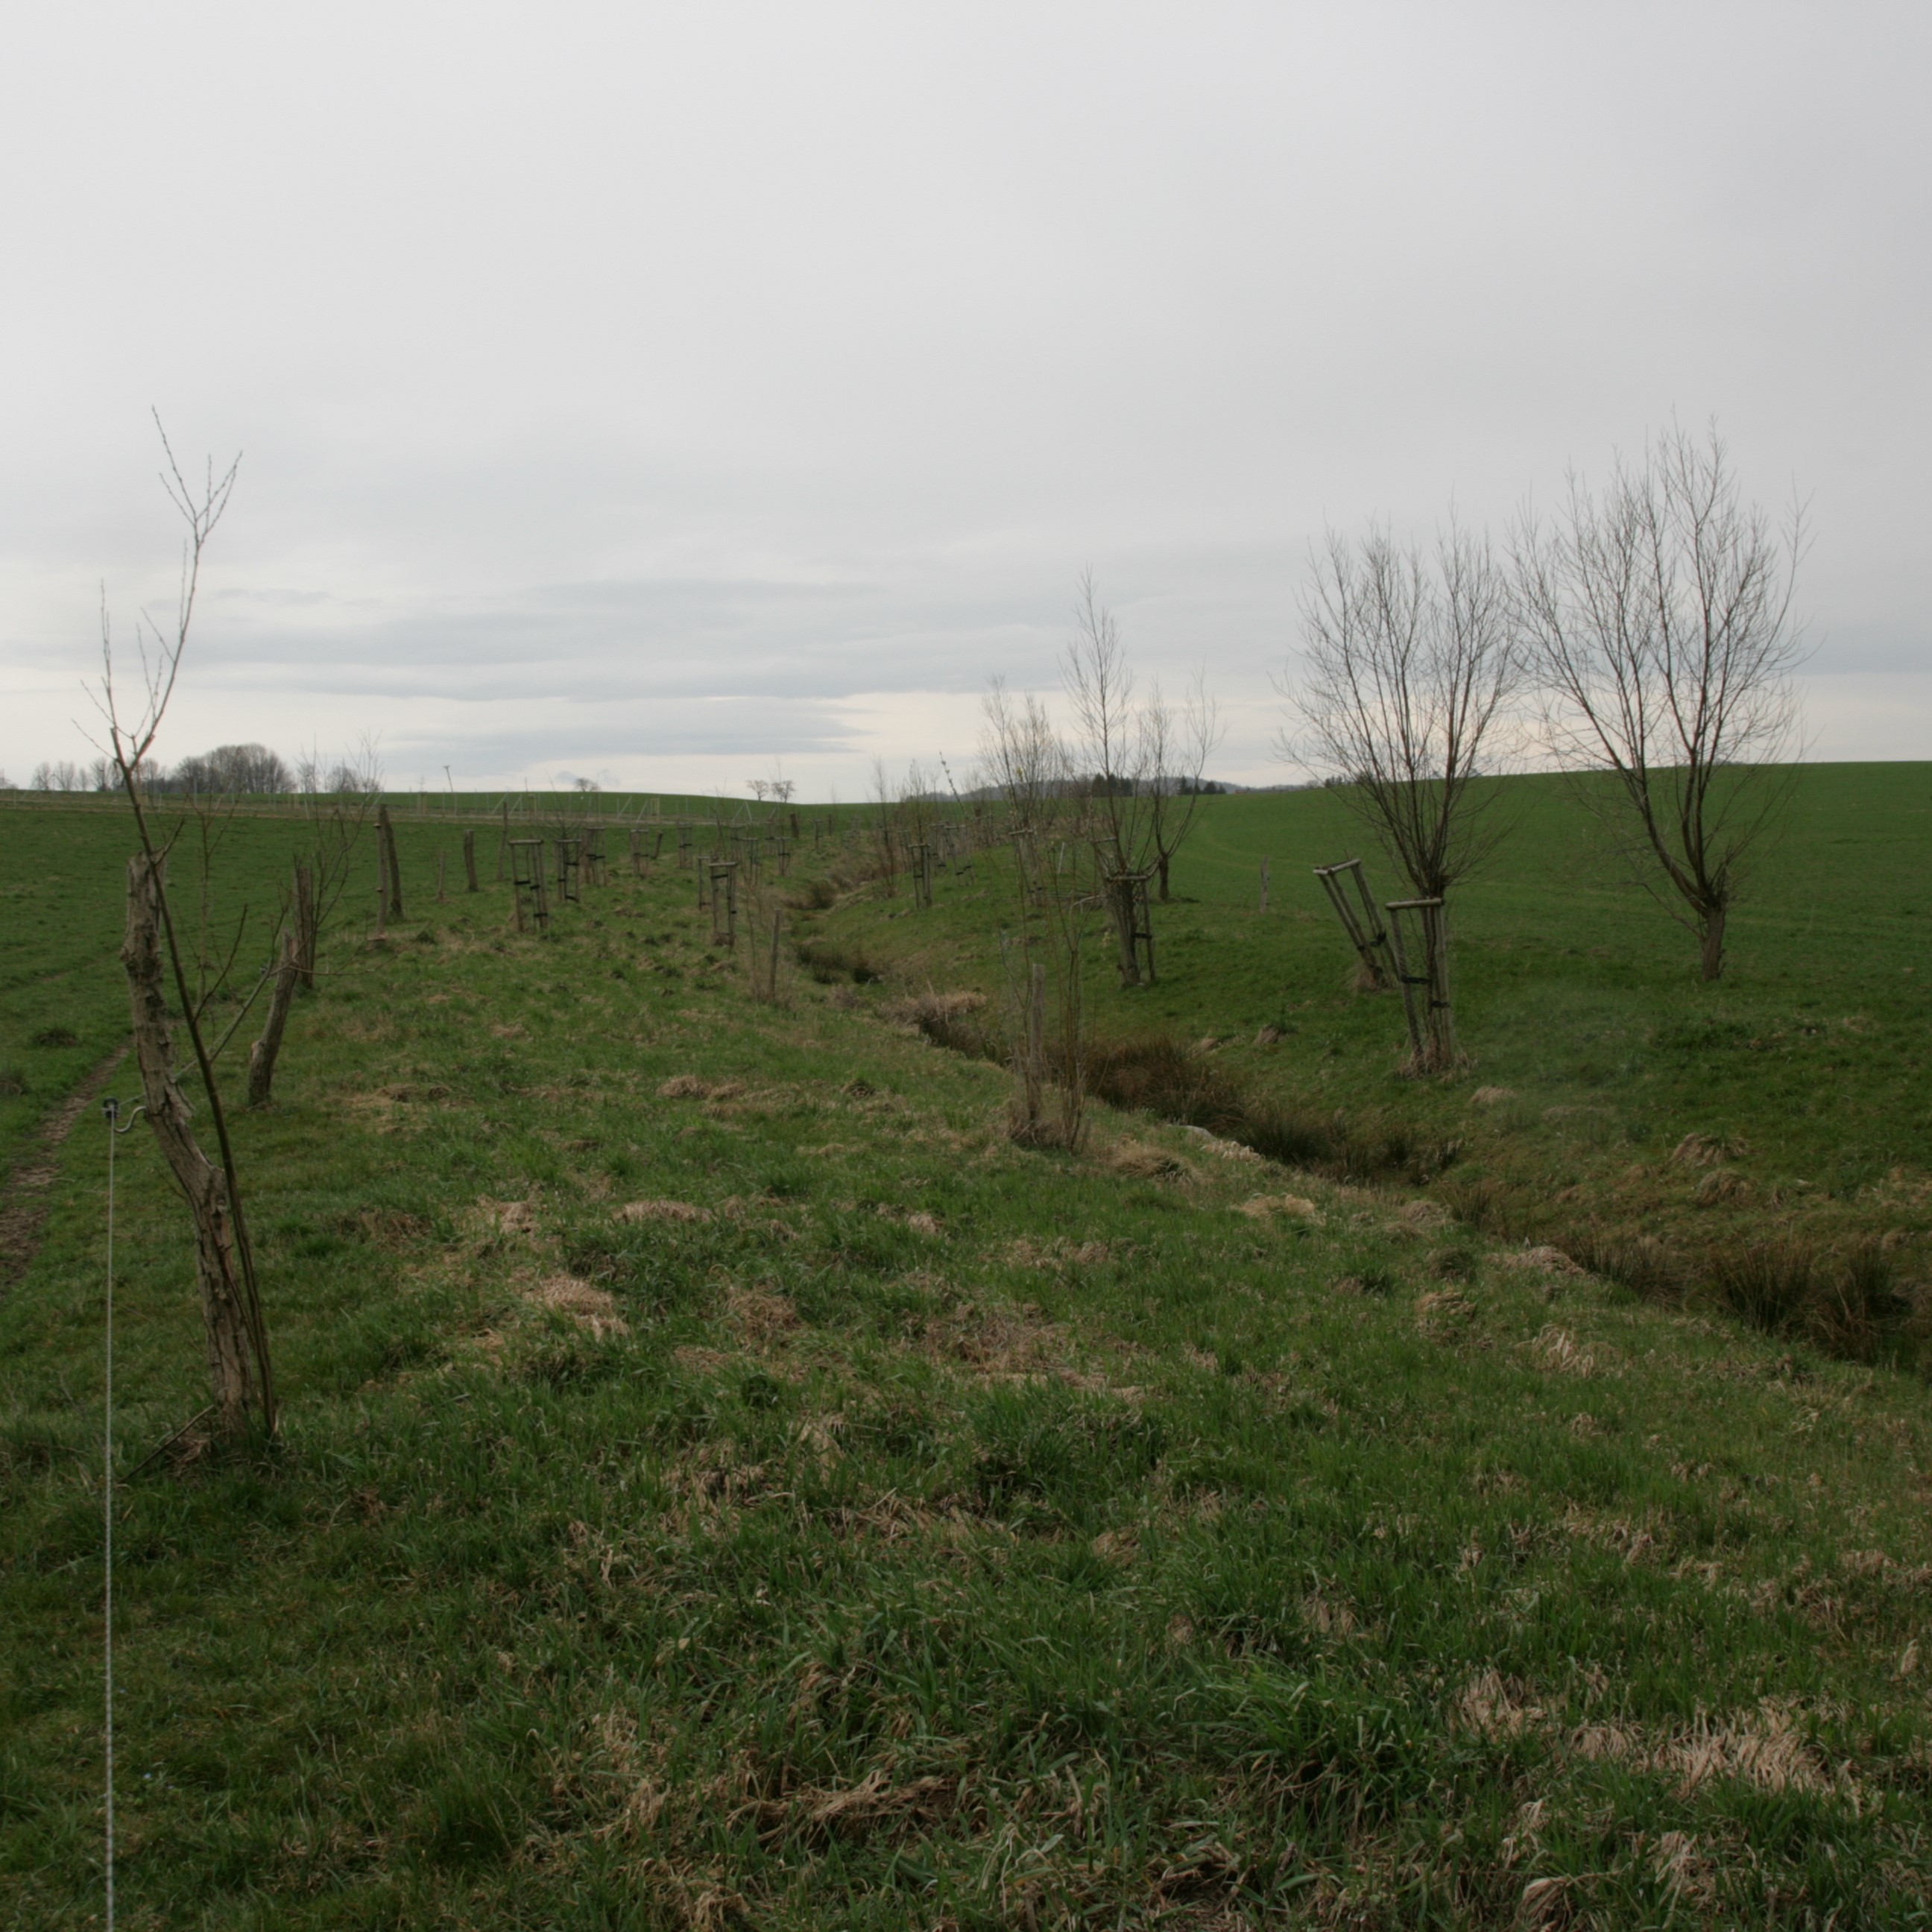
Riparian buffer strips comprise permanent, protective vegetation alongside streams and other water bodies. Our example represents a riparian buffer that evolved from set-aside land with naturally recovered vegetation. For the farmer, this has several advantages in terms of implementation, maintenance and seed costs. The farmer was able to simply leave the buffer strip open after ploughing without seeding or rolling, and maintenance requires only one mowing operation per year.
Riparian buffer strips are established at the edge of cultivated areas adjacent to water bodies. The width of the strip should be 5-15 m. In our example, the width of the buffer strip was 6 m, which was defined by working width of the mower. Depending on the type and width of the buffer, the rainfall intensity, the slope and the management, different filtering capacities can be attained by a buffer. An effective strip can retain 70% of the sediment and reduce nutrients in the surface runoff by 50%. However efficient retention of nutrients requires a buffer width of at least 15 m, while efficient retention of fine sediments requires a width of 15-20 m. The slope of the watercourse bank is also important: the optimum slope is 9-10%, and retention performance worsens with increasing slope (Kail et al. 2022).
Grass cover roughens the soil surface, slowing down the flow of water after heavy rainfall events and improving infiltration rates. Additionally, the roots of grasses increase infiltration, the plants absorb nitrate and prevent it from running off into the water bodies. Deeper roots, such as those from trees stabilize river banks, preventing bank erosion during heavy rainfall, as well as increasing shading of the stream. This improves the microclimate and creates better habitats for species native to the watercourse. Moreover, the buffer reduces the siltation of water bodies, preserves gravel bars, and thus preserves habitats. The buffer strip itself provides habitats for flora and fauna. The area adjacent to the buffer strip may experience increased dew formation and soil moisture, reduced evaporation, and wind protection.
The surface roughness of the grassed buffer strip depends on the type of vegetation. Cold-tolerant grasses such as perennial ryegrass (Lolium perenne) are commonly used, but a mix of grasses and trees is even better. Grassland provides an evenly distributed surface cover and the trees, with their deeper roots, provider higher infiltration capacity. Fast growing, low maintenance and regional species are optimal.
Proper maintenance is important for permanent erosion control. In case of nutrient-rich runoff from adjacent fields, the buffer strip may become saturated after a while and nitrification increases. Nitrous oxide is then produced which is a powerful greenhouse gases. In addition, the soil/vegetation is no longer able to absorb new nutrients, and they are washed into the water body. Mowing once per year removes biomass and can prevent nutrient saturation (Cole et al. 2020).
However, while promoting biodiversity and reducing soil erosion, buffer strips have a major downside for land-users and land-owners. They consume cropland, which leads to a decrease in production. The grass mixture can be used as fodder, but usually this does not compensate for the loss of production, which is why farmers often call for appropriate subsidies.
2.3 Photos of the Technology
Media Gallery
2.5 Country/ region/ locations where the Technology has been applied and which are covered by this assessment
Country:
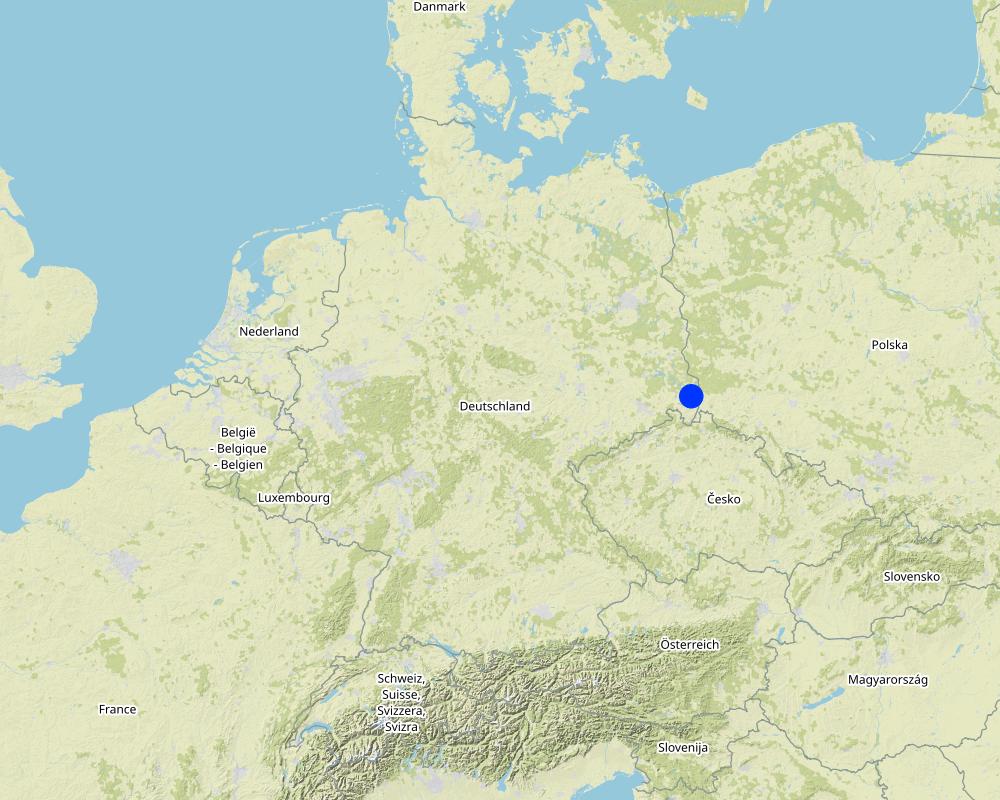
Germany
Region/ State/ Province:
Saxony
Further specification of location:
Nieder Seifersdorf
Specify the spread of the Technology:
- applied at specific points/ concentrated on a small area
Is/are the technology site(s) located in a permanently protected area?
No
Map
×2.6 Date of implementation
Indicate year of implementation:
2013
2.7 Introduction of the Technology
Specify how the Technology was introduced:
- through projects/ external interventions
Comments (type of project, etc.):
In order to meet the greening requirements of the CAP, 4% of the total agricultural area of a farm must be used, for example, for crop diversification, maintenance of permanent grassland or creation of ecological priority areas in order to receive direct payments from the state. In this case, a self-vegetated fallow was established as an ecological priority area to fulfill the greening requirements.
3. Classification of the SLM Technology
3.1 Main purpose(s) of the Technology
- reduce, prevent, restore land degradation
- conserve ecosystem
- protect a watershed/ downstream areas – in combination with other Technologies
- preserve/ improve biodiversity
3.2 Current land use type(s) where the Technology is applied
Land use mixed within the same land unit:
No
Unproductive land
Specify:
self-vegetated fallow
Remarks:
maintenance activity: mowing
3.3 Has land use changed due to the implementation of the Technology?
Has land use changed due to the implementation of the Technology?
- Yes (Please fill out the questions below with regard to the land use before implementation of the Technology)
Land use mixed within the same land unit:
No

Cropland
- Annual cropping
Annual cropping - Specify crops:
- cereals - barley
- cereals - maize
- cereals - rye
- cereals - wheat (winter)
Is intercropping practiced?
No
Is crop rotation practiced?
Yes
If yes, specify:
winter rye, winter wheat, silage maize, winter wheat, winter rye, winter barley, silage maize, winter barley, winter rye
3.4 Water supply
Water supply for the land on which the Technology is applied:
- rainfed
3.5 SLM group to which the Technology belongs
- area closure (stop use, support restoration)
- improved ground/ vegetation cover
- cross-slope measure
3.6 SLM measures comprising the Technology

vegetative measures
- V2: Grasses and perennial herbaceous plants
3.7 Main types of land degradation addressed by the Technology

soil erosion by water
- Wt: loss of topsoil/ surface erosion
- Wg: gully erosion/ gullying
- Wr: riverbank erosion
- Wo: offsite degradation effects

chemical soil deterioration
- Cn: fertility decline and reduced organic matter content (not caused by erosion)

physical soil deterioration
- Pc: compaction
- Pk: slaking and crusting
- Pw: waterlogging

biological degradation
- Bc: reduction of vegetation cover
- Bh: loss of habitats
- Bs: quality and species composition/ diversity decline
- Bl: loss of soil life

water degradation
- Hp: decline of surface water quality
- Hq: decline of groundwater quality
- Hw: reduction of the buffering capacity of wetland areas
3.8 Prevention, reduction, or restoration of land degradation
Specify the goal of the Technology with regard to land degradation:
- prevent land degradation
- reduce land degradation
4. Technical specifications, implementation activities, inputs, and costs
4.1 Technical drawing of the Technology
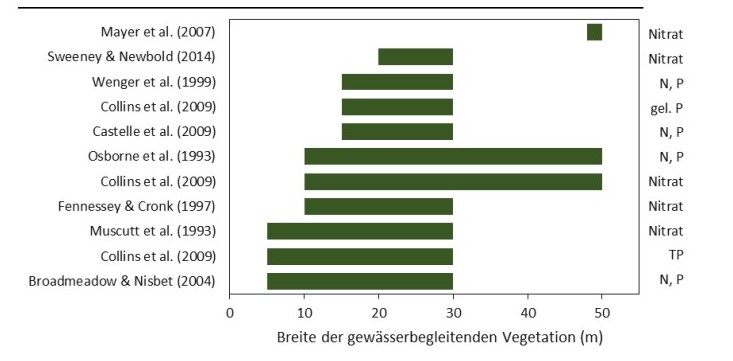
Technical specifications (related to technical drawing):
Widths of the vegetation along the watercourse required for effective nutrient retention (approx. >80%) mentioned in the reviews.
Author:
Kail et al. (2022), p.25
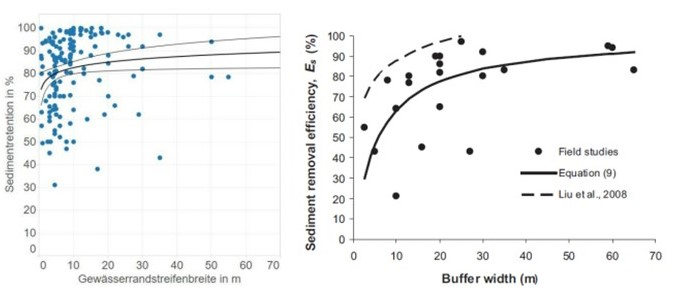
Technical specifications (related to technical drawing):
Summary of field studies of sediment retention as a function of buffer strip width under controlled, optimal conditions (left figure) and under realistic, non-optimal conditions (right figure).
Author:
Kail et al. (2022), p.37
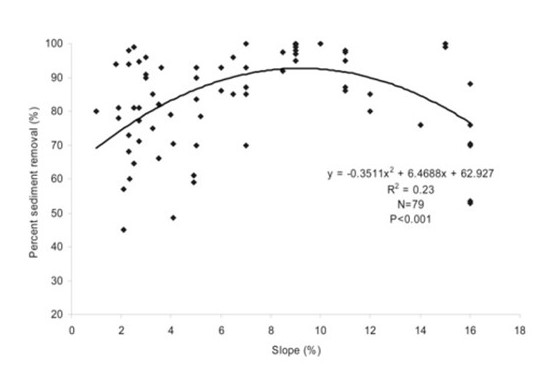
Technical specifications (related to technical drawing):
Sediment retention as a function of the slope of a buffer strip.
Author:
Kail et al. (2022), p.38
4.2 General information regarding the calculation of inputs and costs
Specify how costs and inputs were calculated:
- per Technology area
Indicate size and area unit:
1 ha
other/ national currency (specify):
€
If relevant, indicate exchange rate from USD to local currency (e.g. 1 USD = 79.9 Brazilian Real): 1 USD =:
0.91
Indicate average wage cost of hired labour per day:
18.70€ per hour
4.3 Establishment activities
Comments:
There are no establishment activities needed.
4.5 Maintenance/ recurrent activities
| Activity | Timing/ frequency | |
|---|---|---|
| 1. | Mowing | annually at the end of July |
Comments:
The farmer in this case study mowed the grass and removed the biomass to prevent nutrient saturation in the riparian buffer. However, the amount of hay yield is small and not relevant according to the farmer.
4.6 Costs and inputs needed for maintenance/ recurrent activities (per year)
| Specify input | Unit | Quantity | Costs per Unit | Total costs per input | % of costs borne by land users | |
|---|---|---|---|---|---|---|
| Labour | mowing | ha | 1.0 | 25.0 | 25.0 | |
| Total costs for maintenance of the Technology | 25.0 | |||||
| Total costs for maintenance of the Technology in USD | 27.47 | |||||
If land user bore less than 100% of costs, indicate who covered the remaining costs:
121€/ha were covered by the state of Saxony as a subsidy (AL 5b- self-vegetated perennial needs on arable land; SMUL Sachsen, 2015).
4.7 Most important factors affecting the costs
Describe the most determinate factors affecting the costs:
A riparian buffer that developed from set-aside land with naturally recovered vegetation is not costly, as it requires only one mowing operation per year and nothing else. However, the buffer consumes agricultural land, leading to a reduction in agricultural production.
5. Natural and human environment
5.1 Climate
Annual rainfall
- < 250 mm
- 251-500 mm
- 501-750 mm
- 751-1,000 mm
- 1,001-1,500 mm
- 1,501-2,000 mm
- 2,001-3,000 mm
- 3,001-4,000 mm
- > 4,000 mm
Specify average annual rainfall (if known), in mm:
775.00
Indicate the name of the reference meteorological station considered:
https://whh-kliwes.de/mapview
Agro-climatic zone
- sub-humid
Length of growing period (LGP): 209
(https://www.umwelt.sachsen.de/dauer-der-vegetationsperiode-30631.html)
5.2 Topography
Slopes on average:
- flat (0-2%)
- gentle (3-5%)
- moderate (6-10%)
- rolling (11-15%)
- hilly (16-30%)
- steep (31-60%)
- very steep (>60%)
Landforms:
- plateau/plains
- ridges
- mountain slopes
- hill slopes
- footslopes
- valley floors
Altitudinal zone:
- 0-100 m a.s.l.
- 101-500 m a.s.l.
- 501-1,000 m a.s.l.
- 1,001-1,500 m a.s.l.
- 1,501-2,000 m a.s.l.
- 2,001-2,500 m a.s.l.
- 2,501-3,000 m a.s.l.
- 3,001-4,000 m a.s.l.
- > 4,000 m a.s.l.
Indicate if the Technology is specifically applied in:
- not relevant
5.3 Soils
Soil depth on average:
- very shallow (0-20 cm)
- shallow (21-50 cm)
- moderately deep (51-80 cm)
- deep (81-120 cm)
- very deep (> 120 cm)
Soil texture (topsoil):
- coarse/ light (sandy)
Soil texture (> 20 cm below surface):
- coarse/ light (sandy)
Topsoil organic matter:
- medium (1-3%)
If available, attach full soil description or specify the available information, e.g. soil type, soil PH/ acidity, Cation Exchange Capacity, nitrogen, salinity etc.
Gleysol
5.4 Water availability and quality
Ground water table:
< 5 m
Availability of surface water:
poor/ none
Water quality (untreated):
poor drinking water (treatment required)
Water quality refers to:
surface water
Is water salinity a problem?
No
Is flooding of the area occurring?
No
5.5 Biodiversity
Species diversity:
- low
Habitat diversity:
- low
Comments and further specifications on biodiversity:
Normally, a self-vegetated fallow has a high species diversity (depending on the seeds present in the soil) and a medium habitat diversity. Unfortunately, the documented self-vegetated fallow is not properly maintained and the beneficial effects, e.g. species and habitat diversity, are correspondingly low.
5.6 Characteristics of land users applying the Technology
Sedentary or nomadic:
- Sedentary
Market orientation of production system:
- commercial/ market
Off-farm income:
- less than 10% of all income
Relative level of wealth:
- average
Individuals or groups:
- individual/ household
Level of mechanization:
- mechanized/ motorized
Gender:
- women
- men
Age of land users:
- middle-aged
5.7 Average area of land used by land users applying the Technology
- < 0.5 ha
- 0.5-1 ha
- 1-2 ha
- 2-5 ha
- 5-15 ha
- 15-50 ha
- 50-100 ha
- 100-500 ha
- 500-1,000 ha
- 1,000-10,000 ha
- > 10,000 ha
Is this considered small-, medium- or large-scale (referring to local context)?
- large-scale
5.8 Land ownership, land use rights, and water use rights
Land ownership:
- individual, not titled
Land use rights:
- leased
- individual
Water use rights:
- communal (organized)
Are land use rights based on a traditional legal system?
No
5.9 Access to services and infrastructure
health:
- poor
- moderate
- good
education:
- poor
- moderate
- good
technical assistance:
- poor
- moderate
- good
employment (e.g. off-farm):
- poor
- moderate
- good
markets:
- poor
- moderate
- good
energy:
- poor
- moderate
- good
roads and transport:
- poor
- moderate
- good
drinking water and sanitation:
- poor
- moderate
- good
financial services:
- poor
- moderate
- good
6. Impacts and concluding statements
6.1 On-site impacts the Technology has shown
Socio-economic impacts
Production
crop production
crop quality
risk of production failure
production area
Income and costs
expenses on agricultural inputs
farm income
diversity of income sources
workload
Ecological impacts
Water cycle/ runoff
surface runoff
Soil
soil moisture
soil cover
soil loss
Comments/ specify:
decreased wind erosion
soil compaction
soil organic matter/ below ground C
Biodiversity: vegetation, animals
Vegetation cover
plant diversity
invasive alien species
habitat diversity
Climate and disaster risk reduction
drought impacts
Specify assessment of on-site impacts (measurements):
The assessment is based on the response of the interviewed farmer and not based on on-site measurements.
6.2 Off-site impacts the Technology has shown
groundwater/ river pollution
Specify assessment of off-site impacts (measurements):
The assessment is based on the expertise of the compilers and not based on measurements in the case study.
6.3 Exposure and sensitivity of the Technology to gradual climate change and climate-related extremes/ disasters (as perceived by land users)
Gradual climate change
Gradual climate change
| Season | increase or decrease | How does the Technology cope with it? | |
|---|---|---|---|
| other gradual climate change | changing weather conditions | increase | well |
6.4 Cost-benefit analysis
How do the benefits compare with the maintenance/ recurrent costs (from land users' perspective)?
Short-term returns:
slightly negative
Long-term returns:
slightly negative
Comments:
No establishment costs. Comment by the farmer: "There is no benefit at all".
6.5 Adoption of the Technology
- 1-10%
Of all those who have adopted the Technology, how many did so spontaneously, i.e. without receiving any material incentives/ payments?
- 0-10%
6.6 Adaptation
Has the Technology been modified recently to adapt to changing conditions?
No
6.7 Strengths/ advantages/ opportunities of the Technology
| Strengths/ advantages/ opportunities in the compiler’s or other key resource person’s view |
|---|
| Increased infiltration rates |
| Reduced erosion and nutrient runoff into watercourse |
| Deeper roots, such as those of trees, stabilize river banks against break-off during heavy rainfall. |
| Trees increase shading and microclimate for stream species. |
6.8 Weaknesses/ disadvantages/ risks of the Technology and ways of overcoming them
| Weaknesses/ disadvantages/ risks in the land user’s view | How can they be overcome? |
|---|---|
| Loss in yield due to loss of arable land. | Accordingly, the yield loss should be offset by subsidies. Use grass mixture as fodder. |
7. References and links
7.1 Methods/ sources of information
- field visits, field surveys
1
- interviews with land users
1
- compilation from reports and other existing documentation
6
When were the data compiled (in the field)?
16/03/2023
7.2 References to available publications
Title, author, year, ISBN:
Kail et al. (2022): Ökologische Funktionen von Gewässerrandstreifen. LfULG Broschüre
Available from where? Costs?
https://publikationen.sachsen.de/bdb/artikel/40152
7.3 Links to relevant online information
Title/ description:
Cole et al. (2020): Managing riparian buffer strips to optimise ecosystem services: A review. Agriculture, Ecosystems & Environment 296
URL:
https://doi.org/10.1016/j.agee.2020.106891
Title/ description:
SMUL Sachsen (2015): Förderperiode 2014-2020 - Art. 28 der Verordnung (EU) Nr. 1305/2013 - Richtlinie Agrarumwelt- und Klimamaßnahmen (RL AUK/2015) - Sächsisches Agrarumwelt- und Naturschutzprogramm (AUNaP)
URL:
https://www.smul.sachsen.de/lfulg/download/AUK-Massnahmen-Ueberblick.pdf
Title/ description:
Hebblethwaite & Somody (2008): Progress in Best Management Practices. In: The Triazine Herbicides. 50 years Revolutionizing Agriculture
URL:
https://doi.org/10.1016/B978-044451167-6.50035-0
Links and modules
Expand all Collapse allLinks
No links
Modules
No modules