Permanent soil cover [Kenya]
- Creation:
- Update:
- Compiler: William Akwanyi
- Editors: Innocent Faith, Noel Templer, Leah Munala, Tabitha Nekesa, Ahmadou Gaye, Siagbé Golli
- Reviewers: William Critchley, Rima Mekdaschi Studer, Sally Bunning
technologies_6699 - Kenya
View sections
Expand all Collapse all1. General information
1.2 Contact details of resource persons and institutions involved in the assessment and documentation of the Technology
Key resource person(s)
land user:
Onjili Jared Kochwa
GFA farmer
Kenya
SLM specialist:
SLM specialist:
Name of project which facilitated the documentation/ evaluation of the Technology (if relevant)
Soil protection and rehabilitation for food security (ProSo(i)l)Name of the institution(s) which facilitated the documentation/ evaluation of the Technology (if relevant)
Deutsche Gesellschaft für Internationale Zusammenarbeit (GIZ)Name of the institution(s) which facilitated the documentation/ evaluation of the Technology (if relevant)
CIAT International Center for Tropical Agriculture (CIAT International Center for Tropical Agriculture) - Kenya1.3 Conditions regarding the use of data documented through WOCAT
The compiler and key resource person(s) accept the conditions regarding the use of data documented through WOCAT:
Yes
1.4 Declaration on sustainability of the described Technology
Is the Technology described here problematic with regard to land degradation, so that it cannot be declared a sustainable land management technology?
No
Comments:
Farmers who have implemented the technology have recorded an increase in crop production. The technology has not adversely affected their farms.
1.5 Reference to Questionnaire(s) on SLM Approaches (documented using WOCAT)
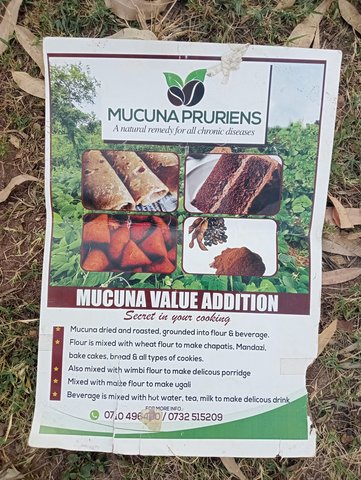
Mucuna value-addition for female farmers [Kenya]
Promoting mucuna seed processing for food and nutrition security and income generation encourages women farmers to plant mucuna as a cover crop that improves soil productivity.
- Compiler: William Akwanyi
Improving farmers' access to tools for conservation agriculture [Kenya]
Improving farmers' access to minimum tillage tools is an approach to increasing the adoption of conservation agriculture (CA) through linking them to institutions that fabricate the tools.
- Compiler: William Akwanyi
2. Description of the SLM Technology
2.1 Short description of the Technology
Definition of the Technology:
Permanent soil cover with cover crops and/or crop residues helps to control soil erosion, suppress weeds and build up soil fertility. It can also add organic matter to the soil.
2.2 Detailed description of the Technology
Description:
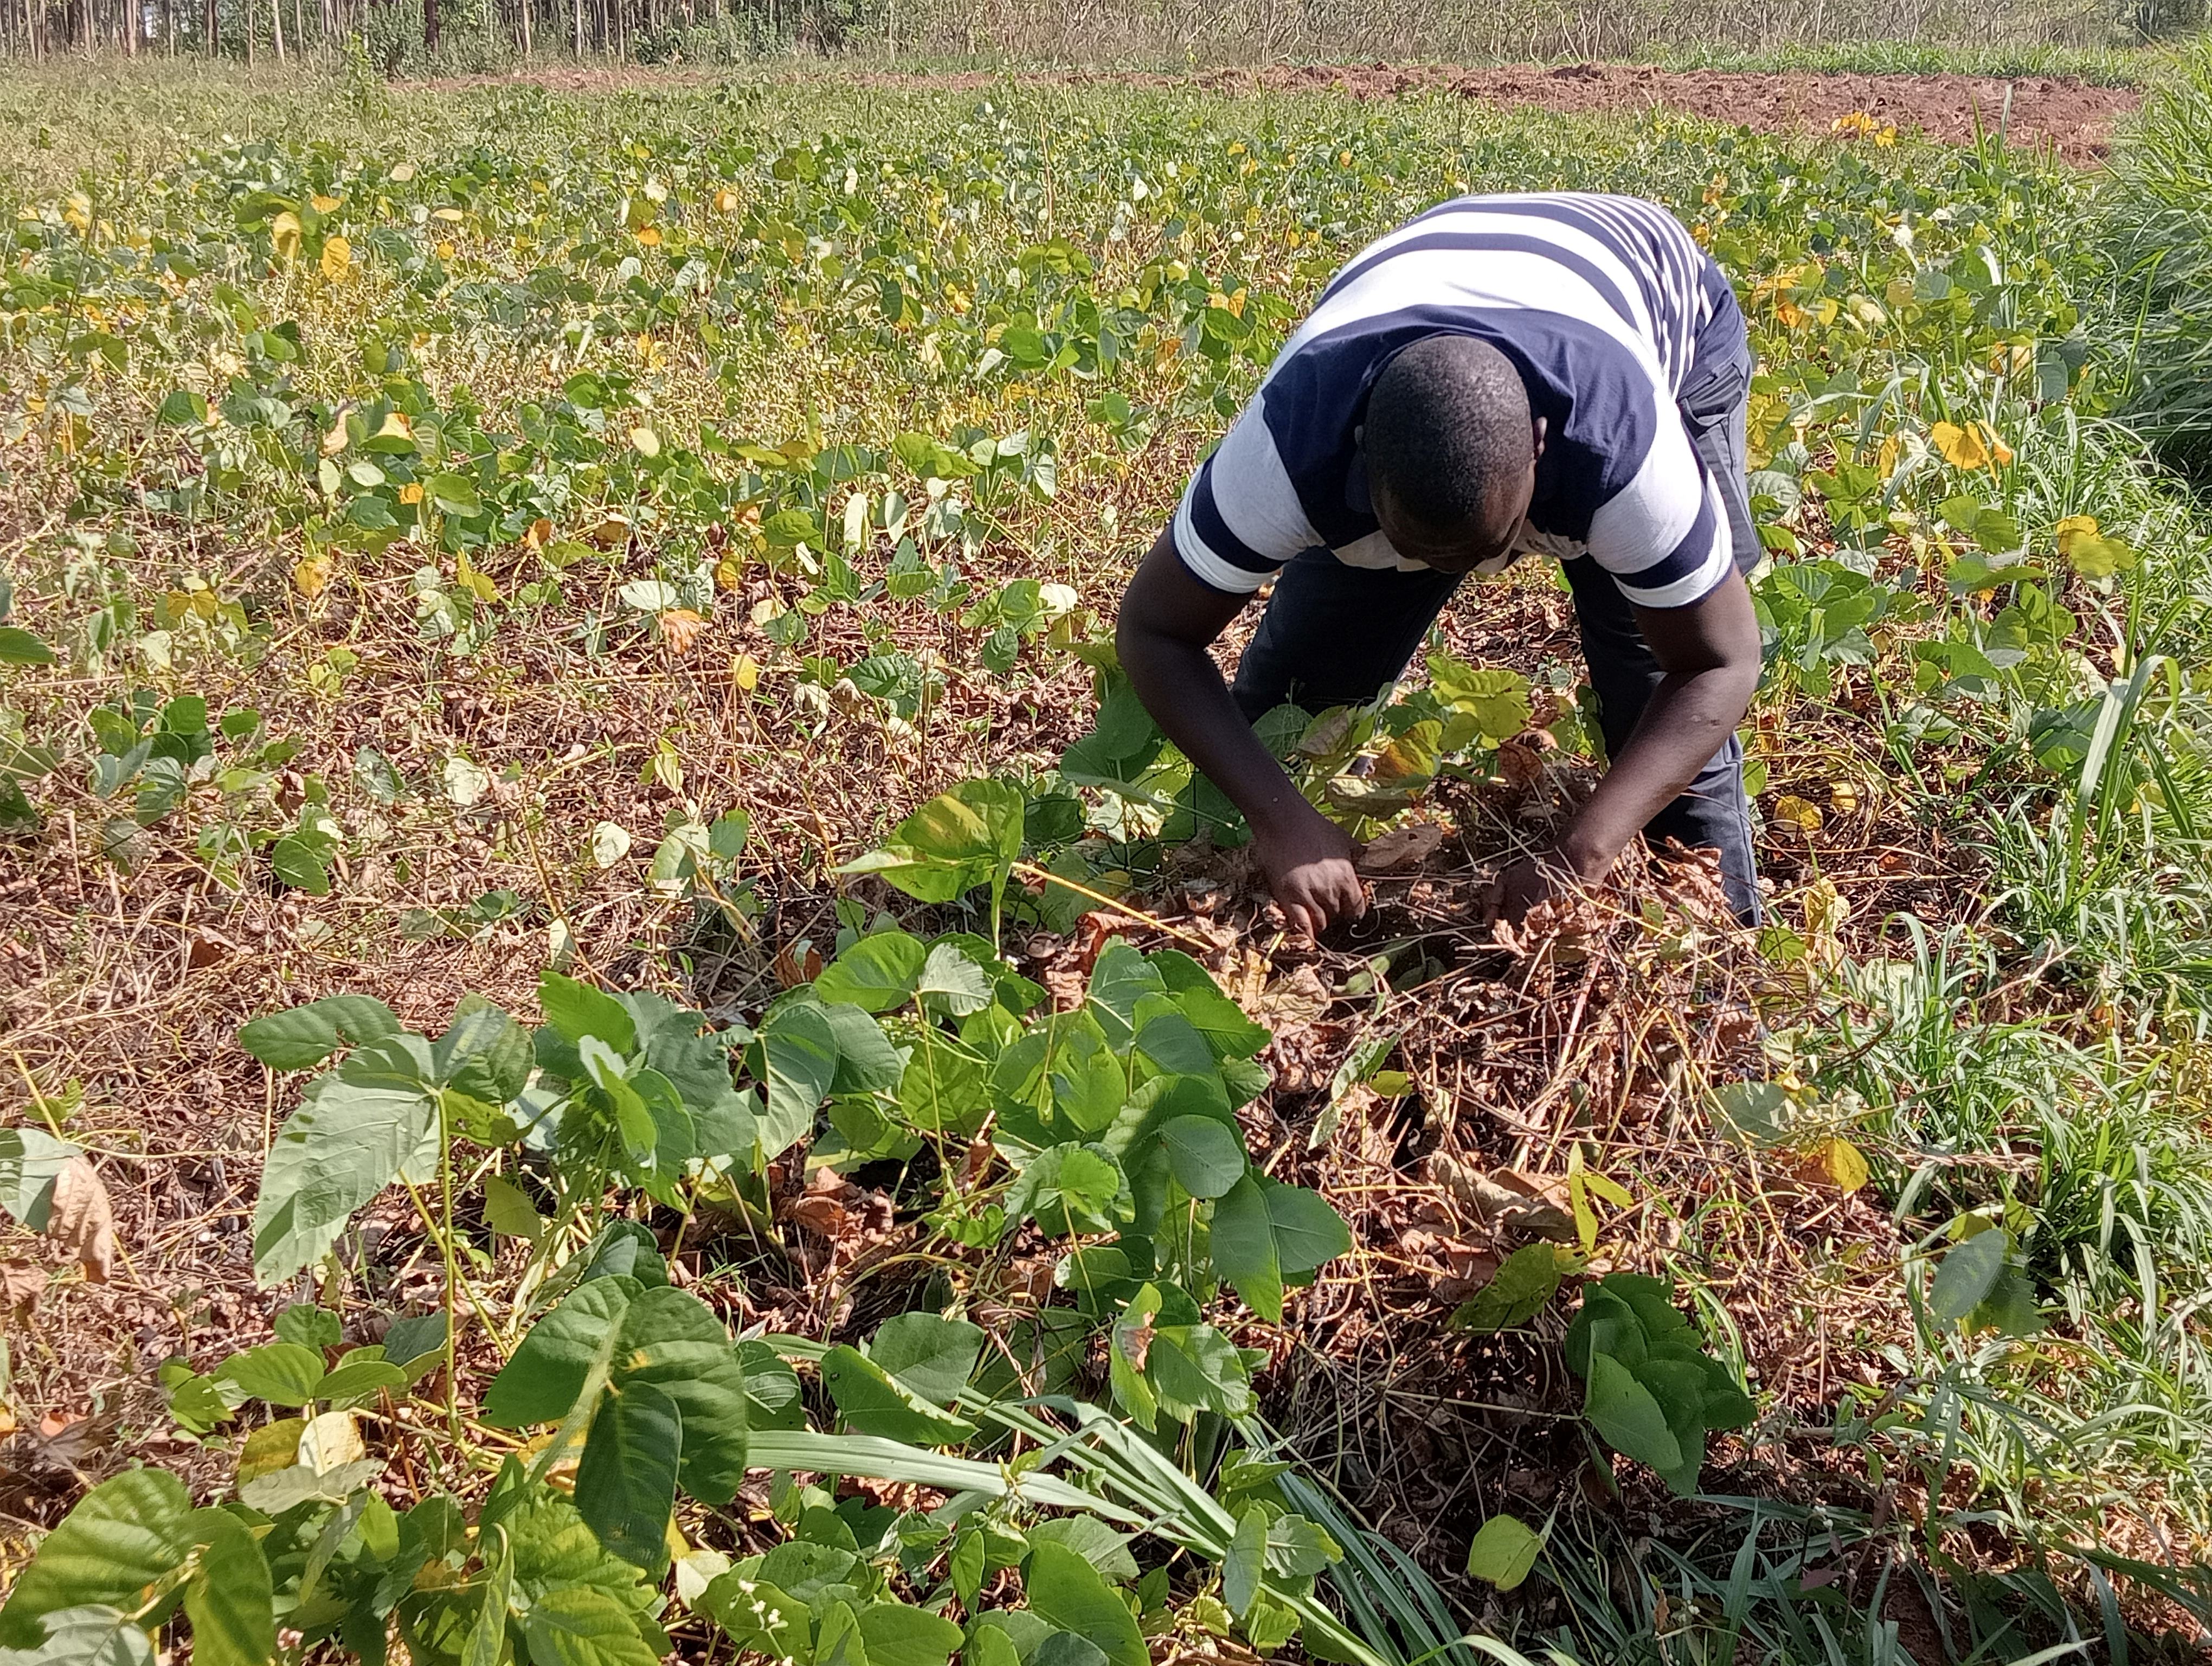
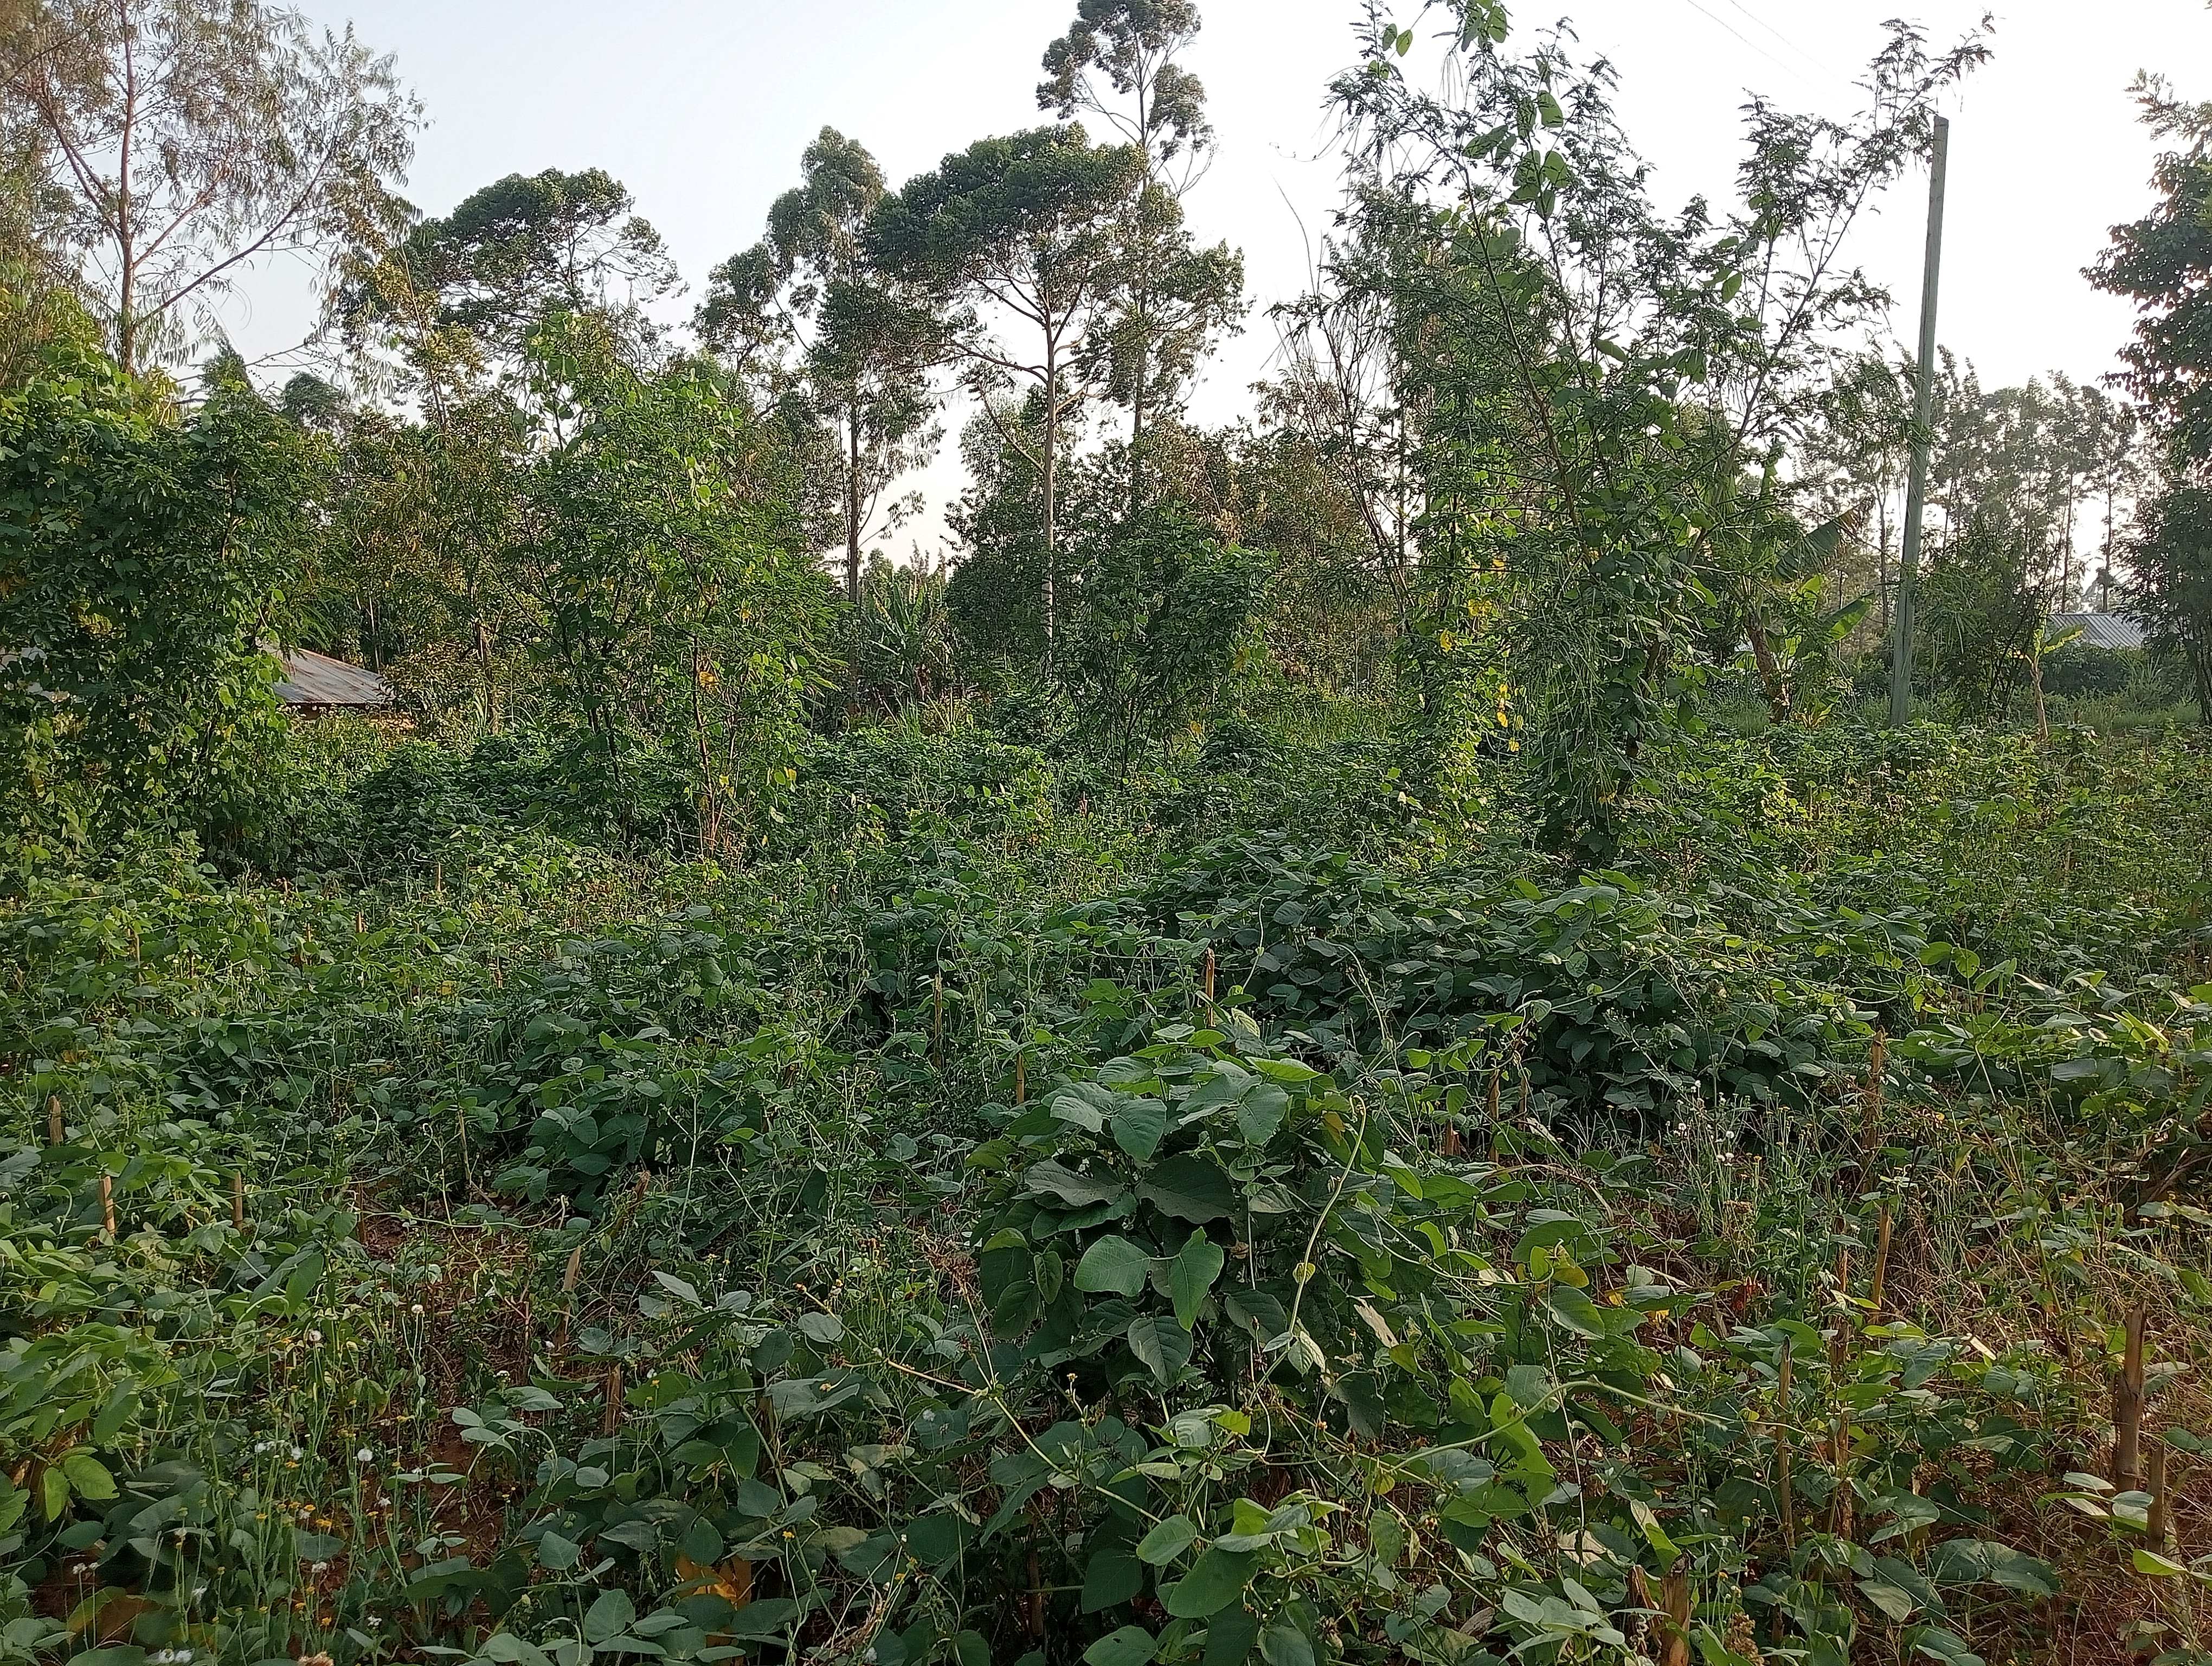
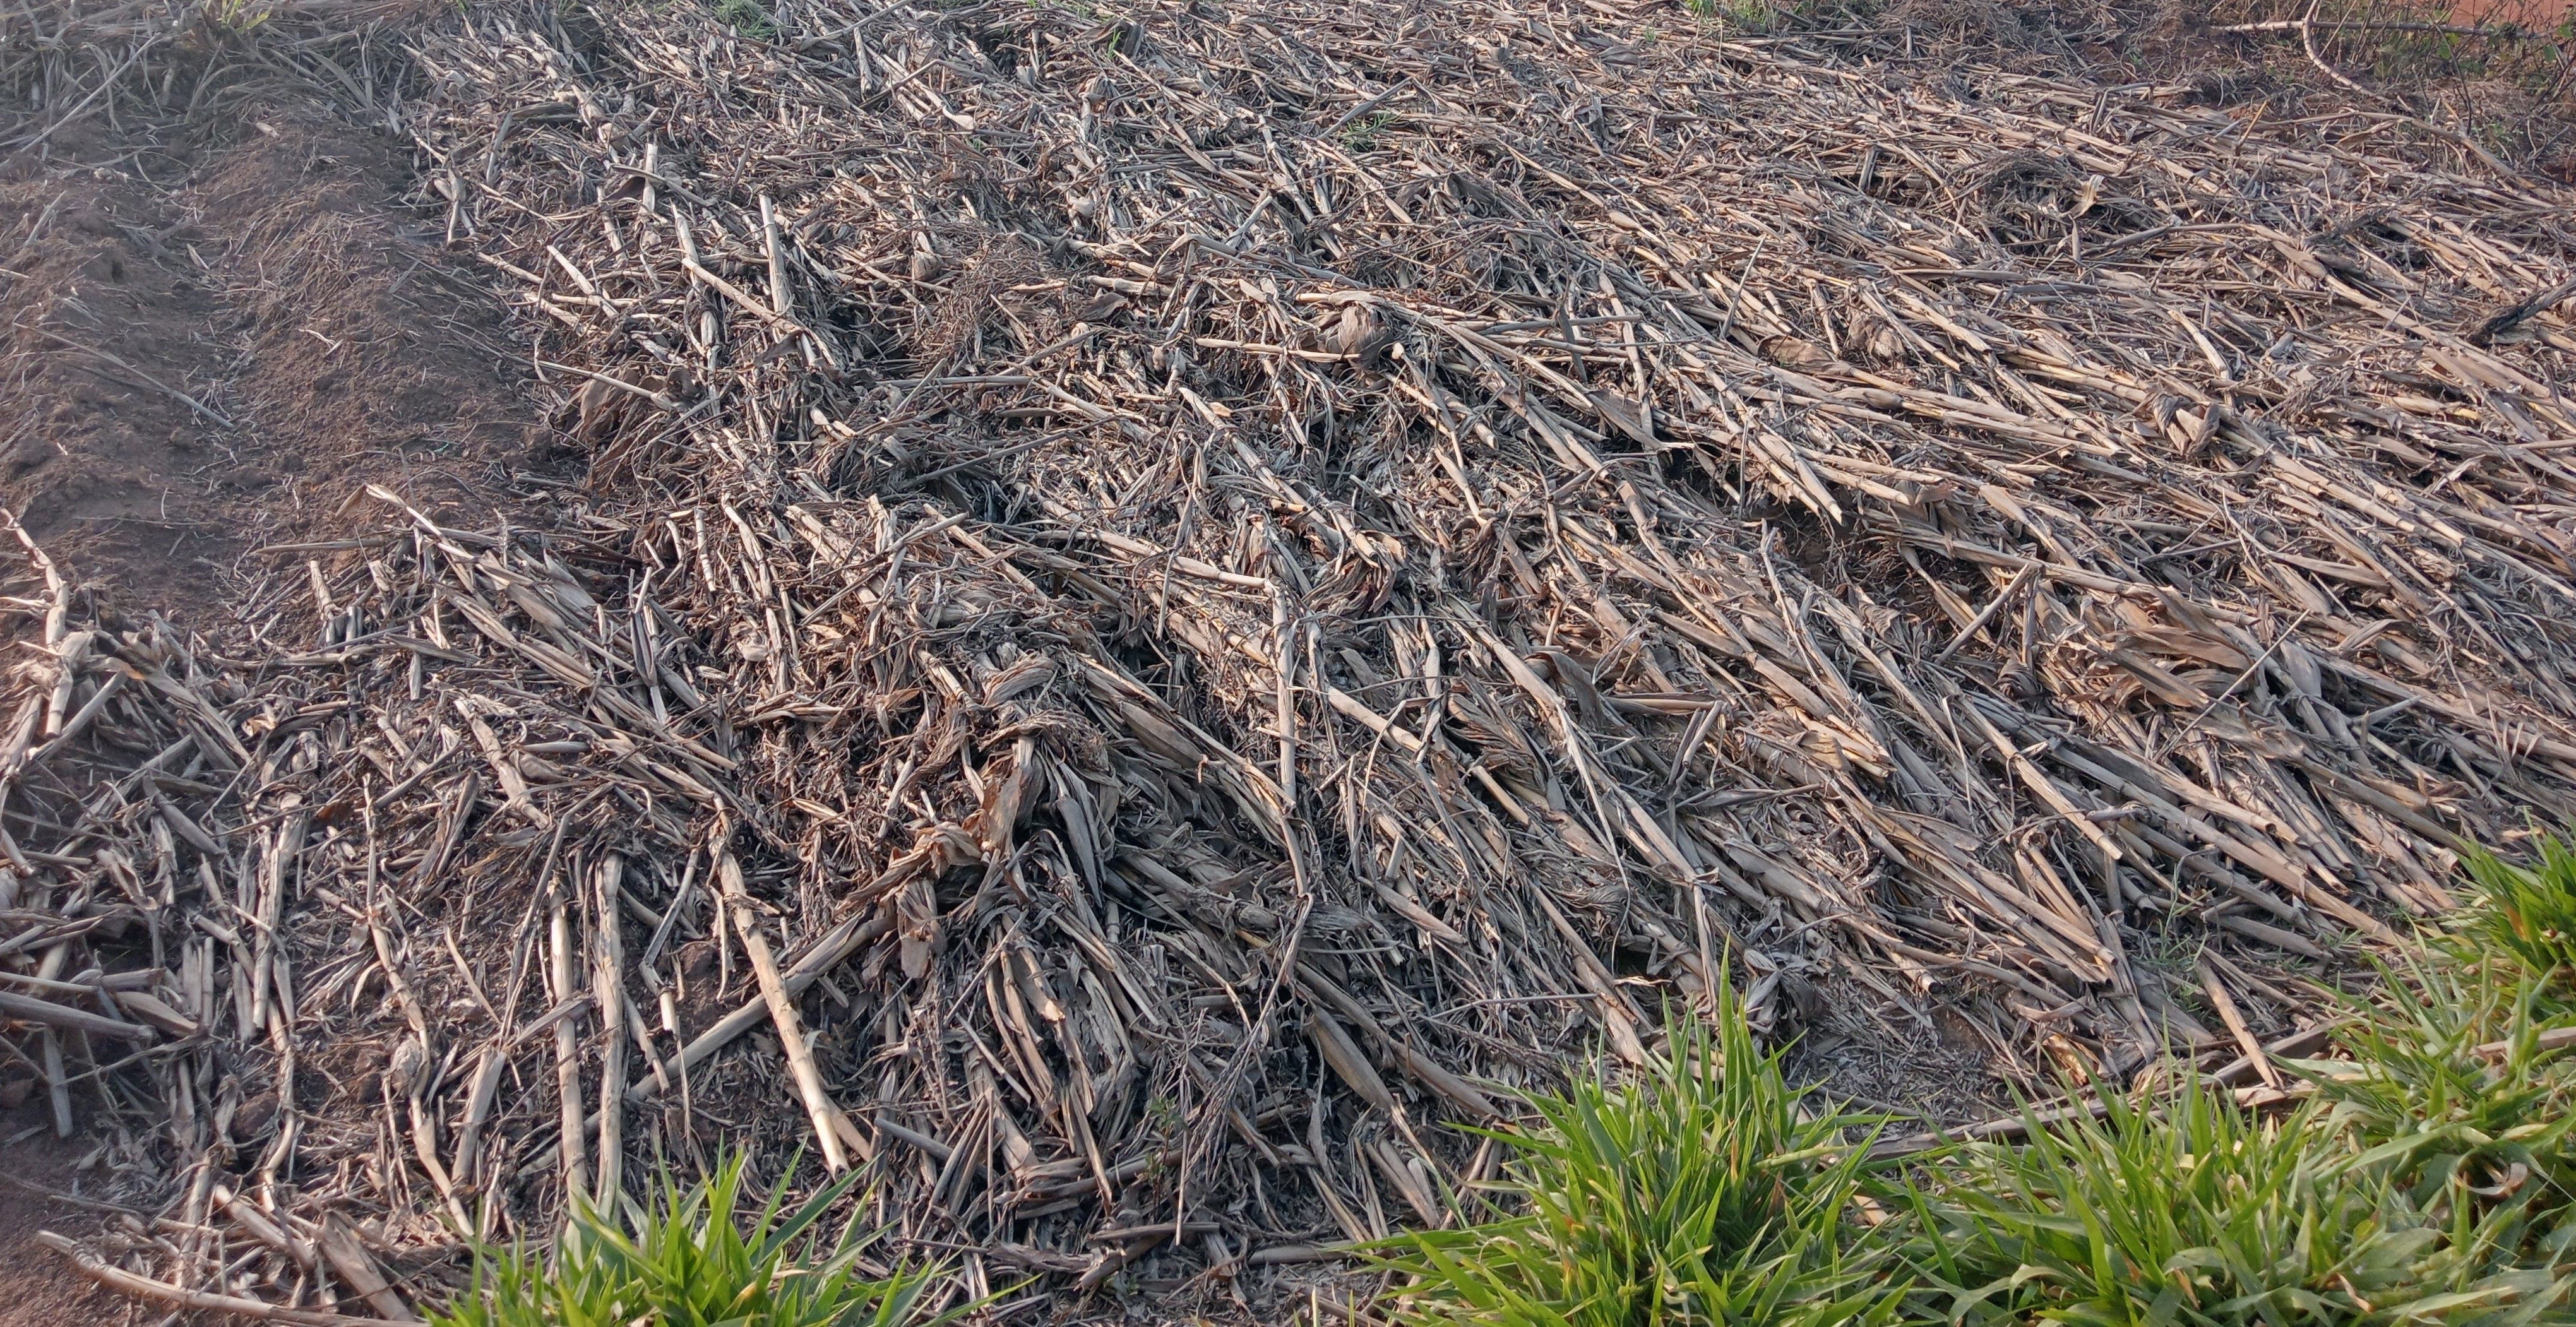
Permanent soil cover is having all-year-round cover on the soil. This can be either in the form of cover crops which are either planted with other crops at the same time, or relay planted later in the season after the main crops have established, or in the form of crop residues (mulch) which is naturally decomposed by microbes. Permanent soil cover provides a shield or umbrella to the soil protecting it from the heat of the sun and the impact of rain. It makes up a fundamental component of conservation agriculture where minimum tillage reduces soil disturbance.
Some of the crops used for permanent soil cover [those promoted by the ProSoil project] include Mucuna pruriens (velvet bean), Canavalia ensiformis, Dolichos lablab, and Desmodium intortum. All of these are legumes, which fix nitrogen from the atmosphere, thus improving soil fertility. In choosing a cover crop, farmers prefer those that fit into their normal cropping systems, and which have multiple purposes, including those that produce edible seeds and vegetables, those that improve soil fertility, those that can be used as animal fodder, and those that can suppress weeds. Some farmers prefer crops that can provide firewood or fencing material and those that can be used for medicinal purposes. Another important factor that farmers consider when choosing a cover crop is the amount and type of work that the cover crop will need, for example for land preparation before planting, weeding, and producing and harvesting the seeds. The crops most preferred are those that cover the soil quickly and completely, and which can also be used for food and fodder, including mucuna. Farmers also like mucuna because of its big pods and grains that are easier to deal with. Farmers can easily multiply mucuna seeds since they do not require complicated treatments; hence, do not need to continue spending money on the seeds.
In establishing a permanent soil cover using cover crops, farmers first intercrop seasonal crops (e.g., maize and beans) and later introduce a green manure cover crop (e.g., mucuna) after about 6 weeks (or at the time when the beans start to produce pods) to ensure that the green manure cover crop does not suppress the main crop(s). The maize is planted at 75 cm row spacing and 25 cm between plants in the same row. However, within each row, the third hole/ space is left for the cover crop (i.e., mucuna). Thus, mucuna is planted after every three maize plants in the same row. The bean intercrop is planted between the maize rows at the spacing of 37.5 cm from the maize row and 20 cm between bean plants in the same row. This spacing requires about 5 kg of cover crop (mucuna) seeds per acre. The crops continue to grow together and upon harvesting the main crops, the cover crop continues to grow on the farm covering the soil until the following cropping season.
Permanent soil cover is beneficial in the farm in various ways including, enhancing soil water infiltration, protecting soil from agents of erosion, increasing soil organic matter, suppressing weeds, aiding in nutrient cycling, and improving the habitat of soil micro- and macro-organisms. Maintaining permanent soil cover through mulching faces some limitations, including competing uses of crop residues e.g., as animal feeds and fuel. Similarly, drought may be a major limitation to maintaining permanent soil cover using cover crops, especially in areas that receive very low rainfall and where the farmer has not invested in irrigation.
2.3 Photos of the Technology
Media Gallery
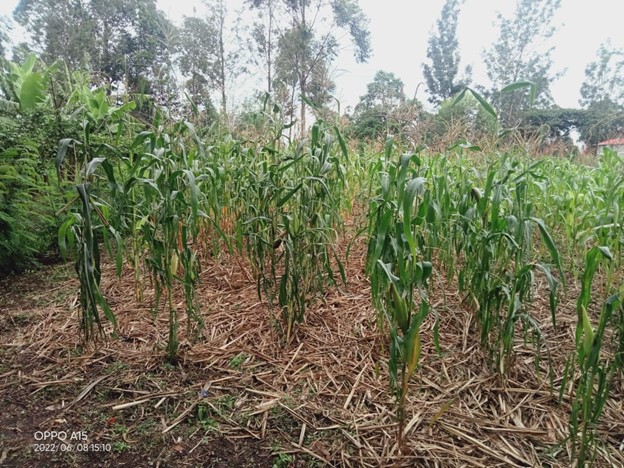
General remarks regarding photos:
Permanent soil cover can be achieved using either green manure cover crops or mulch.
2.5 Country/ region/ locations where the Technology has been applied and which are covered by this assessment
Country:
Kenya
Region/ State/ Province:
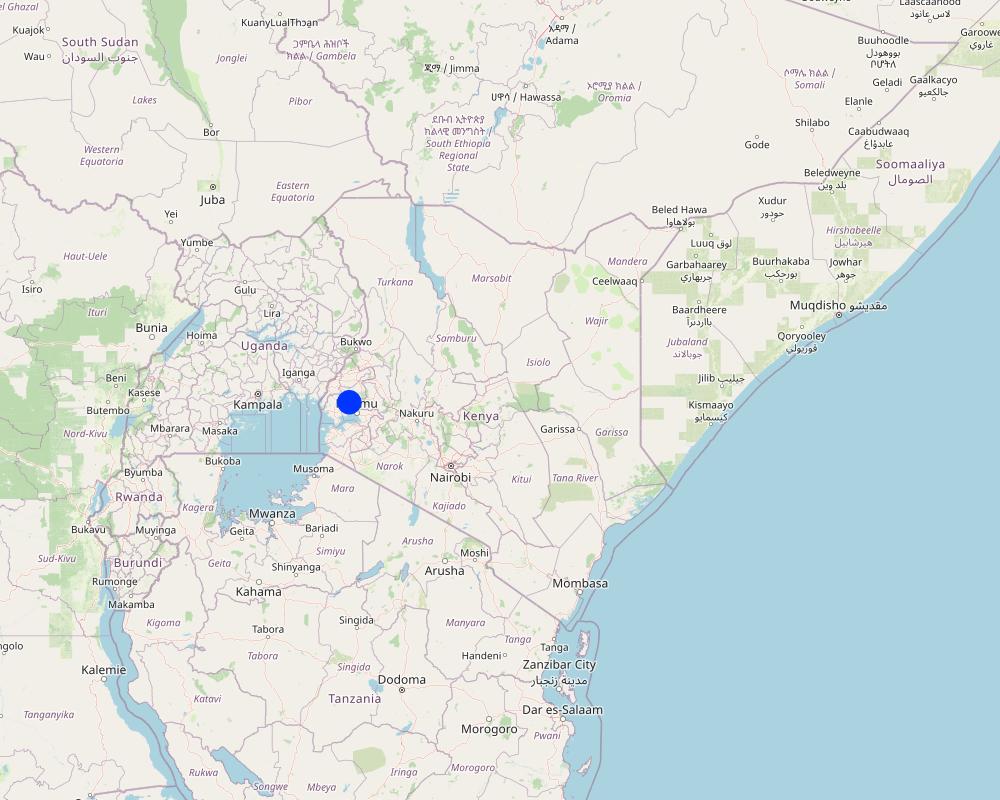
Kakamega County in western Kenya
Further specification of location:
Kisa Central Ward in Khwisero Sub-county; and Koyonzo and Khalaba wards in Matungu Sub-county
Specify the spread of the Technology:
- evenly spread over an area
Is/are the technology site(s) located in a permanently protected area?
No
Comments:
There are no protected areas in the areas covered by this assessment. The indicated area is the total for the three farms which were used in the documentation. Most of the information was collected from the farm in Khwisero Sub-county. Some photos were taken from the two farms in Matungu Sub-county.
Map
×2.6 Date of implementation
Indicate year of implementation:
2021
2.7 Introduction of the Technology
Specify how the Technology was introduced:
- as part of a traditional system (> 50 years)
- through projects/ external interventions
Comments (type of project, etc.):
The farmers were already growing cover crops such as sweet potatoes and pumpkins. The ProSoil project introduced the farmers to other soil cover crops such as mucuna and desmodium.
3. Classification of the SLM Technology
3.1 Main purpose(s) of the Technology
- improve production
- reduce, prevent, restore land degradation
- conserve ecosystem
- preserve/ improve biodiversity
- adapt to climate change/ extremes and its impacts
3.2 Current land use type(s) where the Technology is applied
Land use mixed within the same land unit:
Yes
Specify mixed land use (crops/ grazing/ trees):
- Agro-silvopastoralism

Cropland
- Annual cropping
- Perennial (non-woody) cropping
- Tree and shrub cropping
Annual cropping - Specify crops:
- fodder crops - other
- fodder crops - grasses
- cereals - maize
- vegetables - other
- vegetables - melon, pumpkin, squash or gourd
- legumes and pulses - beans
Annual cropping system:
Maize/sorghum/millet intercropped with legume
Perennial (non-woody) cropping - Specify crops:
- banana/plantain/abaca
- fodder crops - grasses
- fodder crops - legumes, clover
Tree and shrub cropping - Specify crops:
- fodder trees (Calliandra, Leucaena leucocephala, Prosopis, etc.)
- avocado
- fruits, other
- mango, mangosteen, guava
- papaya
Number of growing seasons per year:
- 2
Specify:
Crops are grown during the long and short rain seasons.
Is intercropping practiced?
Yes
If yes, specify which crops are intercropped:
Maize and legumes (beans)
Is crop rotation practiced?
Yes
If yes, specify:
Mucuna is left to continue covering the soil after the main crop(s) has/ have been harvested.

Grazing land
Intensive grazing/ fodder production:
- Cut-and-carry/ zero grazing
- Improved pastures
Animal type:
- cattle - dairy
- cattle - dairy and beef (e.g. zebu)
- poultry
Is integrated crop-livestock management practiced?
Yes
If yes, specify:
Manure from livestock is applied to the crop fields.
Products and services:
- economic security, investment prestige
- milk
- manure as fertilizer/ energy production
- eggs
- meat
Species:
cattle - dairy
Count:
1
Species:
cattle - dairy and beef (e.g. zebu)
Count:
2
Species:
poultry
Count:
20
3.3 Has land use changed due to the implementation of the Technology?
Has land use changed due to the implementation of the Technology?
- No (Continue with question 3.4)
3.4 Water supply
Water supply for the land on which the Technology is applied:
- rainfed
Comments:
Crop establishment is dependent on availability of rainfall.
3.5 SLM group to which the Technology belongs
- improved ground/ vegetation cover
- minimal soil disturbance
- integrated soil fertility management
3.6 SLM measures comprising the Technology

agronomic measures
- A1: Vegetation/ soil cover
- A2: Organic matter/ soil fertility
- A3: Soil surface treatment
- A6: Residue management
A3: Differentiate tillage systems:
A 3.1: No tillage
A6: Specify residue management:
A 6.4: retained
Comments:
Permanent soil cover is normally associated with reduced or zero tillage.
3.7 Main types of land degradation addressed by the Technology

soil erosion by water
- Wt: loss of topsoil/ surface erosion

soil erosion by wind
- Et: loss of topsoil

chemical soil deterioration
- Cn: fertility decline and reduced organic matter content (not caused by erosion)

physical soil deterioration
- Pc: compaction

biological degradation
- Bc: reduction of vegetation cover
- Bs: quality and species composition/ diversity decline

water degradation
- Ha: aridification
3.8 Prevention, reduction, or restoration of land degradation
Specify the goal of the Technology with regard to land degradation:
- prevent land degradation
- adapt to land degradation
4. Technical specifications, implementation activities, inputs, and costs
4.1 Technical drawing of the Technology
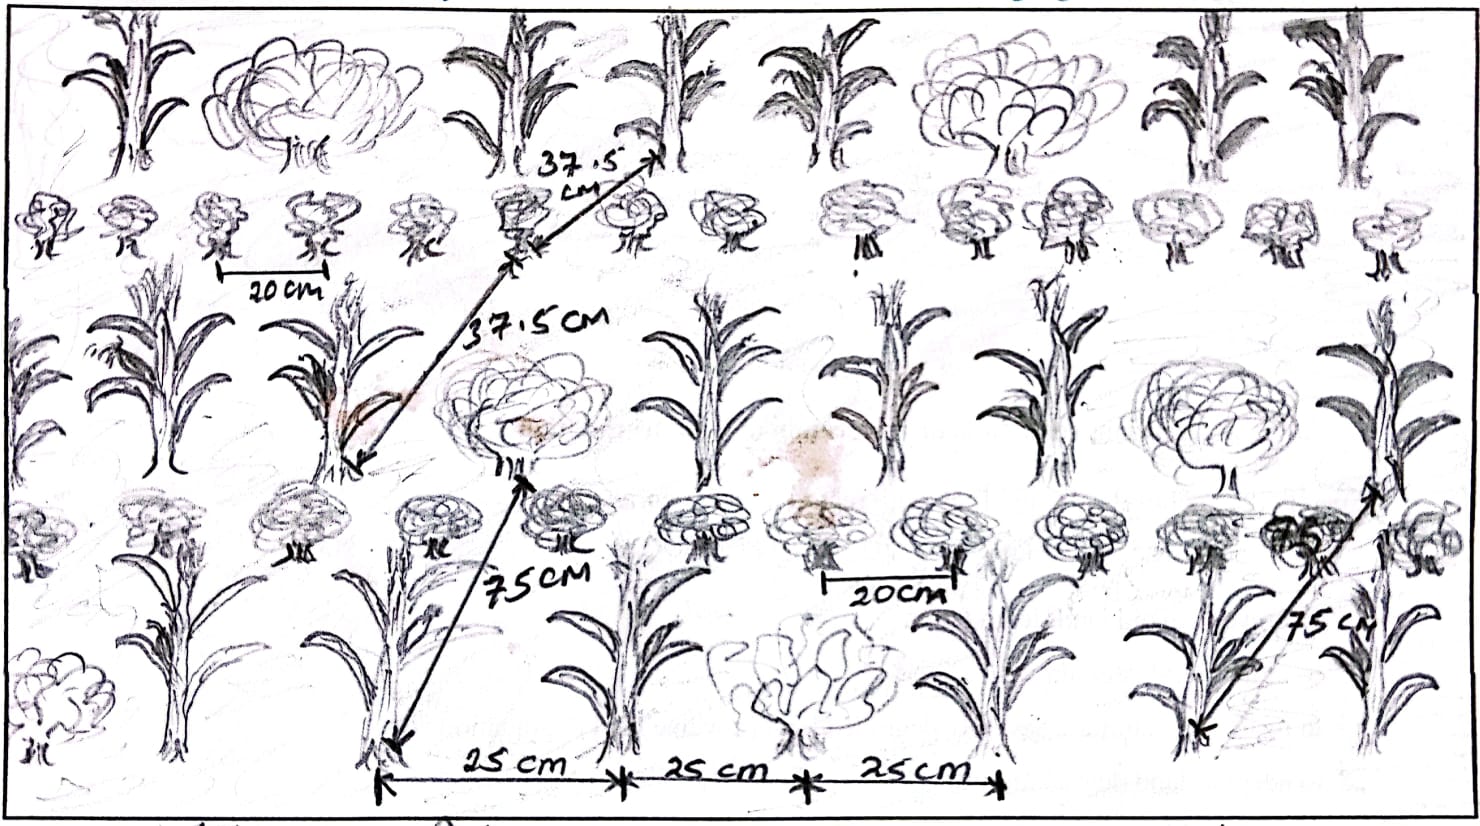
Technical specifications (related to technical drawing):
Maize/ mucuna spacing: row to row = 75 cm, plant to plant in the same row = 25 cm, mucuna planted in every third hole/ space in the same row
Bean spacing: bean rows between the maize/ mucuna rows, bean row to maize/ mucuna row = 37.5 cm, plant to plant in the same row = 20 cm
Author:
William Akwanyi
Date:
04/07/2023
4.2 General information regarding the calculation of inputs and costs
Specify how costs and inputs were calculated:
- per Technology area
Indicate size and area unit:
1 acre
other/ national currency (specify):
KES
If relevant, indicate exchange rate from USD to local currency (e.g. 1 USD = 79.9 Brazilian Real): 1 USD =:
124.21
Indicate average wage cost of hired labour per day:
KES 250.00
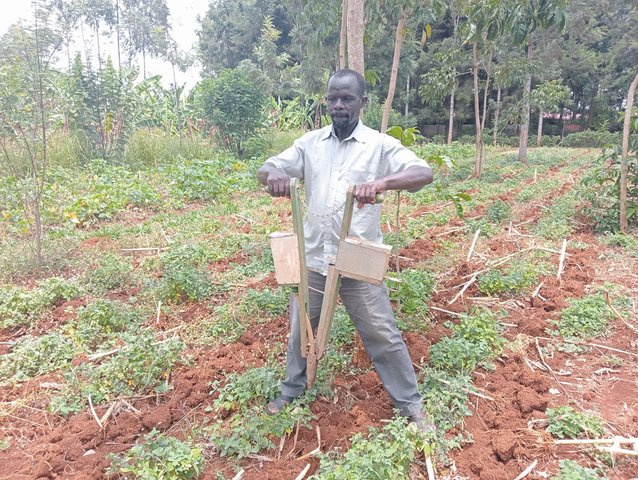
4.3 Establishment activities
Comments:
Land preparation in a conservation agriculture situation will only involve mowing and sub-soiling that are less costly than plouging.
4.5 Maintenance/ recurrent activities
| Activity | Timing/ frequency | |
|---|---|---|
| 1. | Land preparation | Before rains |
| 2. | Planting | After rains |
| 3. | Shallow weeding | During the second weeding of the main crop at 1.5 months |
| 4. | Uncoiling (e.g., mucuna from the main crop) | Bi-weekly |
4.6 Costs and inputs needed for maintenance/ recurrent activities (per year)
| Specify input | Unit | Quantity | Costs per Unit | Total costs per input | % of costs borne by land users | |
|---|---|---|---|---|---|---|
| Labour | Slashing | Man-days | 5.0 | 250.0 | 1250.0 | 100.0 |
| Labour | Sub-soiling | Man-days | 10.0 | 250.0 | 2500.0 | 100.0 |
| Labour | Planting | Man-days | 4.0 | 250.0 | 1000.0 | 100.0 |
| Labour | Shallow weeding and uncoiling (e.g., mucuna from the main crop) | Man-days | 9.0 | 250.0 | 2250.0 | 100.0 |
| Equipment | Slasher | No. | 1.0 | 70.0 | 70.0 | |
| Equipment | Hand-held sub-soiler | No. | 1.0 | 70.0 | 70.0 | |
| Equipment | Jab planter | No. | 1.0 | 1000.0 | 1000.0 | |
| Equipment | Shallow weeder | No. | 1.0 | 80.0 | 80.0 | |
| Plant material | Cover crop seeds | Kgs | 5.0 | 150.0 | 750.0 | |
| Total costs for maintenance of the Technology | 8970.0 | |||||
| Total costs for maintenance of the Technology in USD | 72.22 | |||||
If land user bore less than 100% of costs, indicate who covered the remaining costs:
ProSoil through GFA
Comments:
The farmer does not need fertilizer and manure for planting mucuna. The ProSoil project through Gesellschaft für Agrarprojekte in Übersee (GFA) provided slashers, hand-held sub-soilers, and jab planters to the farmers through their groups. The costs of these implements are KES 350/- for a slasher, KES 350/- for a hand-held sub-soiler, KES 400/- for a shallow weeder, and KES 5,000/- for a jab planter. It is assumed that the farmer will be able to use these implements over a period of 5 years before these implements will have depreciated to a point where they will not be useable. The cost is thus spread over the years when the farmer will be able to use the implement. The total time required for uncoiling is about 5 man-days for the entire duration of the growth of the main crop(s) in a season and the total time required for shallow weeding is about 4 man-days.
4.7 Most important factors affecting the costs
Describe the most determinate factors affecting the costs:
Rate of man-days vary from one place to another, farmer to farmer, and with type of work.
Exchange rate for February 2023, source: European Commission/ InfoEuro online at https://commission.europa.eu/funding-tenders/procedures-guidelines-tenders/information-contractors-and-beneficiaries/exchange-rate-inforeuro_en
5. Natural and human environment
5.1 Climate
Annual rainfall
- < 250 mm
- 251-500 mm
- 501-750 mm
- 751-1,000 mm
- 1,001-1,500 mm
- 1,501-2,000 mm
- 2,001-3,000 mm
- 3,001-4,000 mm
- > 4,000 mm
Specify average annual rainfall (if known), in mm:
1300.00
Specifications/ comments on rainfall:
Monthly rainfall variability is high with some months such as January recording less than 5 mm of total rainfall.
Indicate the name of the reference meteorological station considered:
Kakamega Meteorological Station
Agro-climatic zone
- humid
The climate in the area favours most agricultural activities.
5.2 Topography
Slopes on average:
- flat (0-2%)
- gentle (3-5%)
- moderate (6-10%)
- rolling (11-15%)
- hilly (16-30%)
- steep (31-60%)
- very steep (>60%)
Landforms:
- plateau/plains
- ridges
- mountain slopes
- hill slopes
- footslopes
- valley floors
Altitudinal zone:
- 0-100 m a.s.l.
- 101-500 m a.s.l.
- 501-1,000 m a.s.l.
- 1,001-1,500 m a.s.l.
- 1,501-2,000 m a.s.l.
- 2,001-2,500 m a.s.l.
- 2,501-3,000 m a.s.l.
- 3,001-4,000 m a.s.l.
- > 4,000 m a.s.l.
Indicate if the Technology is specifically applied in:
- not relevant
Comments and further specifications on topography:
The farm is located at an area that is higher in altitude compared to other areas in the larger area. The altitude at the farm is 1,416 m above sea level.
5.3 Soils
Soil depth on average:
- very shallow (0-20 cm)
- shallow (21-50 cm)
- moderately deep (51-80 cm)
- deep (81-120 cm)
- very deep (> 120 cm)
Soil texture (topsoil):
- medium (loamy, silty)
Soil texture (> 20 cm below surface):
- medium (loamy, silty)
Topsoil organic matter:
- medium (1-3%)
If available, attach full soil description or specify the available information, e.g. soil type, soil PH/ acidity, Cation Exchange Capacity, nitrogen, salinity etc.
Soil pH of most farms in the area ranges from moderately acid (5.50) to moderately alkaline (7.80).
5.4 Water availability and quality
Ground water table:
5-50 m
Availability of surface water:
good
Water quality (untreated):
good drinking water
Water quality refers to:
both ground and surface water
Is water salinity a problem?
No
Is flooding of the area occurring?
No
Comments and further specifications on water quality and quantity:
There are several boreholes in the area and according to interviews with some borehole owners, the depts are not more than 50 metres.
5.5 Biodiversity
Species diversity:
- medium
Habitat diversity:
- medium
Comments and further specifications on biodiversity:
The area has high agrobiodiversity since most farms are under crops and trees.
5.6 Characteristics of land users applying the Technology
Sedentary or nomadic:
- Semi-nomadic
Market orientation of production system:
- mixed (subsistence/ commercial)
Off-farm income:
- > 50% of all income
Relative level of wealth:
- average
Individuals or groups:
- individual/ household
Level of mechanization:
- manual work
Gender:
- women
- men
Age of land users:
- middle-aged
5.7 Average area of land used by land users applying the Technology
- < 0.5 ha
- 0.5-1 ha
- 1-2 ha
- 2-5 ha
- 5-15 ha
- 15-50 ha
- 50-100 ha
- 100-500 ha
- 500-1,000 ha
- 1,000-10,000 ha
- > 10,000 ha
Is this considered small-, medium- or large-scale (referring to local context)?
- medium-scale
5.8 Land ownership, land use rights, and water use rights
Land ownership:
- individual, not titled
- individual, titled
Land use rights:
- leased
- individual
Water use rights:
- open access (unorganized)
Are land use rights based on a traditional legal system?
No
Comments:
The farmer has an official title deed for his piece of land. He also leases other people's pieces of land for farming. Water in the streams and springs is freely accessed without restrictions.
5.9 Access to services and infrastructure
health:
- poor
- moderate
- good
education:
- poor
- moderate
- good
technical assistance:
- poor
- moderate
- good
employment (e.g. off-farm):
- poor
- moderate
- good
markets:
- poor
- moderate
- good
energy:
- poor
- moderate
- good
roads and transport:
- poor
- moderate
- good
financial services:
- poor
- moderate
- good
Comments:
The above rating varies from one village to the other.
6. Impacts and concluding statements
6.1 On-site impacts the Technology has shown
Socio-economic impacts
Production
crop production
Quantity before SLM:
Less than 3
Quantity after SLM:
More than 7
Comments/ specify:
Quantity refers to the number of 90 Kg bags of maize produced per acre. Based on the farmer's estimate.
crop quality
Comments/ specify:
Not easy to quantify. The crops do better compared to how they could do in the past, yet he does not use inorganic fertilizers. Based on the farmer's estimate.
fodder production
Quantity before SLM:
2
Quantity after SLM:
5
Comments/ specify:
Quantity refers to harvesting cycles per year for nappier grass from the same farm. Based on the farmer's estimate.
fodder quality
Comments/ specify:
Not easy to quantify. Fodder does better compared to how it was before the technology. Based on the farmer's estimate.
animal production
Quantity before SLM:
2
Quantity after SLM:
5
Comments/ specify:
Quantity refers to the amount of milk in litres from one cow. Based on the farmer's estimate.
risk of production failure
Quantity before SLM:
70
Quantity after SLM:
40
Comments/ specify:
Quantity refers to the percentage probability of the crop failing to do well. Based on the farmer's estimate.
land management
Comments/ specify:
Not easy to quantify but it is easier to prepare land through no tillage than to plough.
Income and costs
expenses on agricultural inputs
Quantity before SLM:
10,000
Quantity after SLM:
0
Comments/ specify:
Quantity refers to the amount of money in Kenya shillings spend on inorganic fertilizers in a season. The farmer no longer buys money inorganic fertilizers. Based on the farmer's experience.
farm income
Quantity before SLM:
500
Quantity after SLM:
10000
Comments/ specify:
Quantity refers to the amount of money in Kenya shillings received from the sale of farm produce in a year.
diversity of income sources
Quantity before SLM:
2
Quantity after SLM:
3
Comments/ specify:
Quantity refers to the number of household income sources.
workload
Comments/ specify:
Not easy to quantify but it is easier to prepare land through no tillage than to plough.
Socio-cultural impacts
food security/ self-sufficiency
Quantity before SLM:
3
Quantity after SLM:
1
Comments/ specify:
Quantity refers to the number of months in a year when there is total lack of food in the house, and the farmer has to buy all the food required in the house. Based on the farmer's estimate.
SLM/ land degradation knowledge
Comments/ specify:
Refers to the estimated percentage of knowledge in SLM/ land management. Based on the farmer's estimate. His knowledge in SLM has greatly increased.
Ecological impacts
Soil
soil moisture
Comments/ specify:
Refers to the farmer's estimated soil moisture content during the dry season when soil moisture challenges are expected to be high.
soil cover
Quantity before SLM:
40
Quantity after SLM:
60
Comments/ specify:
Quantity refers to the farmer's estimated percentage soil cover at the farm.
soil loss
Comments/ specify:
Not easy for the farmer to quantify. According to him, soil erosion has reduced.
soil accumulation
Comments/ specify:
Not easy for the farmer to quantify. Based on the farmer's estimate.
nutrient cycling/ recharge
Comments/ specify:
Not easy for the farmer to quantify. Based on the farmer's estimate.
soil organic matter/ below ground C
Comments/ specify:
Not easy to quantify as there is no data. Based on the farmer's estimate.
Biodiversity: vegetation, animals
Vegetation cover
Quantity before SLM:
30
Quantity after SLM:
60
Comments/ specify:
Quantity refers to the farmer's estimated percentage vegetation cover at the farm.
biomass/ above ground C
Comments/ specify:
Not easy for the farmer to quantify. Based on the farmer's estimate.
plant diversity
Quantity before SLM:
4
Quantity after SLM:
11
Comments/ specify:
Quantity refers to the number of plants (crops) that the farmer establishes at the farm. Based on the farmer's estimate.
invasive alien species
Quantity before SLM:
6
Quantity after SLM:
4
Comments/ specify:
Quality refers to the number of species of weeds and invasive plants at the farm. Based on the farmer's estimate.
habitat diversity
Comments/ specify:
Not easy for the farmer to quantify. Based on the farmer's estimate.
Specify assessment of on-site impacts (measurements):
No recorded data is available for reference. All are estimates based on the farmer's explanation or as given by him.
6.2 Off-site impacts the Technology has shown
buffering/ filtering capacity
Comments/ specify:
No recorded data is available for reference. All are estimates based on the farmer's explanation or as given by him.
6.3 Exposure and sensitivity of the Technology to gradual climate change and climate-related extremes/ disasters (as perceived by land users)
Gradual climate change
Gradual climate change
| Season | increase or decrease | How does the Technology cope with it? | |
|---|---|---|---|
| annual temperature | increase | well | |
| seasonal temperature | dry season | increase | well |
6.4 Cost-benefit analysis
How do the benefits compare with the establishment costs (from land users’ perspective)?
Short-term returns:
very positive
Long-term returns:
very positive
How do the benefits compare with the maintenance/ recurrent costs (from land users' perspective)?
Short-term returns:
very positive
Long-term returns:
very positive
6.5 Adoption of the Technology
- > 50%
Of all those who have adopted the Technology, how many did so spontaneously, i.e. without receiving any material incentives/ payments?
- 91-100%
Comments:
Most farmers are adopting cover crops, especially mucuna because of the increasing knowledge about its benefits and demand for its value-added products. These cover crops are becoming popular among farmers.
6.6 Adaptation
Has the Technology been modified recently to adapt to changing conditions?
No
6.7 Strengths/ advantages/ opportunities of the Technology
| Strengths/ advantages/ opportunities in the land user’s view |
|---|
| Improves fertility at the farm, especially when nitrogen-fixing cover crops are used. |
| Reduces cost of labour i.e., no need to plough under conservation agriculture. |
| Strengths/ advantages/ opportunities in the compiler’s or other key resource person’s view |
|---|
| Plant cover contributes to carbon sequestration. |
| Conserves soil moisture and protects soil resulting in increased yields. |
6.8 Weaknesses/ disadvantages/ risks of the Technology and ways of overcoming them
| Weaknesses/ disadvantages/ risks in the land user’s view | How can they be overcome? |
|---|---|
| Some cover crops such as mucuna suppress other crops. | Regular checking to remove mucuna that attempts to coil on other crops. |
7. References and links
7.1 Methods/ sources of information
- field visits, field surveys
Visit to three farms, only one farmer provided farm-based information used for this documentation.
- interviews with land users
One farmer interviewed at his farm. Follow-up questions on phone.
- interviews with SLM specialists/ experts
ProSoil team and project implementers from GFA consulted.
When were the data compiled (in the field)?
10/02/2023
7.4 General comments
1. Provide a function to be able to link the documented SLM to similar work that has been documented in other databases e.g., LandPortal, UNCCD, etc.
2. Some of the impacts (section 6) cannot be quantified.
Links and modules
Expand all Collapse allLinks
Mucuna value-addition for female farmers [Kenya]
Promoting mucuna seed processing for food and nutrition security and income generation encourages women farmers to plant mucuna as a cover crop that improves soil productivity.
- Compiler: William Akwanyi
Improving farmers' access to tools for conservation agriculture [Kenya]
Improving farmers' access to minimum tillage tools is an approach to increasing the adoption of conservation agriculture (CA) through linking them to institutions that fabricate the tools.
- Compiler: William Akwanyi
Modules
No modules