Communal grazing management [South Africa]
- Creation:
- Update:
- Compiler: Anja Jansen van Vuuren
- Editor: –
- Reviewers: David Streiff, Alexandra Gavilano
Using benchmarks as demonstration of NRM strategies. Camp system vs. Open system.
technologies_1382 - South Africa
View sections
Expand all Collapse all1. General information
1.2 Contact details of resource persons and institutions involved in the assessment and documentation of the Technology
SLM specialist:
SLM specialist:
Name of the institution(s) which facilitated the documentation/ evaluation of the Technology (if relevant)
Potchefstroom Universiteit vir CHO (Potchefstroom Universiteit vir CHO) - South AfricaName of the institution(s) which facilitated the documentation/ evaluation of the Technology (if relevant)
Department of Agriculture (Department of Agriculture) - Zambia1.3 Conditions regarding the use of data documented through WOCAT
The compiler and key resource person(s) accept the conditions regarding the use of data documented through WOCAT:
Yes
1.5 Reference to Questionnaire(s) on SLM Approaches (documented using WOCAT)
Communal stakeholders [South Africa]
Government funded project aimed at rangeland management to enhance natural recourse management. The community being the key stake holders.
- Compiler: Anja Jansen van Vuuren
2. Description of the SLM Technology
2.1 Short description of the Technology
Definition of the Technology:
Rangeland management of communal grazing land, to improve grazing capacity by applying rotation.
2.2 Detailed description of the Technology
Description:
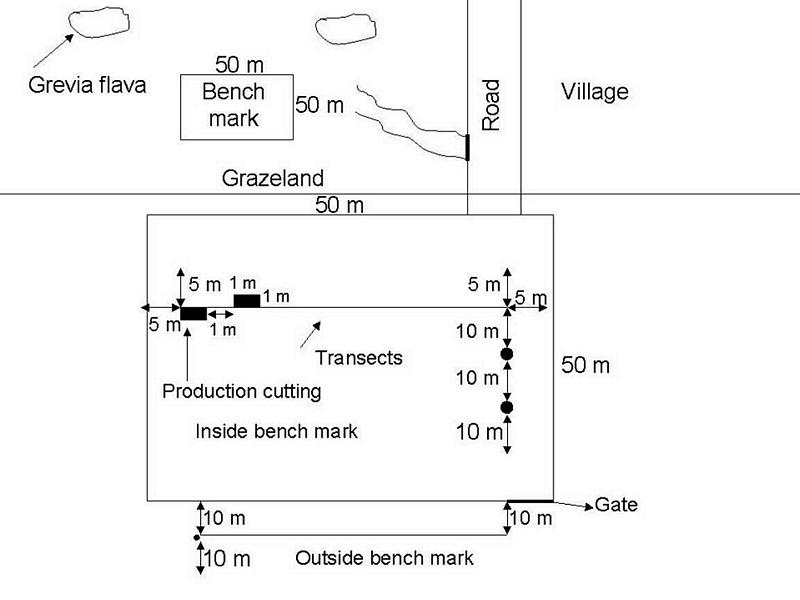
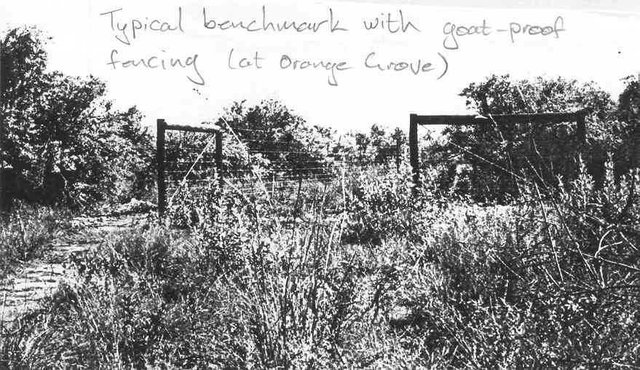
Benchmarks were identified and monitored to see how the production and vegetation would change if proper management was applied to a specific area. The benchmarks will only be grazed in the winter and rested in summer. The benchmarks were constructed with goat-proof fencing. Benchmarks will illustrate how grazing land can improve with the right management system.
Monitoring of vegetation is done twice a year.
2.3 Photos of the Technology
Media Gallery
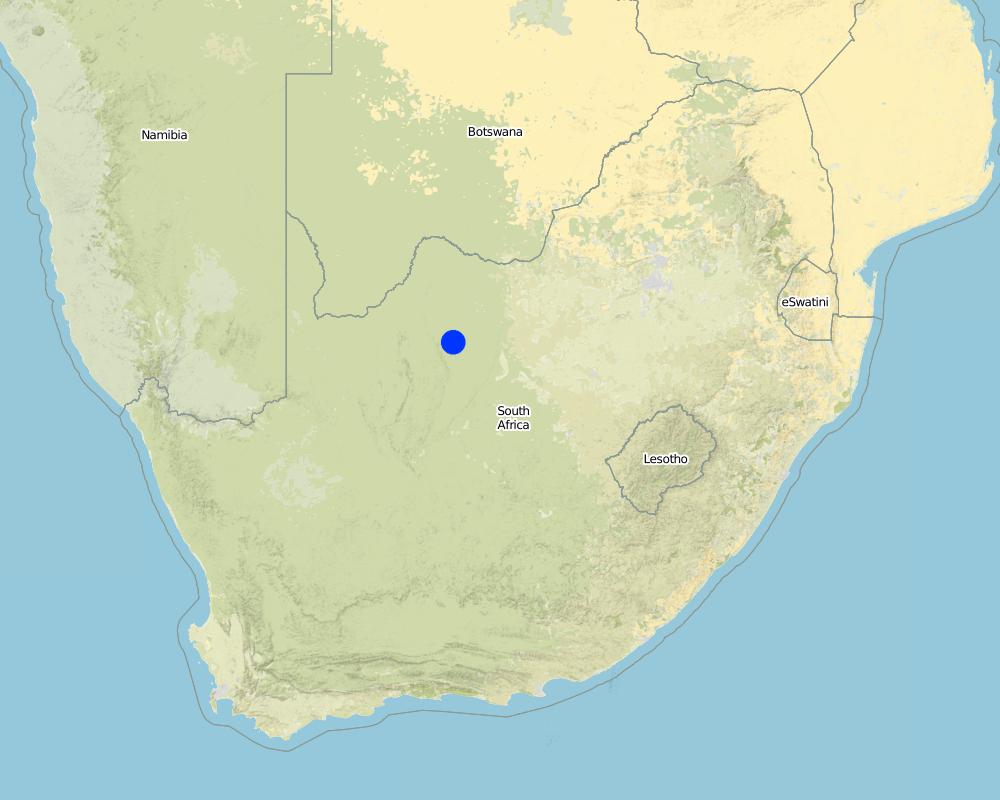
2.5 Country/ region/ locations where the Technology has been applied and which are covered by this assessment
Country:
South Africa
Region/ State/ Province:
North West Province
Further specification of location:
Kudumane
Specify the spread of the Technology:
- evenly spread over an area
If the Technology is evenly spread over an area, specify area covered (in km2):
1.0
If precise area is not known, indicate approximate area covered:
- 1-10 km2
Comments:
Total area covered by the SLM Technology is 1 km2.
Settlement situated 30 km from Kuruman. Lots of sheep and goats. Also cattle, donkeys and horses. Communal grazing.
Map
×2.6 Date of implementation
If precise year is not known, indicate approximate date:
- less than 10 years ago (recently)
2.7 Introduction of the Technology
Specify how the Technology was introduced:
- through projects/ external interventions
Comments (type of project, etc.):
The need to improve grazing lands.
3. Classification of the SLM Technology
3.1 Main purpose(s) of the Technology
- improve production
- Monitoring SLM Technology
3.2 Current land use type(s) where the Technology is applied

Grazing land
Extensive grazing:
- Semi-nomadic pastoralism
Animal type:
- goats
- cattle
Comments:
Main animal species and products: Communal grazing (free roaming goats)
Major land use problems (compiler’s opinion): Over grazing, loss of palatable species and thus nutrients for cattle.
Major land use problems (land users’ perception): Reduced animal performance.
Semi-nomadism / pastoralism: Communal grazing (free roaming goats)
Grazingland comments: Large community owned livestock herds.
Type of grazing system comments: Large community owned livestock herds.
Number of growing seasons per year: 1
Longest growing period in days: 210; Longest growing period from month to month: Oct - Apr
3.4 Water supply
Water supply for the land on which the Technology is applied:
- rainfed
3.5 SLM group to which the Technology belongs
- area closure (stop use, support restoration)
3.6 SLM measures comprising the Technology

management measures
Comments:
Main measures: management measures
3.7 Main types of land degradation addressed by the Technology

soil erosion by water
- Wt: loss of topsoil/ surface erosion
- Wg: gully erosion/ gullying

chemical soil deterioration
- Cn: fertility decline and reduced organic matter content (not caused by erosion)

physical soil deterioration
- Pc: compaction

water degradation
- Ha: aridification
Comments:
Secondary types of degradation addressed: Wt: loss of topsoil / surface erosion, Wg: gully erosion / gullying
Main causes of degradation: over-exploitation of vegetation for domestic use, overgrazing, droughts, inputs and infrastructure: (roads, markets, distribution of water points, other, …) (Lack of knowledge)
3.8 Prevention, reduction, or restoration of land degradation
Specify the goal of the Technology with regard to land degradation:
- prevent land degradation
- reduce land degradation
Comments:
Secondary goals: prevention of land degradation
4. Technical specifications, implementation activities, inputs, and costs
4.1 Technical drawing of the Technology
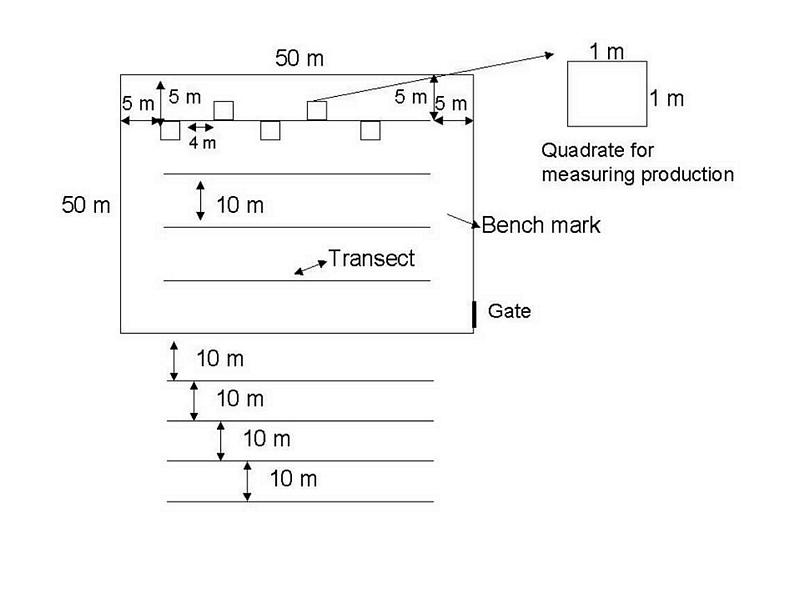
Technical specifications (related to technical drawing):
Technology
Location: Maketlele. North West Province
Technical knowledge required for field staff / advisors: moderate
Technical knowledge required for land users: moderate
Main technical functions: control of raindrop splash, control of dispersed runoff: retain / trap, control of dispersed runoff: impede / retard, control of concentrated runoff: retain / trap, control of concentrated runoff: impede / retard, improvement of ground cover, increase of surface roughness, improvement of topsoil structure (compaction), increase in organic matter, increase of infiltration, increase of groundwater level / recharge of groundwater, reduction in wind speed, increase in soil fertility, improvement of soil structure
Secondary technical functions: control of concentrated runoff: drain / divert, water spreading, sediment retention / trapping, sediment harvesting
Change of land use type: Area divided into camps.
Layout change according to natural and human environment: Camps, benchmarks, fences constructed.
Other type of management: Rotational grazing.
Author:
Anja Jansen van Vuuren
4.2 General information regarding the calculation of inputs and costs
Specify currency used for cost calculations:
- USD
If relevant, indicate exchange rate from USD to local currency (e.g. 1 USD = 79.9 Brazilian Real): 1 USD =:
-0.8
Indicate average wage cost of hired labour per day:
3.60
4.3 Establishment activities
| Activity | Timing (season) | |
|---|---|---|
| 1. | Area divided into camps. | 6 months |
| 2. | Identification and construction of benchmarks. | 1 month |
| 3. | Initial survey. | 1 week |
4.4 Costs and inputs needed for establishment
| Specify input | Unit | Quantity | Costs per Unit | Total costs per input | % of costs borne by land users | |
|---|---|---|---|---|---|---|
| Labour | Constructing benchmarks | persons/day/ha | 133.0 | 3.2 | 425.6 | |
| Construction material | Fencing material | ha | 1.0 | 914.64 | 914.64 | |
| Other | Transport (10-7km/l) | ha | 1.0 | 67.07 | 67.07 | |
| Total costs for establishment of the Technology | 1407.31 | |||||
| Total costs for establishment of the Technology in USD | -1759.14 | |||||
Comments:
Duration of establishment phase: 12 month(s)
4.5 Maintenance/ recurrent activities
| Activity | Timing/ frequency | |
|---|---|---|
| 1. | Further surveys. | 2 weeks / twice a year |
| 2. | Data analysis. | 3 months / after each survey |
| 3. | Establishing a gradient. | 2 weeks / once |
| 4. | Maintenance of fencing. | continued / when necessary |
4.6 Costs and inputs needed for maintenance/ recurrent activities (per year)
| Specify input | Unit | Quantity | Costs per Unit | Total costs per input | % of costs borne by land users | |
|---|---|---|---|---|---|---|
| Labour | Maintenance and monitoring | persons/day/ha | 10.0 | 3.2 | 32.0 | |
| Other | Paper bags | ha | 1.0 | 8.05 | 8.05 | |
| Other | Data sheet | ha | 1.0 | 1.0 | 1.0 | |
| Other | Transport (10-7km/l) | ha | 1.0 | 129.27 | 129.27 | |
| Total costs for maintenance of the Technology | 170.32 | |||||
| Total costs for maintenance of the Technology in USD | -212.9 | |||||
Comments:
Fencing of benchmark, conducting surveys and soil analysis.
4.7 Most important factors affecting the costs
Describe the most determinate factors affecting the costs:
Cost of transport depends on the fuel price. The sites are situated far from accommodation. Maintenance of fences and soil analysis.
5. Natural and human environment
5.1 Climate
Annual rainfall
- < 250 mm
- 251-500 mm
- 501-750 mm
- 751-1,000 mm
- 1,001-1,500 mm
- 1,501-2,000 mm
- 2,001-3,000 mm
- 3,001-4,000 mm
- > 4,000 mm
Agro-climatic zone
- semi-arid
5.2 Topography
Slopes on average:
- flat (0-2%)
- gentle (3-5%)
- moderate (6-10%)
- rolling (11-15%)
- hilly (16-30%)
- steep (31-60%)
- very steep (>60%)
Landforms:
- plateau/plains
- ridges
- mountain slopes
- hill slopes
- footslopes
- valley floors
Altitudinal zone:
- 0-100 m a.s.l.
- 101-500 m a.s.l.
- 501-1,000 m a.s.l.
- 1,001-1,500 m a.s.l.
- 1,501-2,000 m a.s.l.
- 2,001-2,500 m a.s.l.
- 2,501-3,000 m a.s.l.
- 3,001-4,000 m a.s.l.
- > 4,000 m a.s.l.
Comments and further specifications on topography:
Altitudinal zone: 1337 m a.s.l.
5.3 Soils
Soil depth on average:
- very shallow (0-20 cm)
- shallow (21-50 cm)
- moderately deep (51-80 cm)
- deep (81-120 cm)
- very deep (> 120 cm)
Soil texture (topsoil):
- coarse/ light (sandy)
Topsoil organic matter:
- low (<1%)
If available, attach full soil description or specify the available information, e.g. soil type, soil PH/ acidity, Cation Exchange Capacity, nitrogen, salinity etc.
Soil depth on average: Sandy
Soil fertility is medium
Soil drainage / infiltration is good
Soil water storage capacity is low
5.6 Characteristics of land users applying the Technology
Market orientation of production system:
- subsistence (self-supply)
Off-farm income:
- > 50% of all income
Relative level of wealth:
- average
Indicate other relevant characteristics of the land users:
Population density: 10-50 persons/km2
Annual population growth: 2% - 3%
20% of the land users are rich.
55% of the land users are average wealthy.
25% of the land users are poor.
Off-farm income specification: State pension, mine workers, family working in the city.
5.7 Average area of land used by land users applying the Technology
- < 0.5 ha
- 0.5-1 ha
- 1-2 ha
- 2-5 ha
- 5-15 ha
- 15-50 ha
- 50-100 ha
- 100-500 ha
- 500-1,000 ha
- 1,000-10,000 ha
- > 10,000 ha
5.8 Land ownership, land use rights, and water use rights
Land ownership:
- communal/ village
Land use rights:
- communal (organized)
6. Impacts and concluding statements
6.1 On-site impacts the Technology has shown
Socio-economic impacts
Production
fodder production
Comments/ specify:
Inside benchmark
fodder quality
Comments/ specify:
Inside benchmark
Income and costs
workload
Comments/ specify:
Nobody wanted to help with surveys
Socio-cultural impacts
SLM/ land degradation knowledge
Ecological impacts
Soil
soil moisture
soil cover
soil loss
Other ecological impacts
soil fertility
biodiversity
6.4 Cost-benefit analysis
How do the benefits compare with the establishment costs (from land users’ perspective)?
Short-term returns:
slightly negative
Long-term returns:
positive
How do the benefits compare with the maintenance/ recurrent costs (from land users' perspective)?
Short-term returns:
slightly positive
Long-term returns:
positive
6.5 Adoption of the Technology
- > 50%
Of all those who have adopted the Technology, how many did so spontaneously, i.e. without receiving any material incentives/ payments?
- 0-10%
Comments:
100% of land user families have adopted the Technology with external material support
100 land user families have adopted the Technology with external material support
Comments on spontaneous adoption: estimates
There is a little trend towards spontaneous adoption of the Technology
Comments on adoption trend: Will increase with awareness adoption of technology.
6.7 Strengths/ advantages/ opportunities of the Technology
| Strengths/ advantages/ opportunities in the land user’s view |
|---|
|
Improved rangelands. How can they be sustained / enhanced? Better cattle. |
| Strengths/ advantages/ opportunities in the compiler’s or other key resource person’s view |
|---|
|
The committed ADC-manager How can they be sustained / enhanced? Meetings |
| The maintenance of benchmarks as examples. |
6.8 Weaknesses/ disadvantages/ risks of the Technology and ways of overcoming them
| Weaknesses/ disadvantages/ risks in the land user’s view | How can they be overcome? |
|---|---|
| Cattle must be reduced | Improve rangeland - larger carrying capacity |
| Weaknesses/ disadvantages/ risks in the compiler’s or other key resource person’s view | How can they be overcome? |
|---|---|
| Community participation | Give more information |
7. References and links
7.1 Methods/ sources of information
Links and modules
Expand all Collapse allLinks
Communal stakeholders [South Africa]
Government funded project aimed at rangeland management to enhance natural recourse management. The community being the key stake holders.
- Compiler: Anja Jansen van Vuuren
Modules
No modules