Reduced tillage [Estonia]
- Creation:
- Update:
- Compiler: Endla Reintam
- Editor: –
- Reviewers: Ursula Gaemperli, Gudrun Schwilch, Alexandra Gavilano
minimeeritud harimine
technologies_3120 - Estonia
View sections
Expand all Collapse all1. General information
1.2 Contact details of resource persons and institutions involved in the assessment and documentation of the Technology
Key resource person(s)
land user:
Aruksaar Ahti
Viljameister OÜ
Estonia
researcher:
researcher:
Lauringson Enn
Estonian University of Life Sciences
Estonia
Name of project which facilitated the documentation/ evaluation of the Technology (if relevant)
Interactive Soil Quality assessment in Europe and China for Agricultural productivity and Environmental Resilience (EU-iSQAPER)1.3 Conditions regarding the use of data documented through WOCAT
The compiler and key resource person(s) accept the conditions regarding the use of data documented through WOCAT:
Yes
1.4 Declaration on sustainability of the described Technology
Is the Technology described here problematic with regard to land degradation, so that it cannot be declared a sustainable land management technology?
No
2. Description of the SLM Technology
2.1 Short description of the Technology
Definition of the Technology:
Reduced (minimum) tillage is a tillage method that does not turn the soil over. Usually only the upper 10-18 cm of the soil surface is tilled.
2.2 Detailed description of the Technology
Description:
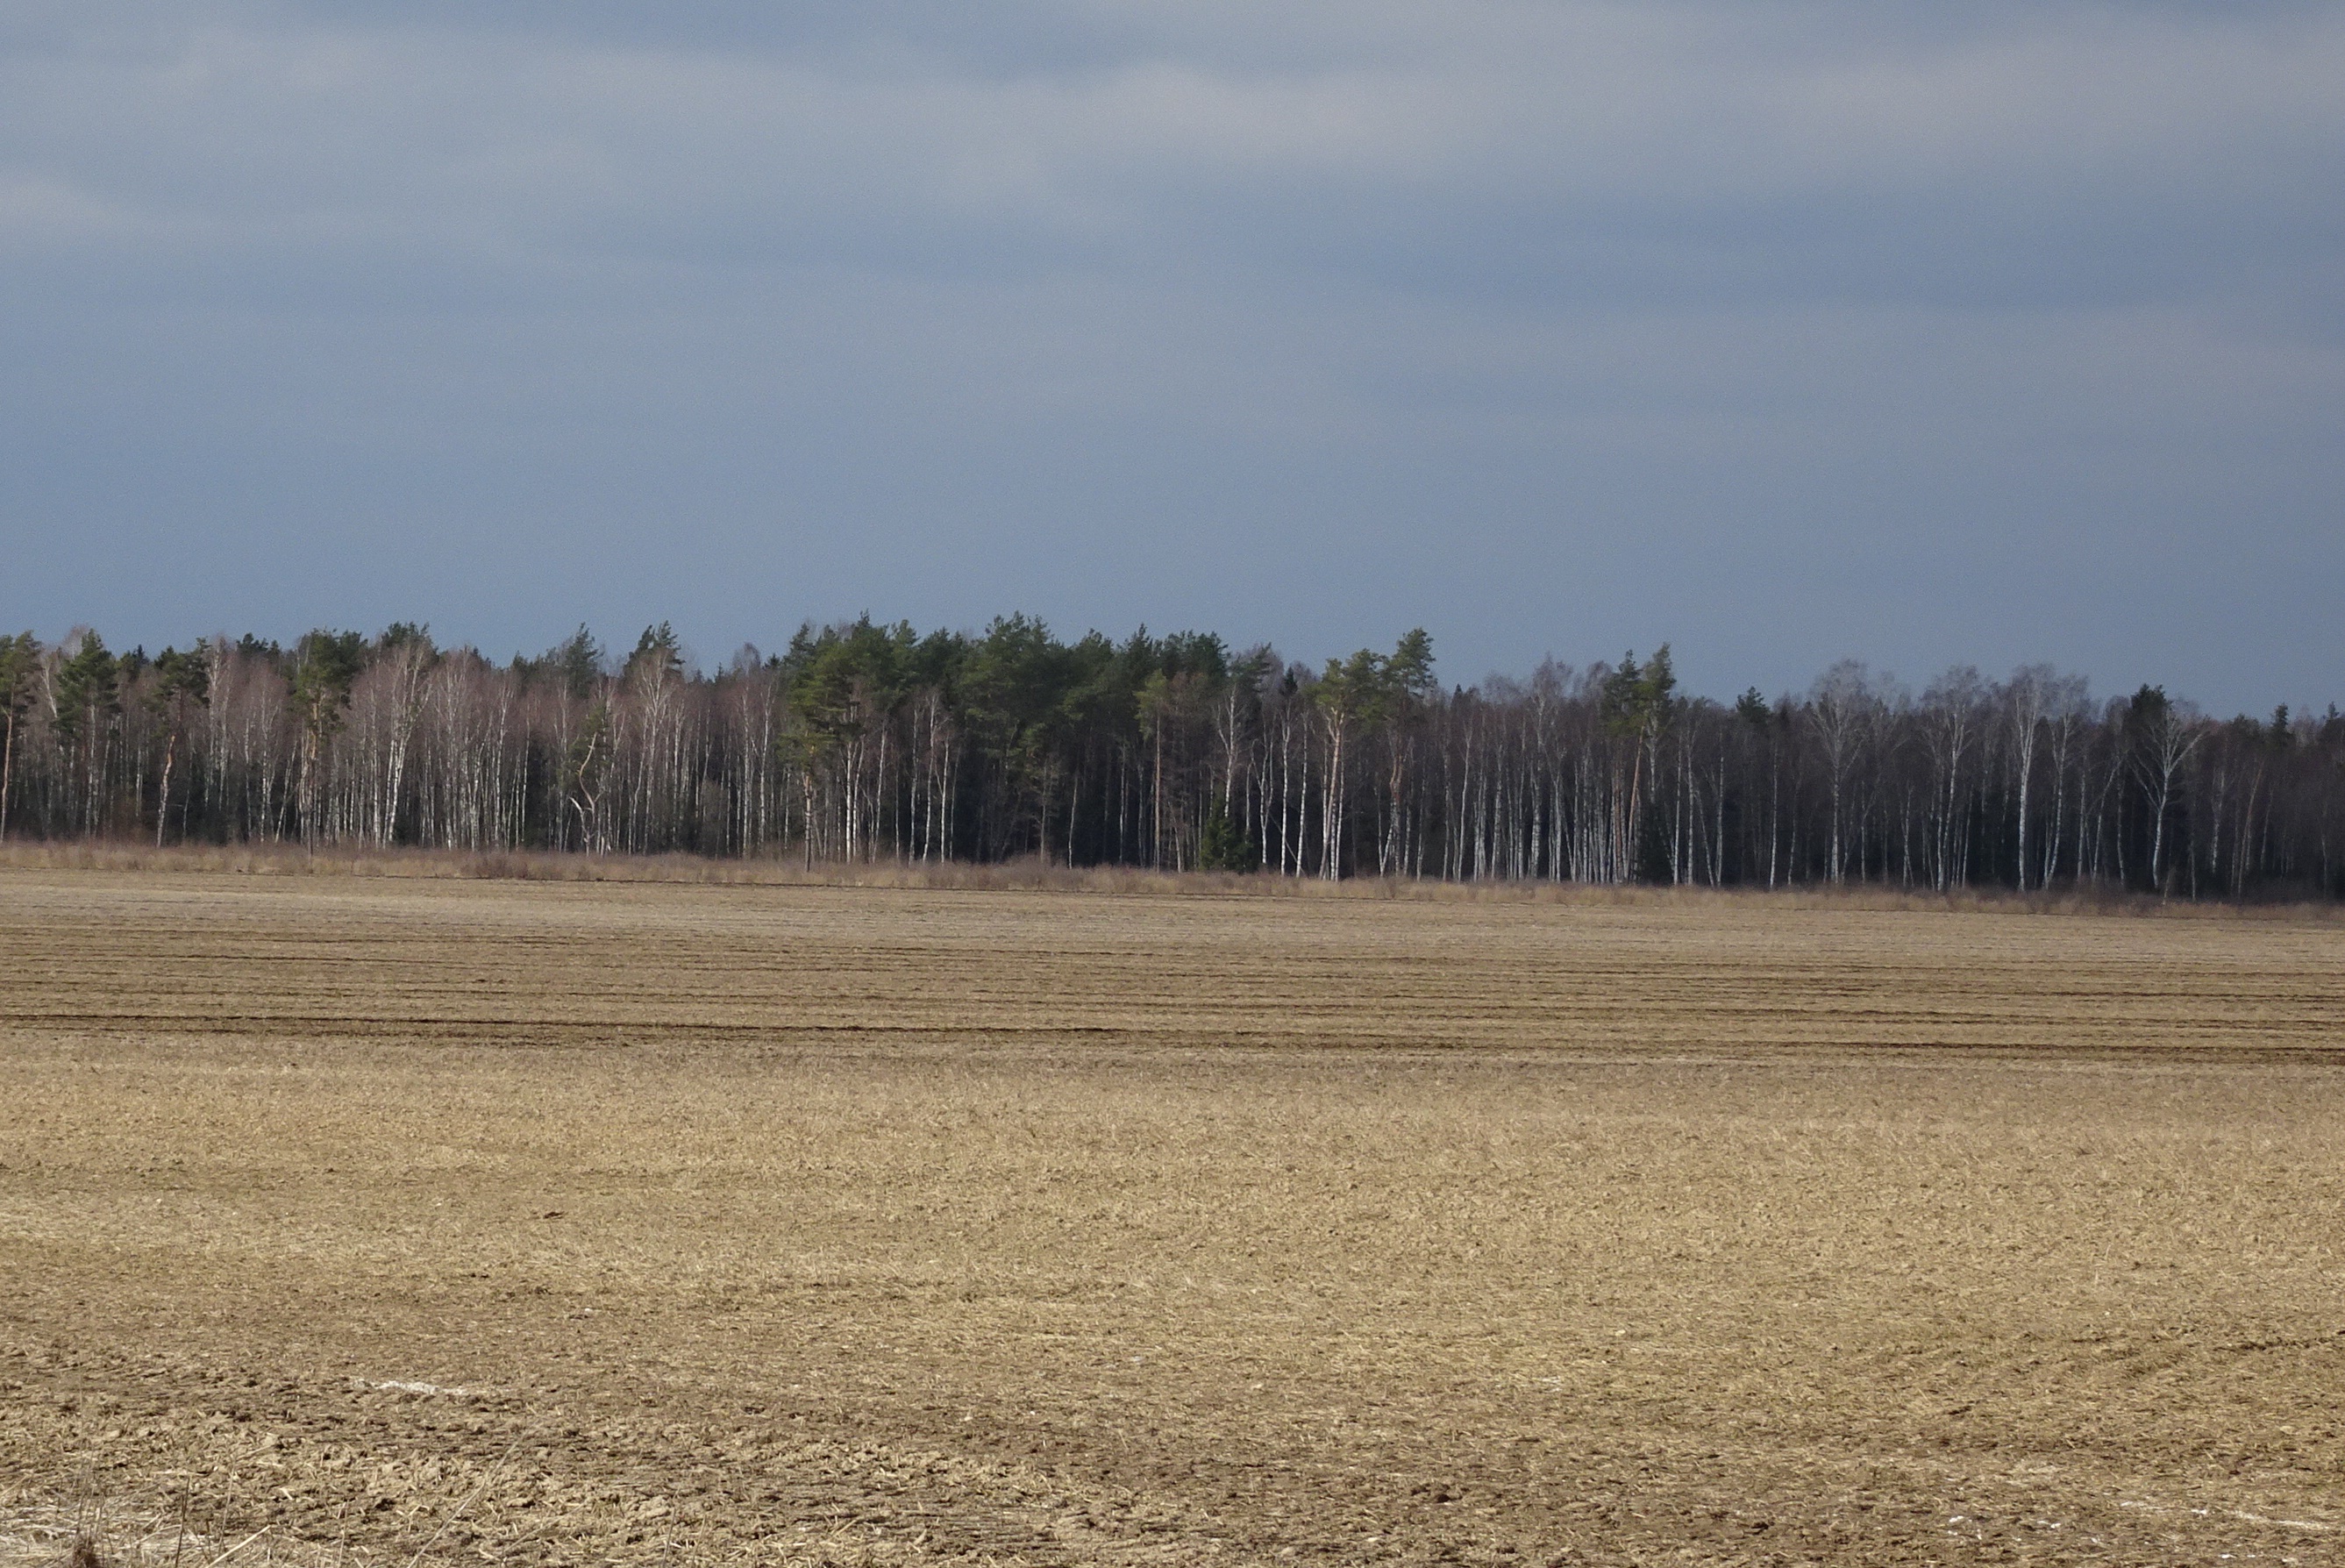
The technology is applied in sub-humid climate with an average of 696 mm of precipitations per year, from which more comes from July to October and less in March and April. Average annual temperature is +4 C, length of the growing period is 180-195 days. The territory is mostly flat, the southern part is hilly with slopes of 6-10%. Average altitude from the sea level is 50 m. About half of the Estonian territory is above 50 m and half is below it. Soils are from very shallow (less than 0.1 m) in the north to very deep (> 120m ) in the south. Soil cover is very variable. In the agricultural area the soils are medium textured with low (< 1%) to high (>5%) organic matter in topsoil. Groundwater is near the surface in wet soils and deep in hilly areas. Biodiversity varies from high to low depending on soil and landscape. Market orientation of production system is mixed and off-farm income is less than 10%. Relative level of wealth is average from individual households to cooperatives. Soil management is mechanized. Land belongs to land users, but is leased also in case of bigger farms (over 100 ha).
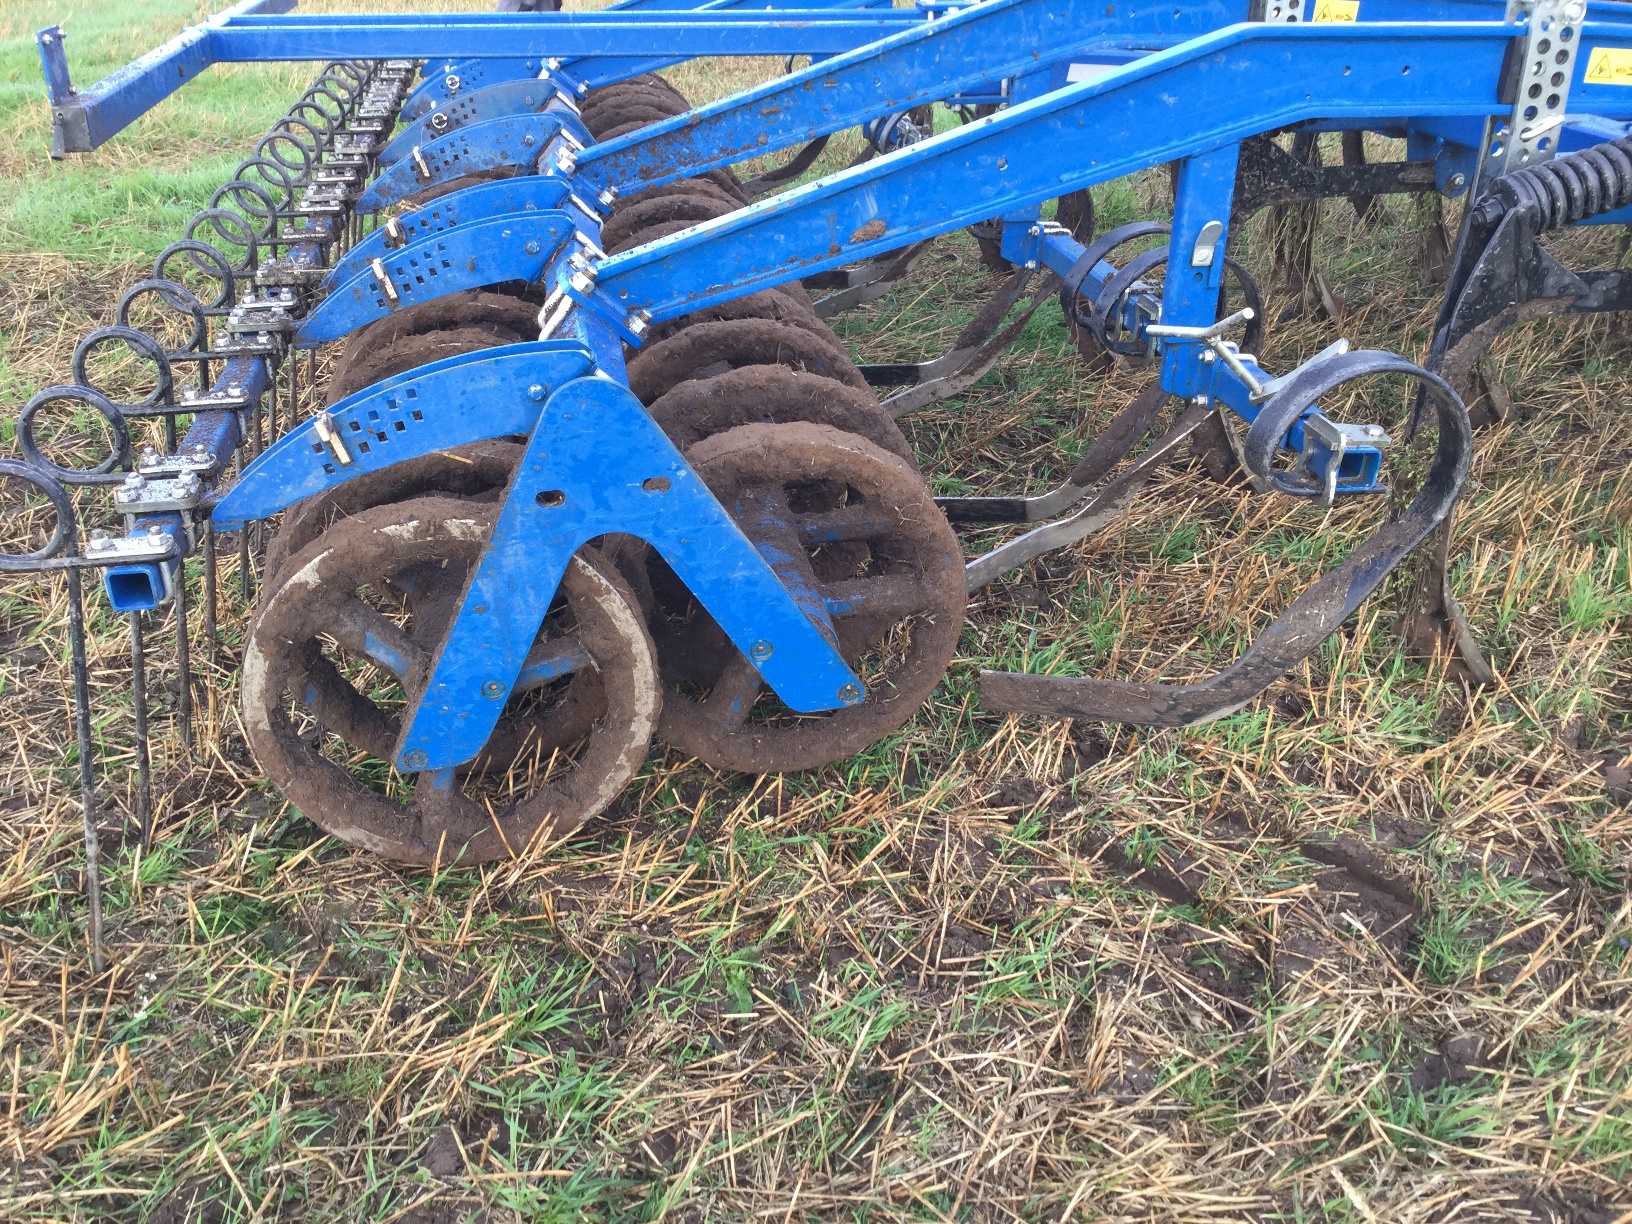
Reduced tillage is the tillage method used in agriculture to prepare the seedbed. Usually only the upper 10-18 cm of the soil surface is tilled. There is no use of ploughing and thus it is the method that does not turn the soil over. This may involve the use of a chisel plough, field cultivators, or other implements. Depth of the soil preparation depends on the culture in the rotation - before cereals 10-12 cm, before oilseed rape 15-18 cm. The main equipments to prepare the seedbed are the disc cultivator and the tine cultivator or a combined cultivator. The work can be ordered from contractors as well. Usually farms own the equipment.
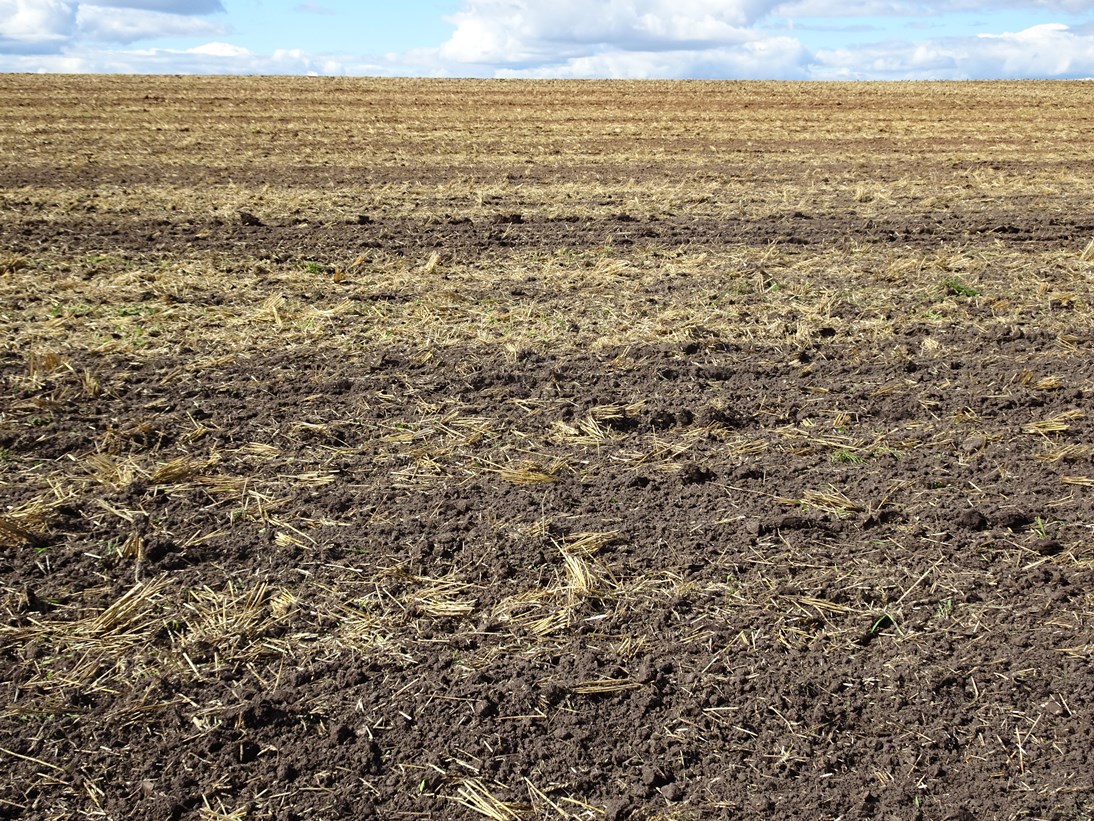
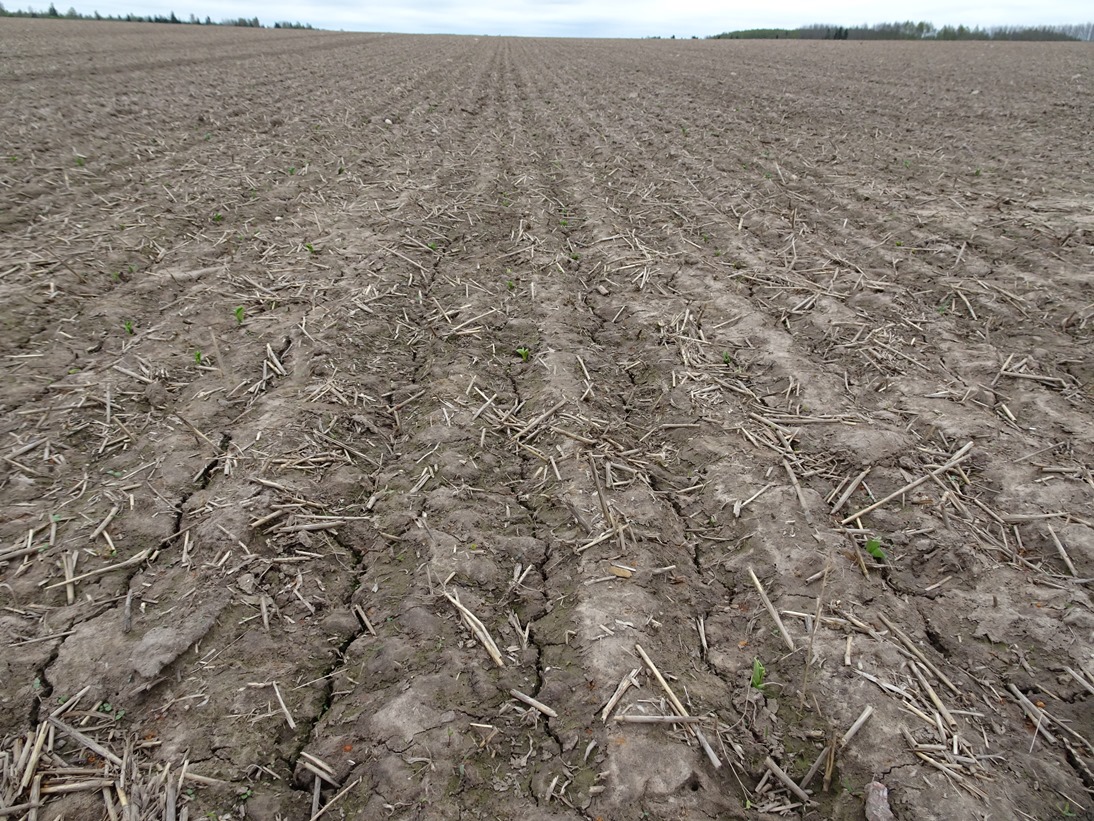
The main goal is to maintain soil structure, to improve water infiltration, to reduce compaction, and to reduce fuel and labour costs. As there will remain 30% more residues on the soil surface it will promote the activity of soil organisms. Less disturbance in deeper layers increases number of earthworms and increases species diversity. The greatest benefits for the land users are the reduced fuel and labour costs. The reduced tillage is more suitable for crop rotations without root crops. For example, rotation can be as follow: winter oilseed rape - winter wheat - pea (or bean) - winter wheat - spring barley undersown with red clover - red clover. However, the soil compaction and weediness can drastically increase during the first years of the implementation without using a proper crop rotation or management plan. The soil conditions (compaction and weediness) can get worser inside the first 4 years and start to improve after that. It is not suitable for fields which are heavily affected by perennial weeds, as noninversional tillage can spread the weed roots and higher doses of herbicides are needed.
2.3 Photos of the Technology
Media Gallery
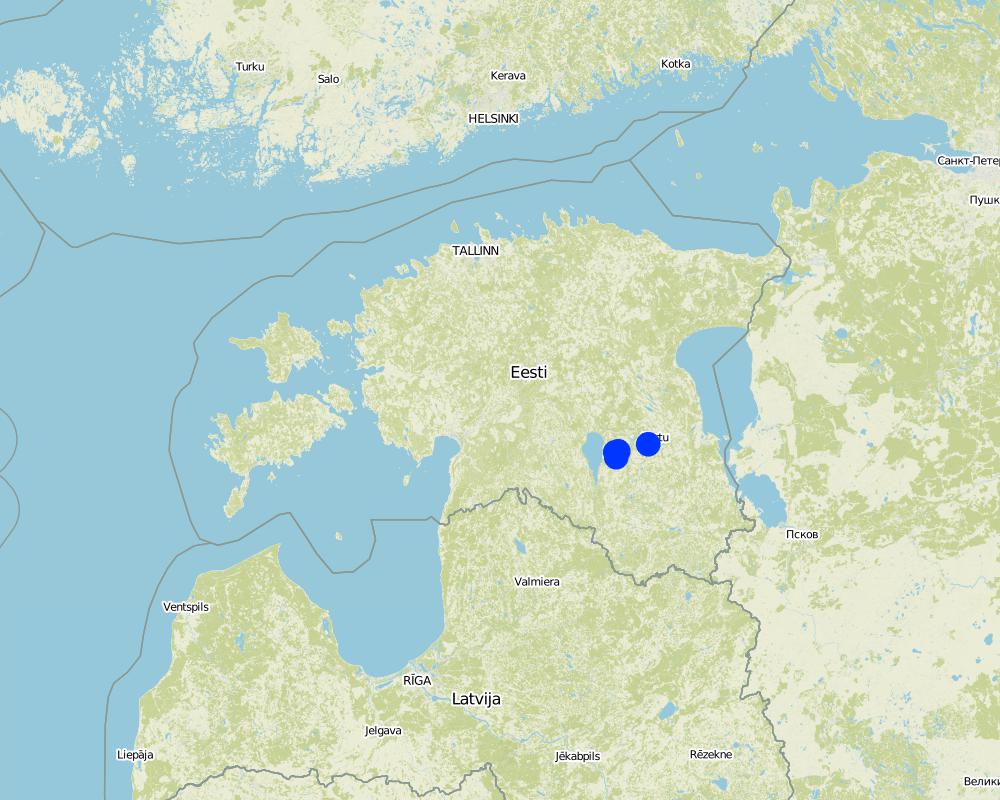
2.5 Country/ region/ locations where the Technology has been applied and which are covered by this assessment
Country:
Estonia
Region/ State/ Province:
Tartu county
Further specification of location:
Kobilu
Specify the spread of the Technology:
- evenly spread over an area
If precise area is not known, indicate approximate area covered:
- 1-10 km2
Comments:
2/3 of cereals is cultivated by minimum tillage technology in Estonia.
Map
×2.6 Date of implementation
If precise year is not known, indicate approximate date:
- less than 10 years ago (recently)
2.7 Introduction of the Technology
Specify how the Technology was introduced:
- through land users' innovation
3. Classification of the SLM Technology
3.1 Main purpose(s) of the Technology
- reduce, prevent, restore land degradation
- create beneficial economic impact
3.2 Current land use type(s) where the Technology is applied

Cropland
- Annual cropping
Annual cropping - Specify crops:
- cereals - barley
- cereals - maize
- cereals - oats
- cereals - other
- cereals - rye
- cereals - wheat (spring)
- cereals - wheat (winter)
- legumes and pulses - beans
- legumes and pulses - peas
- oilseed crops - sunflower, rapeseed, other
Number of growing seasons per year:
- 1
Specify:
One harvest of cereals per year.
Comments:
Main crops: winter and spring wheat, winter and spring barley, oat, rye, pea, bean, oilseed rape, corn for silage, buckwheat
3.3 Has land use changed due to the implementation of the Technology?
Has land use changed due to the implementation of the Technology?
- Yes (Please fill out the questions below with regard to the land use before implementation of the Technology)
Cropland
- Annual cropping
Comments:
Before the use of reduced tillage conventional tillage (with ploughing) has been used.
3.4 Water supply
Water supply for the land on which the Technology is applied:
- rainfed
3.5 SLM group to which the Technology belongs
- improved ground/ vegetation cover
- minimal soil disturbance
3.6 SLM measures comprising the Technology

agronomic measures
- A3: Soil surface treatment
3.7 Main types of land degradation addressed by the Technology

soil erosion by water
- Wt: loss of topsoil/ surface erosion
soil erosion by wind
- Et: loss of topsoil

chemical soil deterioration
- Cn: fertility decline and reduced organic matter content (not caused by erosion)

physical soil deterioration
- Pc: compaction
3.8 Prevention, reduction, or restoration of land degradation
Specify the goal of the Technology with regard to land degradation:
- prevent land degradation
- reduce land degradation
4. Technical specifications, implementation activities, inputs, and costs
4.1 Technical drawing of the Technology
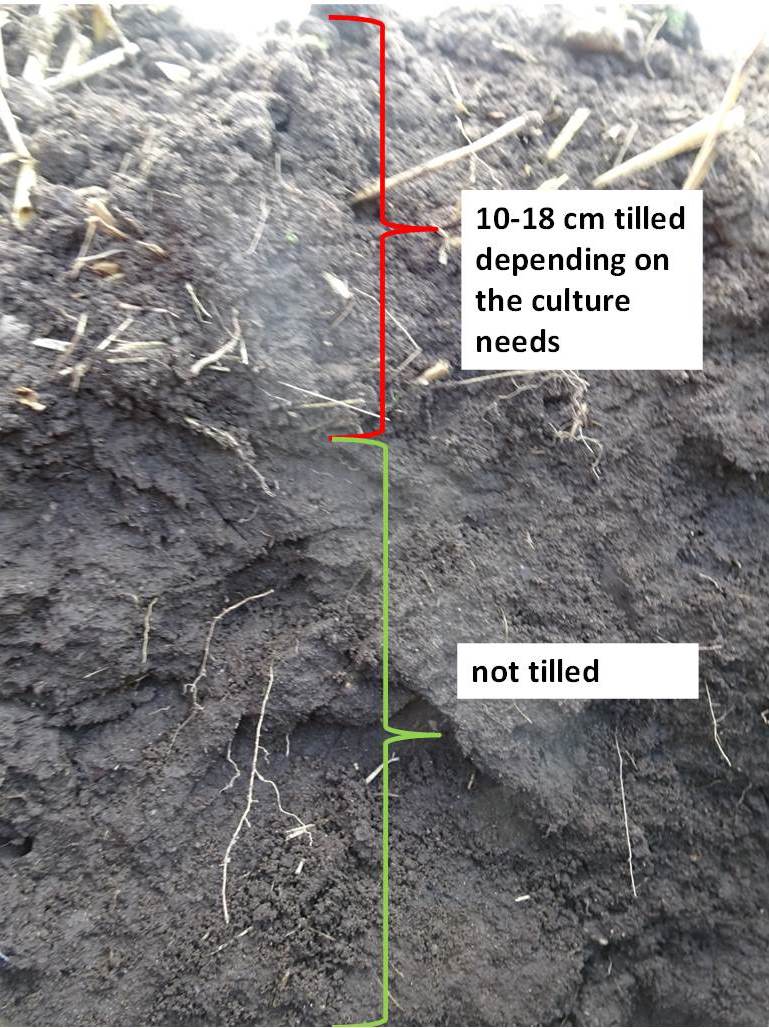
Technical specifications (related to technical drawing):
To till the soil chisel ploughing or disc cultivator is used without turning the soil over. For cereals the suitable depth is 10-12 cm, for oilseed rape 15-18 cm. Ca 30% from straw will remain on the soil surface. To loosen the soil of deeper layers the deep chiseling down to 25 cm is used.
Author:
Endla Reintam
Date:
14/08/2017
4.2 General information regarding the calculation of inputs and costs
Specify how costs and inputs were calculated:
- per Technology unit
Specify unit:
hectar
other/ national currency (specify):
EUR
If relevant, indicate exchange rate from USD to local currency (e.g. 1 USD = 79.9 Brazilian Real): 1 USD =:
1.18
Indicate average wage cost of hired labour per day:
36-40 EUR/day + taxes
4.3 Establishment activities
| Activity | Timing (season) | |
|---|---|---|
| 1. | Purchase of cultivator (disc or combination cultivator) |
4.4 Costs and inputs needed for establishment
| Specify input | Unit | Quantity | Costs per Unit | Total costs per input | % of costs borne by land users | |
|---|---|---|---|---|---|---|
| Equipment | Disc cultivator | piece | 1.0 | 15000.0 | 15000.0 | 100.0 |
| Total costs for establishment of the Technology | 15000.0 | |||||
| Total costs for establishment of the Technology in USD | 12711.86 | |||||
4.5 Maintenance/ recurrent activities
| Activity | Timing/ frequency | |
|---|---|---|
| 1. | Seedbed preparation (tillage before drilling) | before drilling (spring crops in spring (April), winter crops in autumn (August)) |
| 2. | Fertilization, drilling | in spring or in autumn, drilling and fertlization at the same time |
| 3. | Plant protection | up to 3 times during growth period depending of weediness, infections and insects |
| 4. | Fertilization during growth period | For winter crops in spring after snowmelt in the beginning of growth, for spring crops in the beginning of intensive growth |
| 5. | Harvest and grain transport | in the end of season (end of July to beginning of September depending of the crop) |
| 6. | Drying of grain and soil tillage | after harvest |
Comments:
The example is based on the assumption that the yield will be around 6 t/ha and we grow cereals (winter or spring wheat)
4.6 Costs and inputs needed for maintenance/ recurrent activities (per year)
| Specify input | Unit | Quantity | Costs per Unit | Total costs per input | % of costs borne by land users | |
|---|---|---|---|---|---|---|
| Equipment | Seedbed preparation, fertilization, sowing | times | 1.0 | 131.9 | 131.9 | 100.0 |
| Equipment | Plant protection | times | 3.0 | 11.2 | 33.6 | 100.0 |
| Equipment | Fertilization during growth period | times | 1.0 | 16.2 | 16.2 | 100.0 |
| Equipment | Harvest and grain transport | times | 1.0 | 118.5 | 118.5 | 100.0 |
| Equipment | Drying and after harvest activities | times | 1.0 | 132.1 | 132.1 | 100.0 |
| Plant material | seeds | kg | 200.0 | 0.28 | 56.0 | 100.0 |
| Fertilizers and biocides | Ammonium nitrate (2x per season) 147 kg/ha N (200 kg fertilizer per ha) | kg | 147.0 | 0.84 | 123.48 | 100.0 |
| Fertilizers and biocides | Complex fertilizer (27 kg N, 40 kg P and 112 kg K per ha) (450 kg of fertilizer per ha) | kg | 179.0 | 0.74 | 132.46 | 100.0 |
| Fertilizers and biocides | Herbicides (1 time) | times | 1.0 | 27.0 | 27.0 | 100.0 |
| Fertilizers and biocides | Fungicides (1 time) | times | 1.0 | 33.2 | 33.2 | 100.0 |
| Fertilizers and biocides | Insecticides (1 time) | times | 1.0 | 3.6 | 3.6 | 100.0 |
| Fertilizers and biocides | Retartants | times | 1.0 | 14.0 | 14.0 | 100.0 |
| Total costs for maintenance of the Technology | 822.04 | |||||
| Total costs for maintenance of the Technology in USD | 696.64 | |||||
If land user bore less than 100% of costs, indicate who covered the remaining costs:
Agricultural producers can have governmental support per unit 83.71 EUR/ha and the greening support 38.81 EUR/ha.
Comments:
The labour costs are included to the machinery work costs. An average the labour cost for a driver is 15-18 EUR/ha. The average machinery work costs to produce 4.5 t of winter wheat were 388 EUR/ha, 355 EUR/ha and 322 EUR/ha in conventional, minimum and no-tillage, respectively in 2016. Cost of production in this case was 159 EUR/t, 152 EUR/t and 147 EUR/t in conventional, minimum and no-tillage, respectively.
To produce the same amount of spring barley, the cost of machinery was 365 EUR/ha, 345 EUR/ha and 300 EUR/ha in conventional, minimum and no-tillage, respectively. Cost of production in this case was 142 EUR/t, 139 EUR/t and 129 EUR/t in conventional, minimum and no-tillage, respectively.
The machinery cost for minimum tillage is 33 EUR and 20 EUR less than for conventional plough based tillage for winter wheat and spring barley, respectively.
By minimum tillage the use of fuel is ca 38% less than by ploughing.
4.7 Most important factors affecting the costs
Describe the most determinate factors affecting the costs:
Fuel costs, labour cost
5. Natural and human environment
5.1 Climate
Annual rainfall
- < 250 mm
- 251-500 mm
- 501-750 mm
- 751-1,000 mm
- 1,001-1,500 mm
- 1,501-2,000 mm
- 2,001-3,000 mm
- 3,001-4,000 mm
- > 4,000 mm
Specify average annual rainfall (if known), in mm:
696.00
Specifications/ comments on rainfall:
Average 696 mm, almost equally spread over the year, more from July to October, less in March and April.
Indicate the name of the reference meteorological station considered:
Tartu Tõravere
Agro-climatic zone
- sub-humid
LGP 180-195 days
5.2 Topography
Slopes on average:
- flat (0-2%)
- gentle (3-5%)
- moderate (6-10%)
- rolling (11-15%)
- hilly (16-30%)
- steep (31-60%)
- very steep (>60%)
Landforms:
- plateau/plains
- ridges
- mountain slopes
- hill slopes
- footslopes
- valley floors
Altitudinal zone:
- 0-100 m a.s.l.
- 101-500 m a.s.l.
- 501-1,000 m a.s.l.
- 1,001-1,500 m a.s.l.
- 1,501-2,000 m a.s.l.
- 2,001-2,500 m a.s.l.
- 2,501-3,000 m a.s.l.
- 3,001-4,000 m a.s.l.
- > 4,000 m a.s.l.
Indicate if the Technology is specifically applied in:
- convex situations
5.3 Soils
Soil depth on average:
- very shallow (0-20 cm)
- shallow (21-50 cm)
- moderately deep (51-80 cm)
- deep (81-120 cm)
- very deep (> 120 cm)
Soil texture (topsoil):
- medium (loamy, silty)
Soil texture (> 20 cm below surface):
- medium (loamy, silty)
Topsoil organic matter:
- medium (1-3%)
If available, attach full soil description or specify the available information, e.g. soil type, soil PH/ acidity, Cation Exchange Capacity, nitrogen, salinity etc.
On the main investigated area it is sandy loan Stagnic Luvisol, in some parts Calcaric Luvisol. pH in water 6.9-7.3
5.4 Water availability and quality
Ground water table:
5-50 m
Availability of surface water:
good
Water quality (untreated):
good drinking water
Is water salinity a problem?
No
Is flooding of the area occurring?
No
5.5 Biodiversity
Species diversity:
- medium
Habitat diversity:
- medium
5.6 Characteristics of land users applying the Technology
Sedentary or nomadic:
- Sedentary
Market orientation of production system:
- commercial/ market
Off-farm income:
- less than 10% of all income
Relative level of wealth:
- average
Individuals or groups:
- individual/ household
- cooperative
Level of mechanization:
- mechanized/ motorized
Gender:
- women
- men
Age of land users:
- youth
- middle-aged
5.7 Average area of land used by land users applying the Technology
- < 0.5 ha
- 0.5-1 ha
- 1-2 ha
- 2-5 ha
- 5-15 ha
- 15-50 ha
- 50-100 ha
- 100-500 ha
- 500-1,000 ha
- 1,000-10,000 ha
- > 10,000 ha
Is this considered small-, medium- or large-scale (referring to local context)?
- medium-scale
Comments:
The total area of one investigated farm is 1036 ha (all covered by minimum tillage), another farm size is 2320 ha and under minimum tillage it is 1231.5 ha.
5.8 Land ownership, land use rights, and water use rights
Land ownership:
- state
- company
Land use rights:
- leased
- individual
Water use rights:
- open access (unorganized)
- individual
5.9 Access to services and infrastructure
health:
- poor
- moderate
- good
education:
- poor
- moderate
- good
technical assistance:
- poor
- moderate
- good
employment (e.g. off-farm):
- poor
- moderate
- good
markets:
- poor
- moderate
- good
energy:
- poor
- moderate
- good
roads and transport:
- poor
- moderate
- good
drinking water and sanitation:
- poor
- moderate
- good
financial services:
- poor
- moderate
- good
6. Impacts and concluding statements
6.1 On-site impacts the Technology has shown
Socio-economic impacts
Production
crop production
Quantity before SLM:
6.3
Quantity after SLM:
6.75
Comments/ specify:
The example is based on winter wheat. For spring barley 4.56 and 4.52, for spring oilseed rape 2.24 and 2.15 t/ha with ploughing and with minimum tillage, respectively.
Different studies have shown that the yield can be higher and also lower compared to the conventional tillage. It depends also on the weather conditions and intensity of mangement (fertilization, pesticides).
crop quality
Quantity before SLM:
37.7
Quantity after SLM:
38.1
Comments/ specify:
The weight of thousand grain of winter wheat can be higher under minimum tillage than under conventional tillage in some years. As an average of different years, there is no differences and under conventional tillage the weight of 1000 grains can be slightly higher.
land management
Comments/ specify:
As there is no conventional ploughing, the management is simplified. However, bigger attention should be paid on weed management and crop rotation, which may hinders the land management. There is need to include weed suppressing species, such red clover (or similar) into the rotation.
Income and costs
expenses on agricultural inputs
Quantity before SLM:
10.1
Quantity after SLM:
5.2
Comments/ specify:
Fuel cost by ploughing and with minimum tillage as EUR/ha. The fuel demand for tillage will decrease from ca 14 l/ha to 7.2 l/ha
farm income
Comments/ specify:
Production costs for producing 1 ton of winter wheat are 5 EUR less by minimum tillage than by ploughing at high yield level (6 t/ha). In some calculations they show 1.7-1.8 times less costs for tillage by minimum tillage compared to ploughing.
workload
Comments/ specify:
Field operations takes less time, decreasing labour costs.
Socio-cultural impacts
food security/ self-sufficiency
Comments/ specify:
Decreasing production costs allows to sell the food with lower price.
SLM/ land degradation knowledge
Comments/ specify:
Farmers turning to the minimum tillage have to clarify for themselves the behaviour of their soils, crop rotations etc. to prevent excess compaction, weed infestation.
Ecological impacts
Water cycle/ runoff
harvesting/ collection of water
Comments/ specify:
30% remaining residues on the soil surface helps to catch more snow during the winter.
surface runoff
Comments/ specify:
Higher amount of residues on the soil surface allows water to infiltrate quicker into the soil, as raindrops can not damaging the soil structure as much as after ploughing.
excess water drainage
Comments/ specify:
Better soil structure allows water to infiltrate quicker into the soil. Without ploughpan and with intact pore system water drains quicker to the deeper soil.
evaporation
Comments/ specify:
30% plant residues do not allow water to evaporate in the same speed as by ploughing.
Soil
soil moisture
Comments/ specify:
Slight differences in deeper soil (20-25 cm) ca. 4% more moisture in minimum than conventional tillage.
soil cover
Quantity before SLM:
0
Quantity after SLM:
30%
Comments/ specify:
30% more plant residues remain on the soil surface after minimum tillage compared to the ploughing.
soil loss
Comments/ specify:
Extra residues on the soil surface and better soil structure compared to ploughing reduces soil loss by wind and water.
soil accumulation
Comments/ specify:
Increase of soil organic carbon by 0.1-0.2% compared to ploughing.
soil crusting/ sealing
Comments/ specify:
Stronger soil structure because the increasing organic carbon level improves the resistance to raindrop impact and by this it reduces soil crusting.
soil compaction
Comments/ specify:
In the layer 10-20 cm the increase can be over 0.2 g/cm3 compared to ploughed soils. However, after 4-5 years the conditions starts to improve and there will be less compaction in mentioned layer and deeper (plough pan starts to disappear).
nutrient cycling/ recharge
Comments/ specify:
Less intensive decomposition of organic matter leaves more nutrients in the soil.
soil organic matter/ below ground C
Comments/ specify:
Slight increase of organic carbon by 0.1-0.2%. Depends more on crop rotation than tillage method.
Biodiversity: vegetation, animals
Vegetation cover
Comments/ specify:
Due to the need to suppress weeds more winter crops or cover crops are included into the rotation. However, this effect can only be stated if the rotation and management plan will be changed.
plant diversity
Comments/ specify:
Due to the need of changes in crop rotation, more diverse rotations instead of monoculture to suppress weeds. Weeds diversity might increase due to the reduced tillage intensity.
animal diversity
Comments/ specify:
More spiders, beetles, ants compared to ploughed soils.
beneficial species
Quantity before SLM:
2 species of earthworms
Quantity after SLM:
3-4 species of earthworms
Comments/ specify:
More earthworm species and higher abundance compared to ploughed soils.
pest/ disease control
Comments/ specify:
Due to the decreased tillage intensity more attention should be paid on weed, pests and disease control by crop rotation and pesticies. As the residues remain on the soil surface there are also better conditions for pests and disease spreading.
Climate and disaster risk reduction
emission of carbon and greenhouse gases
Comments/ specify:
Due to the decreased decomposition intensity, less CO2 emission from soil organic matter (increase of soil organic matter 0.1-0.2% compared to ploughing). As the fuel consumption is ca 40% less than by ploughing, less emission is coming from agriculture.
fire risk
Comments/ specify:
As there will remain 30% of residues on the soil surface, there is an increased risk of fires in spring.
micro-climate
Comments/ specify:
Residues regulate soil evapotranspiration and temperature. The fluctuations are not so high as by ploughing.
6.2 Off-site impacts the Technology has shown
buffering/ filtering capacity
Comments/ specify:
As the soil organic carbon content increases, also the water holding and the nutrient holding capacity increase.
wind transported sediments
Comments/ specify:
Less sediments due to the lower tillge intensity and more residues on the soil surface
damage on neighbours' fields
Comments/ specify:
Less sediments from the field to the neighbours fields. Effect on water erosion depends on the slope.
damage on public/ private infrastructure
Comments/ specify:
Due to the reduced water erosion, less soil will be transported to the diches and roads (depends on slope).
impact of greenhouse gases
Comments/ specify:
Due to the decreased decomposition intensity, less CO2 emission from soil organic matter (increase of soil organic matter 0.1-0.2% compared to ploughing). As the fuel consumption is ca 40% less than by ploughing, less emission comes from agriculture.
6.3 Exposure and sensitivity of the Technology to gradual climate change and climate-related extremes/ disasters (as perceived by land users)
Gradual climate change
Gradual climate change
| Season | increase or decrease | How does the Technology cope with it? | |
|---|---|---|---|
| annual temperature | increase | not known | |
| seasonal temperature | winter | increase | not known |
| seasonal temperature | spring | increase | not known |
| annual rainfall | increase | not known | |
| seasonal rainfall | winter | increase | not known |
| seasonal rainfall | autumn | increase | not known |
Climate-related extremes (disasters)
Meteorological disasters
| How does the Technology cope with it? | |
|---|---|
| local rainstorm | not known |
| local thunderstorm | not known |
| local hailstorm | not known |
| local snowstorm | not known |
| local windstorm | not known |
Climatological disasters
| How does the Technology cope with it? | |
|---|---|
| cold wave | not known |
| extreme winter conditions | not known |
| land fire | moderately |
6.4 Cost-benefit analysis
How do the benefits compare with the establishment costs (from land users’ perspective)?
Short-term returns:
slightly negative
Long-term returns:
positive
How do the benefits compare with the maintenance/ recurrent costs (from land users' perspective)?
Short-term returns:
positive
Long-term returns:
positive
6.5 Adoption of the Technology
- 1-10%
If available, quantify (no. of households and/ or area covered):
85 371 ha
Of all those who have adopted the Technology, how many did so spontaneously, i.e. without receiving any material incentives/ payments?
- 91-100%
6.6 Adaptation
Has the Technology been modified recently to adapt to changing conditions?
No
6.7 Strengths/ advantages/ opportunities of the Technology
| Strengths/ advantages/ opportunities in the land user’s view |
|---|
| Decrease of work load, time and labour costs. |
| Decrease of fuel consumption, increase of income. |
| Increase of soil biological activity, soil organic matter content, better structure and infiltration. |
| Strengths/ advantages/ opportunities in the compiler’s or other key resource person’s view |
|---|
| Decrease of soil organic carbon decomposition. |
| Decrease of soil erosion. |
| Increase of soil biological activity. |
6.8 Weaknesses/ disadvantages/ risks of the Technology and ways of overcoming them
| Weaknesses/ disadvantages/ risks in the land user’s view | How can they be overcome? |
|---|---|
| Increase of weed abundance and soil compaction | Proper crop rotation and timing |
| Weaknesses/ disadvantages/ risks in the compiler’s or other key resource person’s view | How can they be overcome? |
|---|---|
| Higher use of pesticides and risk to soil and water pollution. | Changes in crop rotation, use of cover crops |
7. References and links
7.1 Methods/ sources of information
- field visits, field surveys
5 during the iSQAPER project, more than 20 in total with other projects
- interviews with land users
5, more than 40 in total with other projects
- compilation from reports and other existing documentation
7
When were the data compiled (in the field)?
18/05/2017
7.2 References to available publications
Title, author, year, ISBN:
Minimeeritud harimine ja otsekülv. 2017. P. Viil. Eesti Taimekasvatuse Instituut. ISBN 978-9949-9742-2-1:
Available from where? Costs?
ISBN 978-9949-9742-2-1
7.3 Links to relevant online information
Title/ description:
Kattetulu arvestused taime- ja loomakasvatuses 2016. Koost: Marju Aamisepp, Helle Persitski. Maamajanduse infokeskus. 2017.:
URL:
http://www.maainfo.ee/data/trykis/kattetulu/KATTETULU2016.pdf
Title/ description:
Statistics Estonia
URL:
https://www.stat.ee/en
Title/ description:
Erinevate viljelusmeetodite ( sh. otsekülv) rakendusteaduslik kompleksuuring. Riikliku programmi “Põllumajanduslikud rakendusuuringud ja
URL:
http://www.pikk.ee/upload/les/Erinevad_viljelusviisid_pikk_aruanne.pdf
Title/ description:
Minimeeritud harimine ja otsekülv. 2017. P. Viil. Eesti Taimekasvatuse Instituut.:
URL:
http://taim.etki.ee/taim/public/pdf/Trukised/Otseklv-minimeeritudmullaharimine.
Title/ description:
Eesti maaelu arengukava 2014-2020 4. ja 5. prioriteedi meetmete ja 3. prioriteedi loomade heaolu meetme püsihindamisaruanne 2015. aasta kohta ja
URL:
http://pmk.agri.ee/mak/avaleht/
Title/ description:
Projekti ”Erinevate mullaharimise ja külvitehnoloogiate mõ-ju uuring tera- ja kaunviljade saagikusele viljavahelduslikus ja monokultuurses külvikorras” lõpparuanne
URL:
http://www.pikk.ee/upload/files/Teadusinfo/Lopparuanne_111_2002_2006.pdf
Title/ description:
Eesti tuleviku kliimastsenaariumid aastani 2100
URL:
https://www.envir.ee/sites/default/files/kliimastsenaariumid_kaur_aruanne_ver190815.pdf
Links and modules
Expand all Collapse allLinks
No links
Modules
No modules