Water harvest [Kenya]
- Creation:
- Update:
- Compiler: Kithinji Mutunga
- Editor: –
- Reviewer: David Streiff
Kunasa maji ya muua yanuyobubugika na kuyuelekeza shambani kwa uzakshaji-Alex R.Adual RSCU/SIDA1996
technologies_1097 - Kenya
View sections
Expand all Collapse all1. General information
1.2 Contact details of resource persons and institutions involved in the assessment and documentation of the Technology
Key resource person(s)
SLM specialist:
Mutisya Peter Maithya
Daleo's office P.O.Box 42 Makueni Kenya
Kenya
SLM specialist:
Ndengele Michael
Daleo's office P.O.Box 42 Makueni Kenya
Kenya
SLM specialist:
Nguluu Lucas Makau
Daleo's office P.O.Box 42 Makueni Kenya
Kenya
SLM specialist:
SLM specialist:
SLM specialist:
Adunal Alex R.
RELMA/SIDA
Lcraf house P.O.Box 63403 Nairobi, Kenya
Name of the institution(s) which facilitated the documentation/ evaluation of the Technology (if relevant)
Ministry of Agriculture, Livestock and Fisheries (MoA) - Kenya1.3 Conditions regarding the use of data documented through WOCAT
When were the data compiled (in the field)?
21/04/2003
The compiler and key resource person(s) accept the conditions regarding the use of data documented through WOCAT:
Yes
2. Description of the SLM Technology
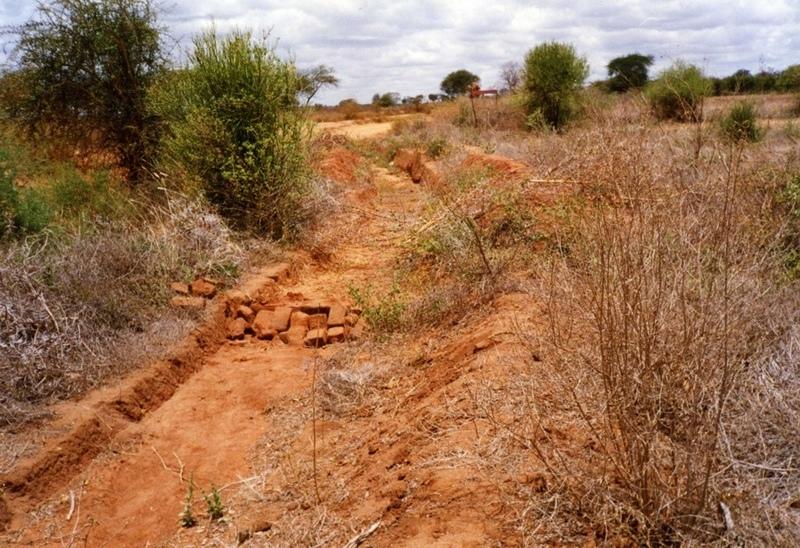
2.1 Short description of the Technology
Definition of the Technology:
Water harvest for agricultural production in Asals
2.2 Detailed description of the Technology
Description:
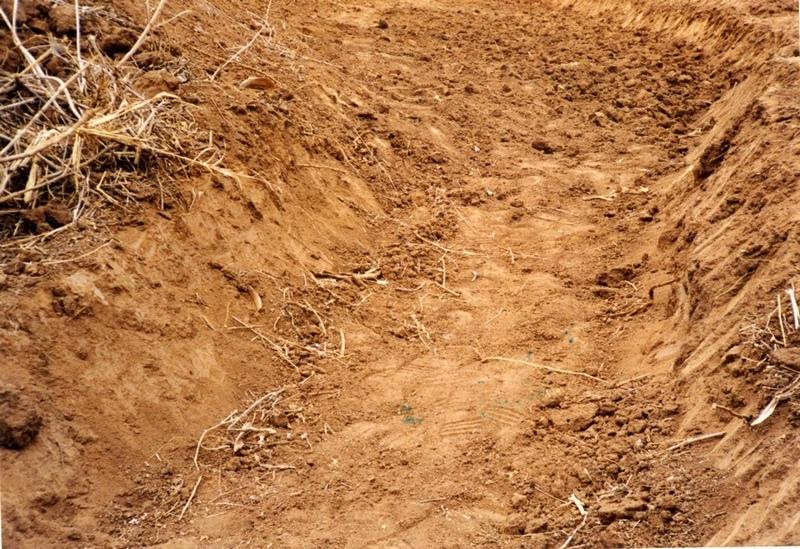
Water harvest enhances extra moisture and reduces risk of crop failure. It can either be external or internal. The activities also reduce runoff/overland flow and soil loss.
Manure and fertilizer improve soil water holding capacity and soil properties.
Appropriate tillage for improvement of infiltration rate of the soil.
2.3 Photos of the Technology
Media Gallery
2.5 Country/ region/ locations where the Technology has been applied and which are covered by this assessment
Country:
Kenya
Region/ State/ Province:
Eastern
Further specification of location:
KiMuiki, Kitise, Mburo, Kwa Kauisi
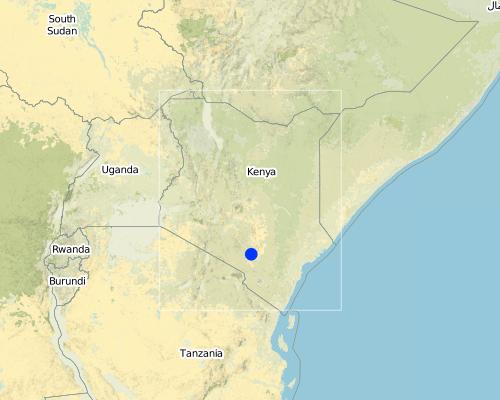
Map
×2.6 Date of implementation
If precise year is not known, indicate approximate date:
- less than 10 years ago (recently)
2.7 Introduction of the Technology
Specify how the Technology was introduced:
- through projects/ external interventions
Comments (type of project, etc.):
ministry of agriculture and rural development, soil and water conservation branch Nairobi, Kenya
3. Classification of the SLM Technology
3.1 Main purpose(s) of the Technology
- reduce, prevent, restore land degradation
3.2 Current land use type(s) where the Technology is applied

Cropland
- Annual cropping
Main crops (cash and food crops):
Major food crop: Maize
Other: C.peas
Mixed (crops/ grazing/ trees), incl. agroforestry
- Agro-silvopastoralism
Main products/ services:
Major cash crop CT: fruits
Selective felling of (semi-) natural forests for fuelwood purpose
Clear felling of (semi-)natural forests for agricultural production
Forest also for fruits and nuts
Comments:
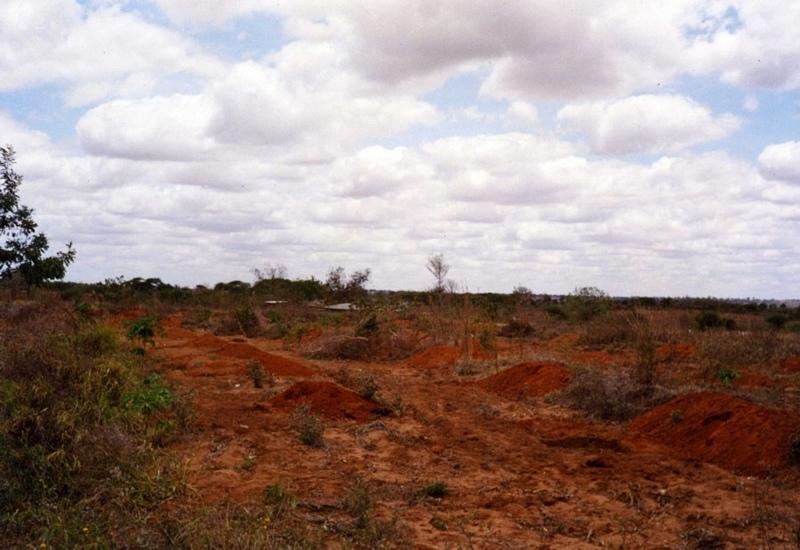
Major land use problems (compiler’s opinion): Topsoil losses, creation of hardban, soil surface crusting and fertility decline are major problems in areas without SWC.
Major land use problems (land users’ perception): Yield decline and poor quality produce are problems in areas without SWC.
Semi-nomadism / pastoralism: mixed land use type
Mixed: (eg agro-pastoralism, silvo-pastoralism): practiced by few
Other grazingland: semi-intensive grazing: semi-intensive grazing
Grazingland comments: Area closure can not be substituted, stall feeding materials not available. The family leader owns the stock but could fail to meet family needs if the system is not commercialized.
Selective felling of (semi-) natural forests: fuelwood purpose
Clear felling of (semi-)natural forests: for agricultural production
Problems / comments regarding forest use: Some uncontrolled grazing/browsing rather critical tp forest establoshment. Gapping can last long due to rainfall long intervals
Forest products and services: fuelwood, fruits and nuts
Type of cropping system and major crops comments: maize as major crop, followed by tubbers and legumes.
Type of grazing system comments: Area closure can not be substituted, stall feeding materials not available. The family leader owns the stock but could fail to meet family needs if the system is not commercialized.
Constraints of astructure network (roads, railways, pipe lines, power lines): roadside runoff enhances runoff Farming. Isolated trees preserved by traders in Mkt-centres
3.3 Further information about land use
Water supply for the land on which the Technology is applied:
- rainfed
Number of growing seasons per year:
- 2
Specify:
Longest growing period in days: 106 Longest growing period from month to month: Mar - Jun Second longest growing period in days: 71 Second longest growing period from month to month: Oct - Dec
3.4 SLM group to which the Technology belongs
- water harvesting
3.5 Spread of the Technology
Comments:
Total area covered by the SLM Technology is 45 m2.
Target-area 485 km^2 inhabited by 6550 farm families and population dynamic 46075.
3.6 SLM measures comprising the Technology

agronomic measures

vegetative measures
- V2: Grasses and perennial herbaceous plants
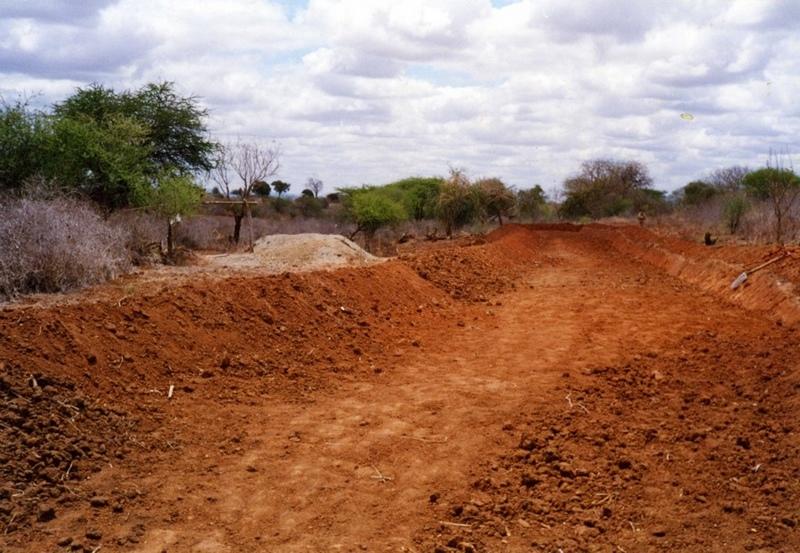
structural measures
- S3: Graded ditches, channels, waterways
Comments:
Main measures: structural measures
Secondary measures: agronomic measures, vegetative measures
Type of agronomic measures: relay cropping, manure / compost / residues, breaking compacted topsoil
Type of vegetative measures: aligned: -contour, scattered / dispersed, in blocks
3.7 Main types of land degradation addressed by the Technology

soil erosion by water
- Wt: loss of topsoil/ surface erosion

chemical soil deterioration
- Cn: fertility decline and reduced organic matter content (not caused by erosion)

physical soil deterioration
- Pk: slaking and crusting
- Pi: soil sealing
Comments:
Main type of degradation addressed: Pk: sealing and crusting
Secondary types of degradation addressed: Wt: loss of topsoil / surface erosion, Cn: fertility decline and reduced organic matter content
3.8 Prevention, reduction, or restoration of land degradation
Specify the goal of the Technology with regard to land degradation:
- prevent land degradation
Comments:
Secondary goals: mitigation / reduction of land degradation, rehabilitation / reclamation of denuded land
4. Technical specifications, implementation activities, inputs, and costs
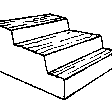
4.1 Technical drawing of the Technology
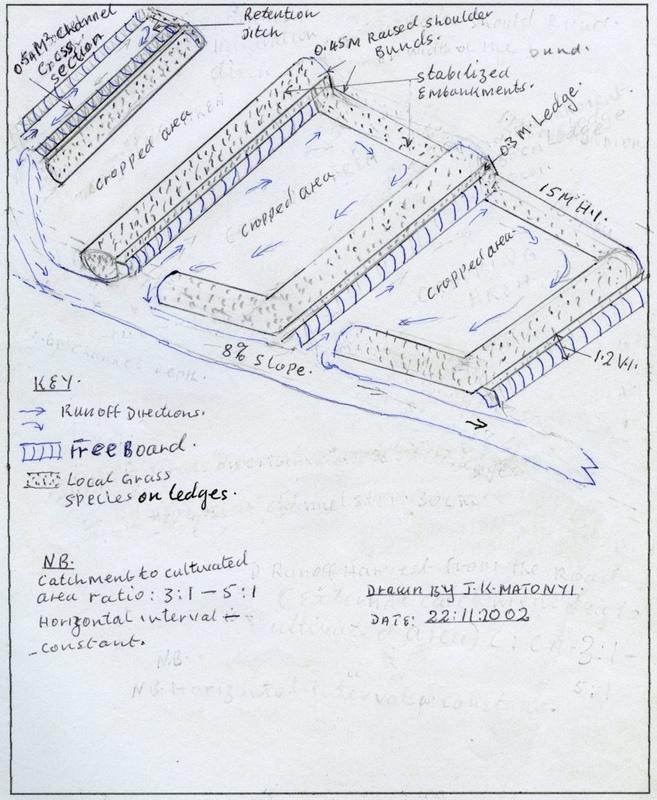
Author:
James K. Matonyi
4.2 Technical specifications/ explanations of technical drawing
technical drawing catchment to cultural area ratio: 3:1 - 5:1 Horizontal interval constant
Makueni district
Date: 22.11.2002
Technical knowledge required for field staff / advisors: moderate
Technical knowledge required for land users: high
Main technical functions: water harvesting / increase water supply
Secondary technical functions: increase / maintain water stored in soil, increase in soil fertility
Relay cropping
Material/ species: improved mango trees
Quantity/ density: 124
Remarks: 9 m^2
Manure / compost / residues
Material/ species: FYM/compost
Quantity/ density: 12.5 t/ha
Breaking compacted topsoil
Remarks: appropriate tillage
Aligned: -contour
Vegetative material: G : grass
Vertical interval between rows / strips / blocks (m): 1.2
Spacing between rows / strips / blocks (m): 0.6x0.3
Vertical interval within rows / strips / blocks (m): 15
Width within rows / strips / blocks (m): 1.5
Scattered / dispersed
Vegetative material: T : trees / shrubs
Number of plants per (ha): 40
In blocks
Vegetative material: T : trees / shrubs
Number of plants per (ha): 124
Vertical interval between rows / strips / blocks (m): 9
Spacing between rows / strips / blocks (m): 9x9
Vertical interval within rows / strips / blocks (m): 9
Trees/ shrubs species: Cacia scamea, Accacia albida
Fruit trees / shrubs species: mango, citrus, pawpaw
Grass species: ceuchrus cuharis, erayroster superba
Slope (which determines the spacing indicated above): 8.00%
If the original slope has changed as a result of the Technology, the slope today is (see figure below): 0.00%
Gradient along the rows / strips: 0.20%
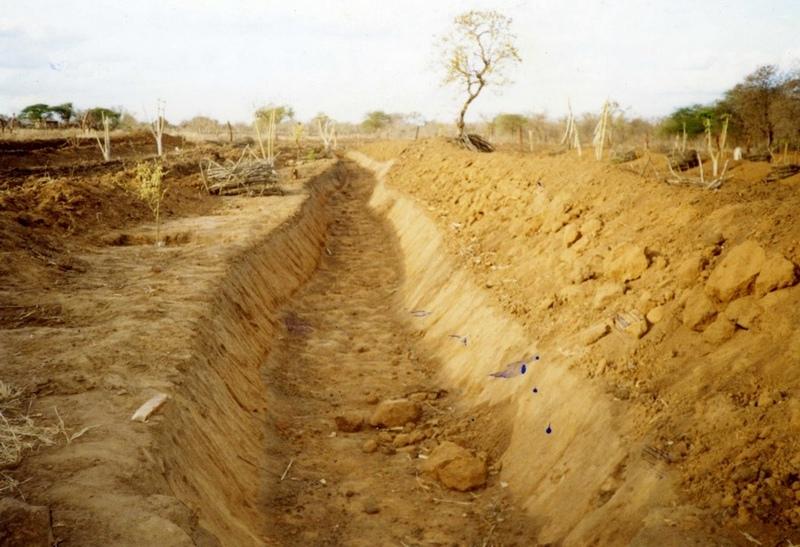
Retention/infiltration ditch/pit, sediment/sand trap
Vertical interval between structures (m): 1.2
Depth of ditches/pits/dams (m): 0.6
Width of ditches/pits/dams (m): 1.2
Length of ditches/pits/dams (m): 100
Height of bunds/banks/others (m): 0.45
Width of bunds/banks/others (m): 1.5
Terrace: bench level
Vertical interval between structures (m): 1.2
Spacing between structures (m): 15
Depth of ditches/pits/dams (m): 0.6
Length of ditches/pits/dams (m): 100
Height of bunds/banks/others (m): 0.45
Construction material (earth): earth moving for SWC embankment construction
Slope (which determines the spacing indicated above): 8%
Lateral gradient along the structure: 0.2%
Vegetation is used for stabilisation of structures.
Change of land use type: stock holding capacity of land
4.3 General information regarding the calculation of inputs and costs
Specify currency used for cost calculations:
- US Dollars
Indicate average wage cost of hired labour per day:
1.92
4.4 Establishment activities
| Activity | Type of measure | Timing | |
|---|---|---|---|
| 1. | grass planting on embankments | Vegetative | after onset of rain |
| 2. | fruits seedling transplanting | Vegetative | october rain |
| 3. | dispersed tree seedlings transplanting | Vegetative | october rain |
| 4. | retention/infiltration ditches | Structural | after crop harvest |
| 5. | Bench terraces | Structural | after crop harvest |
| 6. | external water harvest channels | Structural | before raining season |
| 7. | structure stabilization | Structural | onset of rain |
| 8. | manure/fertilizer application | Structural | after crop harvest |
| 9. | Bush clearing | Management | after grazing |
| 10. | reseeding/grass planting in bare parches | Management | dry season |
| 11. | fodder establishment | Management | rainy season |
| 12. | removal of unwanted shrubs | Management | following rotational sequence |
4.5 Costs and inputs needed for establishment
| Specify input | Unit | Quantity | Costs per Unit | Total costs per input | % of costs borne by land users | |
|---|---|---|---|---|---|---|
| Labour | Labour | ha | 1.0 | 296.0 | 296.0 | 100.0 |
| Equipment | Machine use | ha | 1.0 | 32.5 | 32.5 | 100.0 |
| Equipment | Animal traction | ha | 1.0 | 72.3 | 72.3 | 100.0 |
| Equipment | Tools | ha | 1.0 | 385.0 | 385.0 | 100.0 |
| Plant material | Seeds | ha | 1.0 | 76.3 | 76.3 | 100.0 |
| Plant material | Seedligs | ha | 1.0 | 79.5 | 79.5 | 100.0 |
| Fertilizers and biocides | Fertilizer | ha | 1.0 | 58.0 | 58.0 | 100.0 |
| Fertilizers and biocides | Biocides | ha | 1.0 | 47.4 | 47.4 | 100.0 |
| Fertilizers and biocides | Compost/manure | ha | 1.0 | 78.0 | 78.0 | 100.0 |
| Construction material | Stone | ha | 1.0 | 244.0 | 244.0 | 100.0 |
| Total costs for establishment of the Technology | 1369.0 | |||||
Comments:
Duration of establishment phase: 36 month(s)
4.6 Maintenance/ recurrent activities
| Activity | Type of measure | Timing/ frequency | |
|---|---|---|---|
| 1. | tillaging | Agronomic | before rain / annually |
| 2. | tillaging | Agronomic | on set / seasonally |
| 3. | manure application | Agronomic | dry season / annually |
| 4. | grass cutting and gapping | Vegetative | onset of rain /twice per season |
| 5. | prunning and trimming | Vegetative | after every harvest /annual |
| 6. | pollading and copsing | Vegetative | when intended /after several years |
| 7. | retention/infiltration | Structural | before onset of rain/seasonally |
| 8. | ditch cleaning | Structural | before onset of rain/anually |
| 9. | Bench terraces repairing | Structural | before onset of rain/when necessary |
| 10. | Water channel cleaning/repairing | Structural | dry period/seasonally |
| 11. | grass cutting for stall feedinf | Management | rainy season / at maturity stage |
| 12. | gapping | Management | rainy season / seasonally |
4.7 Costs and inputs needed for maintenance/ recurrent activities (per year)
| Specify input | Unit | Quantity | Costs per Unit | Total costs per input | % of costs borne by land users | |
|---|---|---|---|---|---|---|
| Labour | Labour | ha | 1.0 | 98.0 | 98.0 | 100.0 |
| Equipment | Animal traction | ha | 1.0 | 72.3 | 72.3 | 100.0 |
| Plant material | Seeds | ha | 1.0 | 67.3 | 67.3 | 100.0 |
| Plant material | Seedlings | ha | 1.0 | 55.7 | 55.7 | 100.0 |
| Fertilizers and biocides | Fertilizer | ha | 1.0 | 44.2 | 44.2 | 100.0 |
| Fertilizers and biocides | Biocides | ha | 1.0 | 21.5 | 21.5 | 100.0 |
| Construction material | Earth | ha | 1.0 | 244.0 | 244.0 | 100.0 |
| Total costs for maintenance of the Technology | 603.0 | |||||
Comments:
Machinery/ tools: oxplough, oxcart, hoe, sprayer, shovel, wheelbarrow
The above costs were calculated in cost per qm
4.8 Most important factors affecting the costs
Describe the most determinate factors affecting the costs:
Factors affecting the costs include hard ground at SWC peak period, labour, slope, catchment area, channel size and source of income
5. Natural and human environment
5.1 Climate
Annual rainfall
- < 250 mm
- 251-500 mm
- 501-750 mm
- 751-1,000 mm
- 1,001-1,500 mm
- 1,501-2,000 mm
- 2,001-3,000 mm
- 3,001-4,000 mm
- > 4,000 mm
Specify average annual rainfall (if known), in mm:
350.00
Agro-climatic zone
- semi-arid
- arid
semi-arid: LGP-70-180
arid: LGP-60-120
5.2 Topography
Slopes on average:
- flat (0-2%)
- gentle (3-5%)
- moderate (6-10%)
- rolling (11-15%)
- hilly (16-30%)
- steep (31-60%)
- very steep (>60%)
Landforms:
- plateau/plains
- ridges
- mountain slopes
- hill slopes
- footslopes
- valley floors
Altitudinal zone:
- 0-100 m a.s.l.
- 101-500 m a.s.l.
- 501-1,000 m a.s.l.
- 1,001-1,500 m a.s.l.
- 1,501-2,000 m a.s.l.
- 2,001-2,500 m a.s.l.
- 2,501-3,000 m a.s.l.
- 3,001-4,000 m a.s.l.
- > 4,000 m a.s.l.
Comments and further specifications on topography:
Altitudinal zone: about 1000 m a.s.l. average
Landforms: Footslopes 8-16% slope and valley floors 2-8% slope
Slopes on average: Moderate = 6.5 % and rolling = 12 %
5.3 Soils
Soil depth on average:
- very shallow (0-20 cm)
- shallow (21-50 cm)
- moderately deep (51-80 cm)
- deep (81-120 cm)
- very deep (> 120 cm)
Soil texture (topsoil):
- coarse/ light (sandy)
- medium (loamy, silty)
Topsoil organic matter:
- medium (1-3%)
- low (<1%)
If available, attach full soil description or specify the available information, e.g. soil type, soil PH/ acidity, Cation Exchange Capacity, nitrogen, salinity etc.
Soil depth on average: shallow = 35 cm average and moderately deep = 65 cm average
Soil texture: Coarse/light = degradable/erodable and medium is common in the division
Soil fertility is medium in newly opened lands but fertility depletes quickly and is therefore also low.
Topsoil organic matter is medium on newly opened land and low after several years of cultivation.
Soil drainage / infiltration is medium with regular improvement, but there is also top soil crusting and therefore drainage becomes poor,
Soil water storage capacity is low during long duration of rainfall intervals and medium (effectiveness not realistic).
5.6 Characteristics of land users applying the Technology
Market orientation of production system:
- mixed (subsistence/ commercial
Off-farm income:
- 10-50% of all income
Relative level of wealth:
- poor
- average
Level of mechanization:
- manual work
- animal traction
Indicate other relevant characteristics of the land users:
Population density: 50-100 persons/km2
Annual population growth: 3% - 4%
20% of the land users are rich and own 20% of the land (prestige).
35% of the land users are average wealthy and own 30% of the land (improved living standard).
25% of the land users are poor and own 20% of the land (for subsistance).
Off-farm income specification: Most of youth seek for off-farm employment. Others due to lack of employment engage on trading as small holders.
Level of mechanization: Around 75 % use animal traction and manual labour is especially used for weeding
5.7 Average area of land owned or leased by land users applying the Technology
- < 0.5 ha
- 0.5-1 ha
- 1-2 ha
- 2-5 ha
- 5-15 ha
- 15-50 ha
- 50-100 ha
- 100-500 ha
- 500-1,000 ha
- 1,000-10,000 ha
- > 10,000 ha
Comments:
Average area of land owned or leased by land users applying the Technology: Also 0.5-1 ha
5.8 Land ownership, land use rights, and water use rights
Land ownership:
- individual, not titled
- individual, titled
Land use rights:
- individual
6. Impacts and concluding statements
6.1 On-site impacts the Technology has shown
Socio-economic impacts
Production
crop production
Comments/ specify:
Extra output 50%
production area
Comments/ specify:
given area reduced by 14%
Income and costs
farm income
Comments/ specify:
Extra income 27.5%
workload
Comments/ specify:
requires high labour costs
Socio-cultural impacts
community institutions
Comments/ specify:
in capacity building
SLM/ land degradation knowledge
Comments/ specify:
to land user
Ecological impacts
Water cycle/ runoff
surface runoff
Quantity before SLM:
32
Quantity after SLM:
14
excess water drainage
Comments/ specify:
risking occasion
Soil
soil moisture
Comments/ specify:
external WH.
soil loss
Quantity before SLM:
20
Quantity after SLM:
10
Comments/ specify:
WH combination
6.2 Off-site impacts the Technology has shown
reliable and stable stream flows in dry season
Comments/ specify:
irrigation potential reduced
downstream flooding
Comments/ specify:
rainfall runoff trapped
downstream siltation
Comments/ specify:
silt retained on cropland
6.4 Cost-benefit analysis
How do the benefits compare with the establishment costs (from land users’ perspective)?
Long-term returns:
positive
How do the benefits compare with the maintenance/ recurrent costs (from land users' perspective)?
Short-term returns:
very positive
6.5 Adoption of the Technology
- 1-10%
If available, quantify (no. of households and/ or area covered):
630 household covered an area of 9%
Of all those who have adopted the Technology, how many have did so spontaneously, i.e. without receiving any material incentives/ payments?
- 90-100%
Comments:
630 land user families have adopted the Technology without any external material support
Comments on spontaneous adoption: estimates
There is a moderate trend towards spontaneous adoption of the Technology
Comments on adoption trend: Pressure on daily personal needs. No other sources of income yet the rainfall is not reliable in ASALS.
6.7 Strengths/ advantages/ opportunities of the Technology
| Strengths/ advantages/ opportunities in the land user’s view |
|---|
|
induces the technique of implementation How can they be sustained / enhanced? land users be aquidance with the technology and its importance. |
|
land users acquires more grass for stall feeding. How can they be sustained / enhanced? introduction of intensive grazing system. |
|
reduces floods of heavy storms downsteram. How can they be sustained / enhanced? Proper tillage to curb soil crusting and hardban. |
| Strengths/ advantages/ opportunities in the compiler’s or other key resource person’s view |
|---|
|
water harvest increases farm production and reduces risks of crop failure. How can they be sustained / enhanced? To stabilize SWC structure embankments, desilt channels and retention ditches. |
|
Improvement in infiltration rate and moisture holding capacity. How can they be sustained / enhanced? Use of manure, organic matter, inorganic fertlizer and appropriate tillage. |
|
Reduces soil, fertility, runoff and overland flow losses How can they be sustained / enhanced? Maximum adaptability of the SWC technology to ustain high production level. |
|
Enhanced vegetative cover for moisture retention. How can they be sustained / enhanced? Intercropping, mulching and repairing where needed. |
|
Reduces erosion by wind and other land degradation. How can they be sustained / enhanced? Appropriate stocking rate andd replanting trees and grass. |
6.8 Weaknesses/ disadvantages/ risks of the Technology and ways of overcoming them
| Weaknesses/ disadvantages/ risks in the land user’s view | How can they be overcome? |
|---|---|
| consumes a lot of time to implement the technology | the land user awareness of the importance of the activity. |
| Technology area resists a direct grazing | to mitiate stall feeding |
| the technology design is beyond the farmers knowledge. | continuous interaction with SWC specialists. |
| Weaknesses/ disadvantages/ risks in the compiler’s or other key resource person’s view | How can they be overcome? |
|---|---|
| Land area reduced by SWC structures constructed. | Use of certified seeds, manure and fertilizer. |
| soil fertility is interfered with. | more manure and organic matter use. |
| High labour cost requirement to implement the technology. | Introduced source of smooth loan and policy for ASALS. |
| Risk of water logging where soil drainage is unaimable. | acquired knowledge of different soil types and applicable technology and system. |
| cost-benefit return can last long to be realized. | to maintain record for both, implementing cost and income from the given area (SWC area) |
7. References and links
7.2 References to available publications
Title, author, year, ISBN:
SWC manual for Kenya by D:B: Thomas. 1997.
Available from where? Costs?
Mard Kenya, free
Title, author, year, ISBN:
SWC technology Dev. in ASAL by Kithinji Mutunga
Available from where? Costs?
SWC branch, free
Title, author, year, ISBN:
SC in Kenya, Carl G.Wenner. 1984.
Available from where? Costs?
Aici, free
Title, author, year, ISBN:
ony superb DXE-180 video
Available from where? Costs?
Mard Kenya, free
Title, author, year, ISBN:
The sun will still rise
Available from where? Costs?
Mard Kenya, free
Title, author, year, ISBN:
Run off a friend or a foe
Available from where? Costs?
Mard Kenya, free
Links and modules
Expand all Collapse allLinks
No links
Modules
No modules