Implementing the ecological monitoring of locally managed sylvo-pastoral resources – Vegetation cover index [Mauritania]
- Creation:
- Update:
- Compiler: Karl-Peter KIRSCH-JUNG
- Editor: –
- Reviewers: Joana Eichenberger, Rima Mekdaschi Studer, Simone Verzandvoort, Donia Mühlematter, Alexandra Gavilano
ICV
technologies_2081 - Mauritania
- Full summary as PDF
- Full summary as PDF for print
- Full summary in the browser
- Full summary (unformatted)
- Implementing the ecological monitoring of locally managed sylvo-pastoral resources – Vegetation cover index : May 28, 2019 (inactive)
- Implementing the ecological monitoring of locally managed sylvo-pastoral resources – Vegetation cover index : Oct. 15, 2018 (inactive)
- Implementing the ecological monitoring of locally managed sylvo-pastoral resources – Vegetation cover index : July 19, 2018 (inactive)
- Implementing the ecological monitoring of locally managed sylvo-pastoral resources – Vegetation cover index : July 19, 2018 (inactive)
- Implementing the ecological monitoring of locally managed sylvo-pastoral resources – Vegetation cover index : May 13, 2018 (inactive)
- Implementing the ecological monitoring of locally managed sylvo-pastoral resources – Vegetation cover index: Nov. 2, 2021 (public)
- Implementing the ecological monitoring of locally managed sylvo-pastoral resources – Vegetation cover index: Nov. 2, 2021 (inactive)
- Implementing the ecological monitoring of locally managed sylvo-pastoral resources – Vegetation cover index : May 31, 2018 (inactive)
- Implementing the ecological monitoring of locally managed sylvo-pastoral resources – Vegetation cover index : May 31, 2018 (inactive)
- Implementing the ecological monitoring of locally managed sylvo-pastoral resources – Vegetation cover index : May 16, 2018 (inactive)
- Implementing the ecological monitoring of locally managed sylvo-pastoral resources – Vegetation cover index : May 13, 2018 (inactive)
- Mise en place d'un suivi écologique de la gestion locale des ressources sylvo-pastorales - Indice du couvert végétal: Feb. 16, 2018 (inactive)
View sections
Expand all Collapse all1. General information
1.2 Contact details of resource persons and institutions involved in the assessment and documentation of the Technology
SLM specialist:
Khour Dah ould
Advice Unit for Development Support (UCAD-Conseil)
Mauritania
Name of project which facilitated the documentation/ evaluation of the Technology (if relevant)
Programme Gestion des Ressources Naturelles, Mauretanie (ProGRN)Name of project which facilitated the documentation/ evaluation of the Technology (if relevant)
Book project: Guidelines to Rangeland Management in Sub-Saharan Africa (Rangeland Management)Name of the institution(s) which facilitated the documentation/ evaluation of the Technology (if relevant)
Deutsche Gesellschaft für Internationale Zusammenarbeit (GIZ) GmbH (GIZ) - Germany1.3 Conditions regarding the use of data documented through WOCAT
The compiler and key resource person(s) accept the conditions regarding the use of data documented through WOCAT:
Yes
1.4 Declaration on sustainability of the described Technology
Is the Technology described here problematic with regard to land degradation, so that it cannot be declared a sustainable land management technology?
No
1.5 Reference to Questionnaire(s) on SLM Approaches (documented using WOCAT)
Gestion locale collective des ressources naturelles [Mauritania]
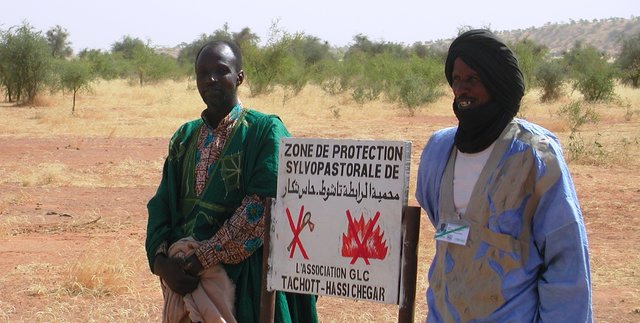
Un transfert de responsabilité de gestion des ressources sylvo-pastorales de l'Etat aux associations des usagers. L'élaboration concertée d'une convention locale définissant les règles de gestion, notamment les conditions d'accès, d'utilisation et de contrôle des ressources partagées dans l'espace retenue. La mise en œuvre de la convention par un système de …
- Compiler: Karl-Peter KIRSCH-JUNG
2. Description of the SLM Technology
2.1 Short description of the Technology
Definition of the Technology:
A system for ecological monitoring provides accurate observations on the development of sylvo-pastoral resources, the management of which is handed over to land users who are organized in a local association. In order to monitor the ecological status of the land, a method to record the Vegetation Cover Index (VCI) was developed to register changes compared with an initial survey.
2.2 Detailed description of the Technology
Description:
Ecological monitoring, based on the index of vegetation cover, is a suitable technology for the following purposes: (a) to check to which degree the objective to mitigate land degradation is achieved; (b) to provide authorities with a tool to assess sustainable land management; (c) to increase the transparency of the procedure to assess efforts from land users to protect the environment; (d) to implement corrective measures through specific management regimes (for instance prohibition on grazing); (e) to assess changes in income at the level of individual households, at the level of areas which are managed collectively, or at the level of the entire intervention zone; (f) to monitor the carbon stocks of woody vegetation.
The vegetation cover is therefore the target variable of the technology. The main components of the vegetation cover are described, which are the cover of woody and herbaceous vegetation. The woody vegetation cover consists of three sub-strata: the tree cover, the cover of regenerating trees and the shrub cover. Each of these strata is assessed in square meters (m2) below the top of the woody plants. The total of the three strata of woody vegetation provides the indicator of the woody vegetation cover. The herbaceous cover is indirectly assessed through the extent of soil surfaces which are clearly without vegetation (crusts, hard pans or glacis slopes). Furthermore, the diversity of woody species is considered through an indicator. The three indicators are weighted to obtain the Vegetation Cover Index (VCI).
The vegetation cover varies in space. The following major zones are distinguished: savannah with vegetation ranging from shrubs to woody vegetation (C), forested savannah (S), wooded mountainous savannah (M), forest galleries or wet zones (G). As part of the ecological monitoring, the development of the Vegetation Cover Index (VCI), calculated for the four zones (C, S, M and G) of an area, is compared with the development of the VCI in a control area. The control area represents the ecological state of a shrubland to which the rules for the management of natural resources, which are adopted in the Local Convention or in special arrangements, are not applied. The control area consists of equal parts of the four ecological zones (C, G, M and S).
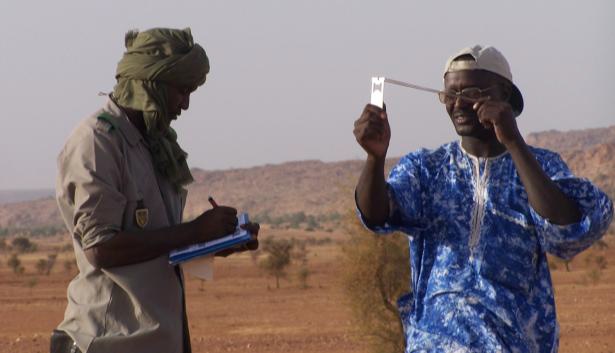
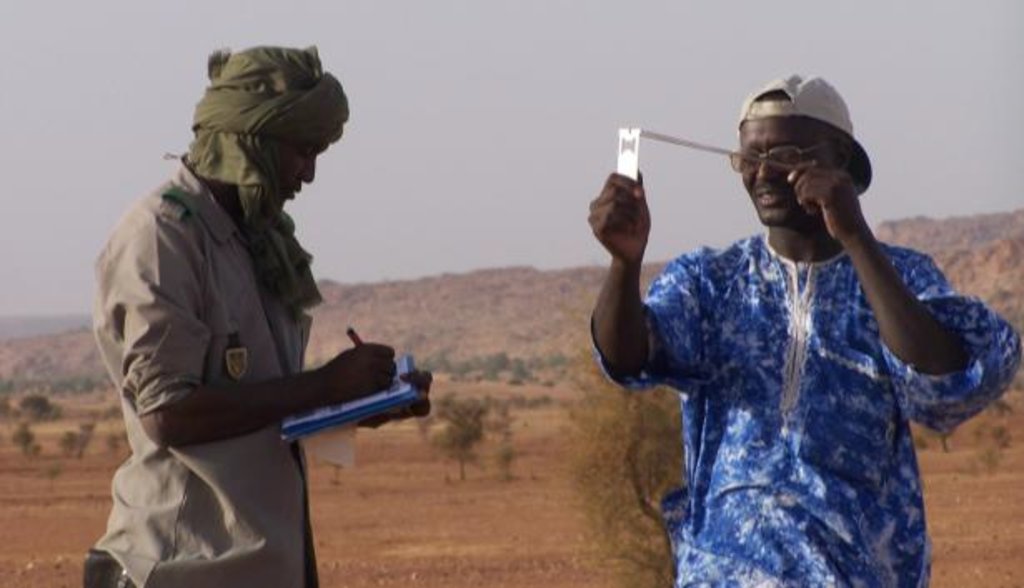
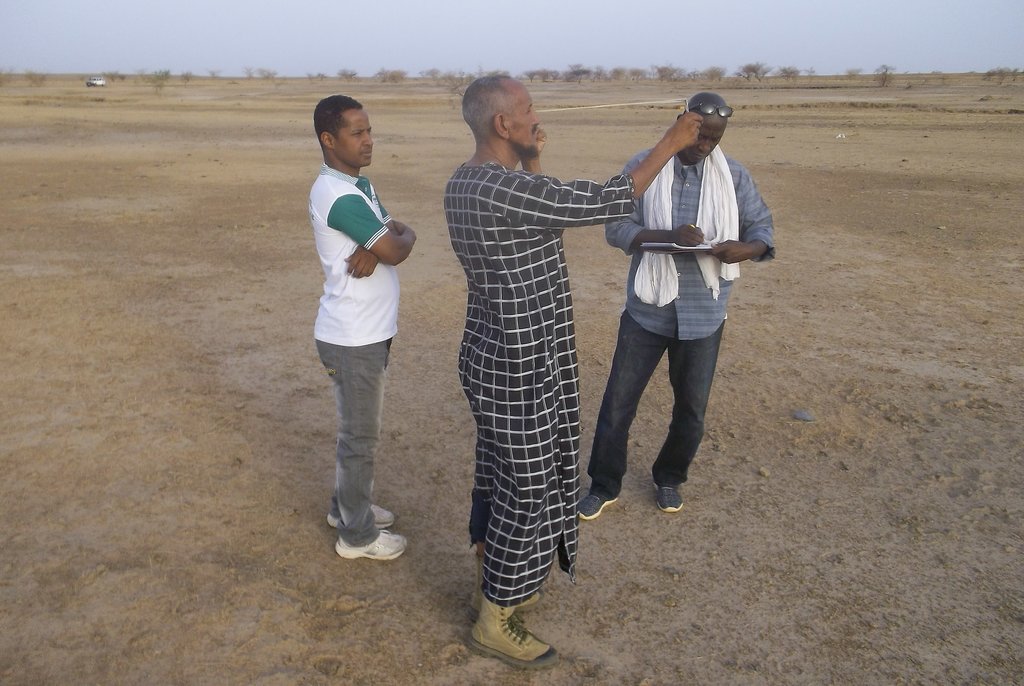
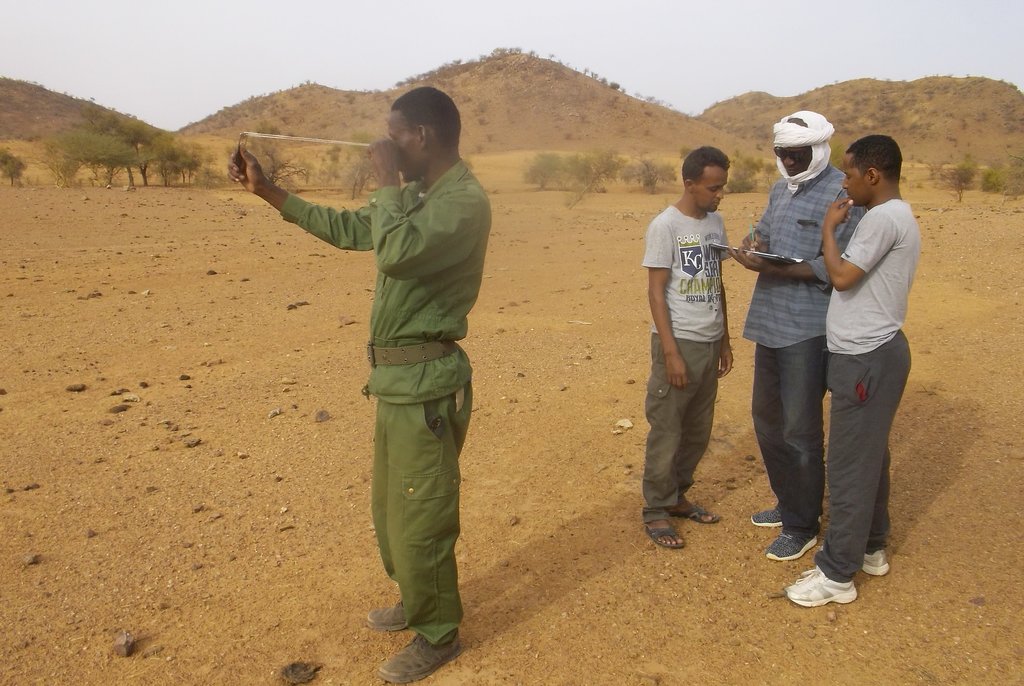
Fixed plots for observation are selected once, in such a way that all zones in the target area are represented. The first surveys are done after the area managed by a Collective Local Management Organisation (AGLC) has been demarcated. The monitoring is carried out annually or every two years by teams consisting of three parties: a State agent (a forester), a member of the AGLC and a technician of ProGLN. The surveys in the control area are carried out simultaneously with the surveys in the areas of the AGLC. The data are processed manually in the survey forms. The baseline of the Vegetation Cover Index (VCI) is 100. This value represents the ecological status of the control area. The comparison of the development of the VCI in an area of an AGLC to the VCI of the control area refers to the same period of monitoring. The average change of the Vegetation Cover Index (VCI) in the area of Guidimakha amounted to 2,24 (from 100 to 102,24) in the period from 2004 to 2011. This indicates that the condition of the natural resources has improved overall in the areas which are managed by the local organizations through a local convention. The average increase of the VCI is in the order of magnitude of 0.55 units per year.
2.3 Photos of the Technology
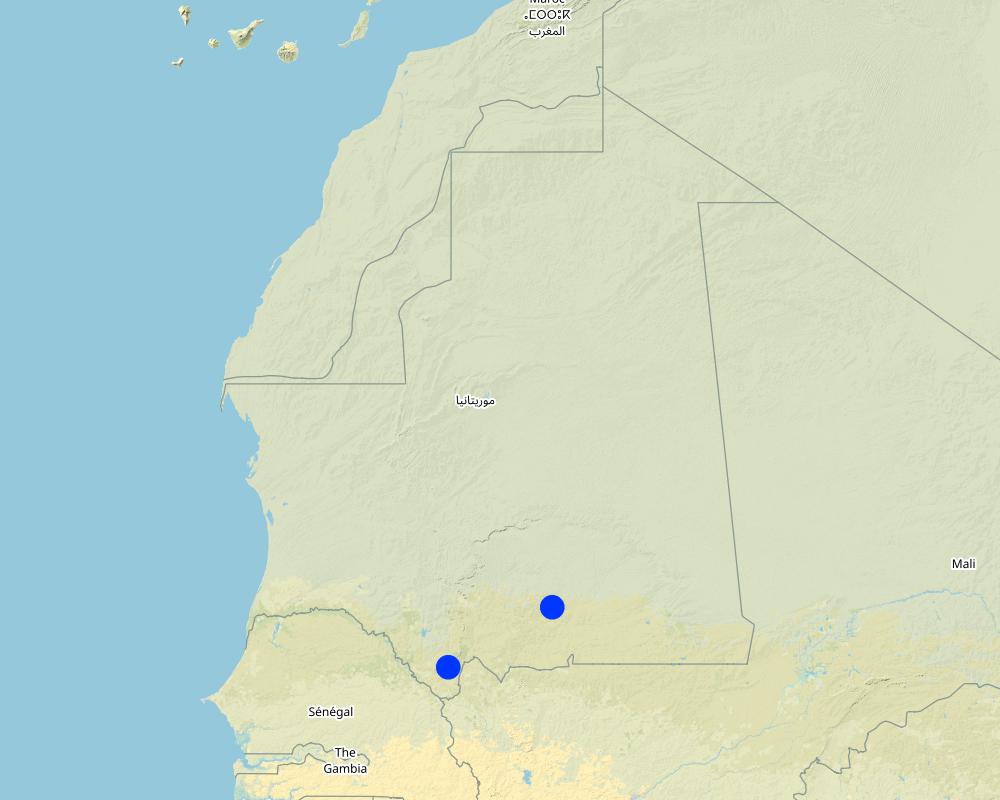
2.5 Country/ region/ locations where the Technology has been applied and which are covered by this assessment
Country:
Mauritania
Region/ State/ Province:
Regions of Guidimakha and Hodh El Gharbi
Specify the spread of the Technology:
- evenly spread over an area
If the Technology is evenly spread over an area, specify area covered (in km2):
7000.0
If precise area is not known, indicate approximate area covered:
- > 10,000 km2
Comments:
7.000 km2 in the region of Guidimakha (coverage 61%), the main drinking water points for livestock on the three axes of transhumance in Hodh El Gharbi.
Map
×2.6 Date of implementation
Indicate year of implementation:
2004
2.7 Introduction of the Technology
Specify how the Technology was introduced:
- through projects/ external interventions
3. Classification of the SLM Technology
3.1 Main purpose(s) of the Technology
- assessment of the restoration of natural resources
3.2 Current land use type(s) where the Technology is applied
Land use mixed within the same land unit:
Yes
Specify mixed land use (crops/ grazing/ trees):
- Silvo-pastoralism

Grazing land
Extensive grazing:
- Transhumant pastoralism

Forest/ woodlands
Comments:
Number of growing seasons per year: 1
Livestock density: Changing between the seasons due to transhumance. On average, 2.9 hectares per tropical livestock unit (TLU).
3.3 Has land use changed due to the implementation of the Technology?
Has land use changed due to the implementation of the Technology?
- No (Continue with question 3.4)
3.4 Water supply
Water supply for the land on which the Technology is applied:
- rainfed
3.5 SLM group to which the Technology belongs
- natural and semi-natural forest management
- pastoralism and grazing land management
- improved ground/ vegetation cover
3.6 SLM measures comprising the Technology

management measures
- M2: Change of management/ intensity level
3.7 Main types of land degradation addressed by the Technology

biological degradation
- Bc: reduction of vegetation cover
- Bq: quantity/ biomass decline
- Bf: detrimental effects of fires
3.8 Prevention, reduction, or restoration of land degradation
Specify the goal of the Technology with regard to land degradation:
- not applicable
Comments:
The technology enables to assess the prevention and reduction of land degradation.
4. Technical specifications, implementation activities, inputs, and costs
4.1 Technical drawing of the Technology
Technical specifications (related to technical drawing):
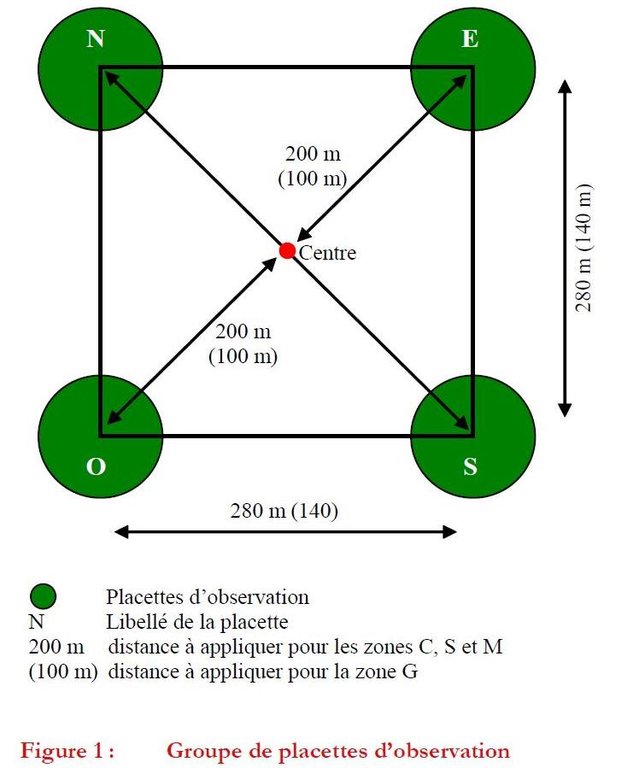
Fixed plots for observation are selected once in such a way that all zones in the target area are represented. Concentrating the field work in space by handling groups of plots saves labour time. A group of plots consists of four plots. The four plots in a group are located at 200 m (zones S, C, M) from a fixed point in the center (see the technical drawing). The plots are positioned at the north, east, south and west respectively of the fixed central point.
In general, due to the limited surface area of the forest galleries or wet zones, the distance between the plots should be modified, and is therefore fixed at 100 m. The total number of observation plots for the control area is 64, or 16 groups of 4 plots. The 16 groups are distributed evenly over the four ecological zones C, G, M and S (four groups per zone). As for the control area, the total number of plots in each area of an AGLC is fixed at 64. The number of groups per ecological zone is proportional to the fraction of the surface area of the zone in the total area.
Author:
Frank Richter
Date:
14/06/2011
4.2 General information regarding the calculation of inputs and costs
Specify currency used for cost calculations:
- USD
other/ national currency (specify):
UM
If relevant, indicate exchange rate from USD to local currency (e.g. 1 USD = 79.9 Brazilian Real): 1 USD =:
365.0
Indicate average wage cost of hired labour per day:
5
4.3 Establishment activities
Comments:
The time required for the field surveys, including the manual processing of the data, for a team of three persons varies between 3 and 5 days per area of an AGLC, depending on the distance from the area and the extent of the vegetation cover, particularly of the forest galleries. When the data are processed and analysed by computer, an extra half day is needed for an AGLC area. The costs of implementing the ecological monitoring are between 200 and 310 US$ per area and per annual survey. For the total extent of the areas managed by AGLCs in Guidimakha and Hodh el Gharbi (37 organisations), over a period of ten years and with three surveys per area, the costs are estimated at 25.000 to 30.000 US$.
4.4 Costs and inputs needed for establishment
| Specify input | Unit | Quantity | Costs per Unit | Total costs per input | % of costs borne by land users | |
|---|---|---|---|---|---|---|
| Labour | hommes/jours | |||||
| Labour | homme/jours | |||||
| Labour | hommes/jours |
If you are unable to break down the costs in the table above, give an estimation of the total costs of establishing the Technology:
250.0
If land user bore less than 100% of costs, indicate who covered the remaining costs:
Regional service of the Ministry of Environment and GIZ
Comments:
The implementation costs of the ecological monitoring are between 200 and 310 US$ per area and per survey. For the total extent of the areas managed by AGLCs in Guidimakha and Hodh el Gharbi (37 organisations), over a period of ten years and with three surveys per area, the costs are estimated at 25.000 to 30.000 US$.
4.5 Maintenance/ recurrent activities
| Activity | Timing/ frequency | |
|---|---|---|
| 1. | field surveys | |
| 2. | manual data processing | |
| 3. | computer analysis |
Comments:
The survey of the Vegetation Cover Index (VCI) is done once a year or once in two years.
4.6 Costs and inputs needed for maintenance/ recurrent activities (per year)
| Specify input | Unit | Quantity | Costs per Unit | Total costs per input | % of costs borne by land users | |
|---|---|---|---|---|---|---|
| Labour | field surveys | person-days | 6.0 | 20.0 | 120.0 | 30.0 |
| Labour | manual data processing | person-days | 3.0 | 30.0 | 90.0 | 15.0 |
| Labour | computer analysis | person-days | 1.0 | 40.0 | 40.0 | |
| Total costs for maintenance of the Technology | 250.0 | |||||
| Total costs for maintenance of the Technology in USD | 0.68 | |||||
If land user bore less than 100% of costs, indicate who covered the remaining costs:
Regional service of the Ministry of Environment and GIZ
Comments:
The implementation costs of the ecological monitoring are between 200 and 310 US$ per area and per annual survey. For the total extent of the areas managed by AGLCs in Guidimakha and Hodh el Gharbi (37 organisations), over a period of ten years and with three surveys per area, the costs are estimated at 25.000 to 30.000 US$.
4.7 Most important factors affecting the costs
Describe the most determinate factors affecting the costs:
labour costs
5. Natural and human environment
5.1 Climate
Annual rainfall
- < 250 mm
- 251-500 mm
- 501-750 mm
- 751-1,000 mm
- 1,001-1,500 mm
- 1,501-2,000 mm
- 2,001-3,000 mm
- 3,001-4,000 mm
- > 4,000 mm
Indicate the name of the reference meteorological station considered:
Sélibaby and Ajoun El Atrous
Agro-climatic zone
- semi-arid
5.2 Topography
Slopes on average:
- flat (0-2%)
- gentle (3-5%)
- moderate (6-10%)
- rolling (11-15%)
- hilly (16-30%)
- steep (31-60%)
- very steep (>60%)
Landforms:
- plateau/plains
- ridges
- mountain slopes
- hill slopes
- footslopes
- valley floors
Altitudinal zone:
- 0-100 m a.s.l.
- 101-500 m a.s.l.
- 501-1,000 m a.s.l.
- 1,001-1,500 m a.s.l.
- 1,501-2,000 m a.s.l.
- 2,001-2,500 m a.s.l.
- 2,501-3,000 m a.s.l.
- 3,001-4,000 m a.s.l.
- > 4,000 m a.s.l.
Indicate if the Technology is specifically applied in:
- not relevant
5.3 Soils
Soil depth on average:
- very shallow (0-20 cm)
- shallow (21-50 cm)
- moderately deep (51-80 cm)
- deep (81-120 cm)
- very deep (> 120 cm)
Soil texture (topsoil):
- coarse/ light (sandy)
Soil texture (> 20 cm below surface):
- coarse/ light (sandy)
Topsoil organic matter:
- low (<1%)
5.4 Water availability and quality
Ground water table:
> 50 m
Is water salinity a problem?
No
Is flooding of the area occurring?
No
5.5 Biodiversity
Species diversity:
- low
Habitat diversity:
- low
5.6 Characteristics of land users applying the Technology
Sedentary or nomadic:
- Sedentary
- Semi-nomadic
Relative level of wealth:
- poor
Gender:
- women
- men
Age of land users:
- middle-aged
5.7 Average area of land used by land users applying the Technology
- < 0.5 ha
- 0.5-1 ha
- 1-2 ha
- 2-5 ha
- 5-15 ha
- 15-50 ha
- 50-100 ha
- 100-500 ha
- 500-1,000 ha
- 1,000-10,000 ha
- > 10,000 ha
Is this considered small-, medium- or large-scale (referring to local context)?
- large-scale
Comments:
The VCI is applied on communal land, which is owned by the state. Land use rights are communal.
5.8 Land ownership, land use rights, and water use rights
Land ownership:
- state
Land use rights:
- communal (organized)
Water use rights:
- communal (organized)
5.9 Access to services and infrastructure
health:
- poor
- moderate
- good
education:
- poor
- moderate
- good
technical assistance:
- poor
- moderate
- good
employment (e.g. off-farm):
- poor
- moderate
- good
markets:
- poor
- moderate
- good
energy:
- poor
- moderate
- good
roads and transport:
- poor
- moderate
- good
drinking water and sanitation:
- poor
- moderate
- good
financial services:
- poor
- moderate
- good
6. Impacts and concluding statements
6.1 On-site impacts the Technology has shown
Socio-economic impacts
Other socio-economic impacts
confidence entre usagers
Quantity after SLM:
0
Socio-cultural impacts
SLM/ land degradation knowledge
Quantity before SLM:
-3
Quantity after SLM:
3
Comments/ specify:
The discussion of the monitoring results in the General Assemblies contributes to building knowledge on SLM and land degradation.
conflict mitigation
Quantity before SLM:
-3
Quantity after SLM:
2
Comments/ specify:
The results of the monitoring are used in the mitigation of conflicts.
6.4 Cost-benefit analysis
How do the benefits compare with the establishment costs (from land users’ perspective)?
Short-term returns:
neutral/ balanced
Long-term returns:
positive
How do the benefits compare with the maintenance/ recurrent costs (from land users' perspective)?
Short-term returns:
neutral/ balanced
Long-term returns:
positive
6.5 Adoption of the Technology
- 11-50%
If available, quantify (no. of households and/ or area covered):
All the areas managed by the Collective Local Management Organisations in the two provinces apply the monitoring.
Of all those who have adopted the Technology, how many did so spontaneously, i.e. without receiving any material incentives/ payments?
- 0-10%
Comments:
The ecological monitoring is a sovereign task, and therefore is a service of the State.
6.6 Adaptation
Has the Technology been modified recently to adapt to changing conditions?
No
6.7 Strengths/ advantages/ opportunities of the Technology
| Strengths/ advantages/ opportunities in the land user’s view |
|---|
| To improve the transparency for land users of the procedure to assess their efforts to manage sylvo-pastoral resources sustainably through their compliance with the rules of the local convention. |
| Strengths/ advantages/ opportunities in the compiler’s or other key resource person’s view |
|---|
| Enabling supporting organisations to check to what extent the objective to mitigate land degradation is achieved, based on indicators of impact. |
| Provides information to apply and refine the rules for land management and specific arrangements (for instance the prohibition on grazing). |
6.8 Weaknesses/ disadvantages/ risks of the Technology and ways of overcoming them
| Weaknesses/ disadvantages/ risks in the land user’s view | How can they be overcome? |
|---|---|
| Dependency of local organisations on the technical services due to the sovereign nature of these. | not possible |
| Weaknesses/ disadvantages/ risks in the compiler’s or other key resource person’s view | How can they be overcome? |
|---|---|
| The resources of the technical services for an annual survey are limited. | A frequency of once in five years could be justified, given that the impact of the sustainable land management will only be visible after that period. |
7. References and links
7.1 Methods/ sources of information
- interviews with SLM specialists/ experts
15 persons interviewed
- compilation from reports and other existing documentation
Annual reports with the VCI
When were the data compiled (in the field)?
10/03/2017
7.2 References to available publications
Title, author, year, ISBN:
Mise en place d'un suivi écologique de la gestion locale des ressources sylvopastorales - Indice du couvert végétal, ProGRN, 2011
Available from where? Costs?
https://wocatpedia.net/wiki/Indice_du_couvert_v%C3%A9g%C3%A9tal_-_Suivi_%C3%A9cologique_de_la_gestion_d%C3%A9centralis%C3%A9e_des_ressources_sylvo-pastorales_en_Mauritanie
7.3 Links to relevant online information
Title/ description:
Indice du couvert végétal, Fiche thématique N° 1, ProGRN, 2011
URL:
patienter
Links and modules
Expand all Collapse allLinks

Gestion locale collective des ressources naturelles [Mauritania]
Un transfert de responsabilité de gestion des ressources sylvo-pastorales de l'Etat aux associations des usagers. L'élaboration concertée d'une convention locale définissant les règles de gestion, notamment les conditions d'accès, d'utilisation et de contrôle des ressources partagées dans l'espace retenue. La mise en œuvre de la convention par un système de …
- Compiler: Karl-Peter KIRSCH-JUNG
Modules
No modules


