Social Tenure Domain Model (STDM) [Kenya]
- Creation:
- Update:
- Compiler: Ken Otieno
- Editor: –
- Reviewers: Donia Mühlematter, Hanspeter Liniger, Barbara *, Alexandra Gavilano
STDM
technologies_3318 - Kenya
- Full summary as PDF
- Full summary as PDF for print
- Full summary in the browser
- Full summary (unformatted)
- Social Tenure Domain Model (STDM): July 5, 2018 (inactive)
- Social Tenure Domain Model (STDM): May 7, 2019 (public)
- Social Tenure Domain Model (STDM): June 28, 2018 (inactive)
- Social Tenure Domain Model (STDM): June 4, 2018 (inactive)
- Social Tenure Domain Model (STDM): May 19, 2018 (inactive)
- Social Tenure Domain Model (STDM): March 5, 2018 (inactive)
View sections
Expand all Collapse all1. General information
1.2 Contact details of resource persons and institutions involved in the assessment and documentation of the Technology
Name of project which facilitated the documentation/ evaluation of the Technology (if relevant)
Book project: Guidelines to Rangeland Management in Sub-Saharan Africa (Rangeland Management)1.3 Conditions regarding the use of data documented through WOCAT
The compiler and key resource person(s) accept the conditions regarding the use of data documented through WOCAT:
Yes
1.4 Declaration on sustainability of the described Technology
Is the Technology described here problematic with regard to land degradation, so that it cannot be declared a sustainable land management technology?
No
Comments:
The technology has demonstrated SLM.
2. Description of the SLM Technology
2.1 Short description of the Technology
Definition of the Technology:
The Social Tenure Domain Model (STDM) is about people and their relationships with land. The tool as applied secures tenure through the recognition of tenure diversity and social contexts. In the management of land and resources use, STDM facilitates proper land use and management to minimize practices that lead to degradation.
2.2 Detailed description of the Technology
Description:
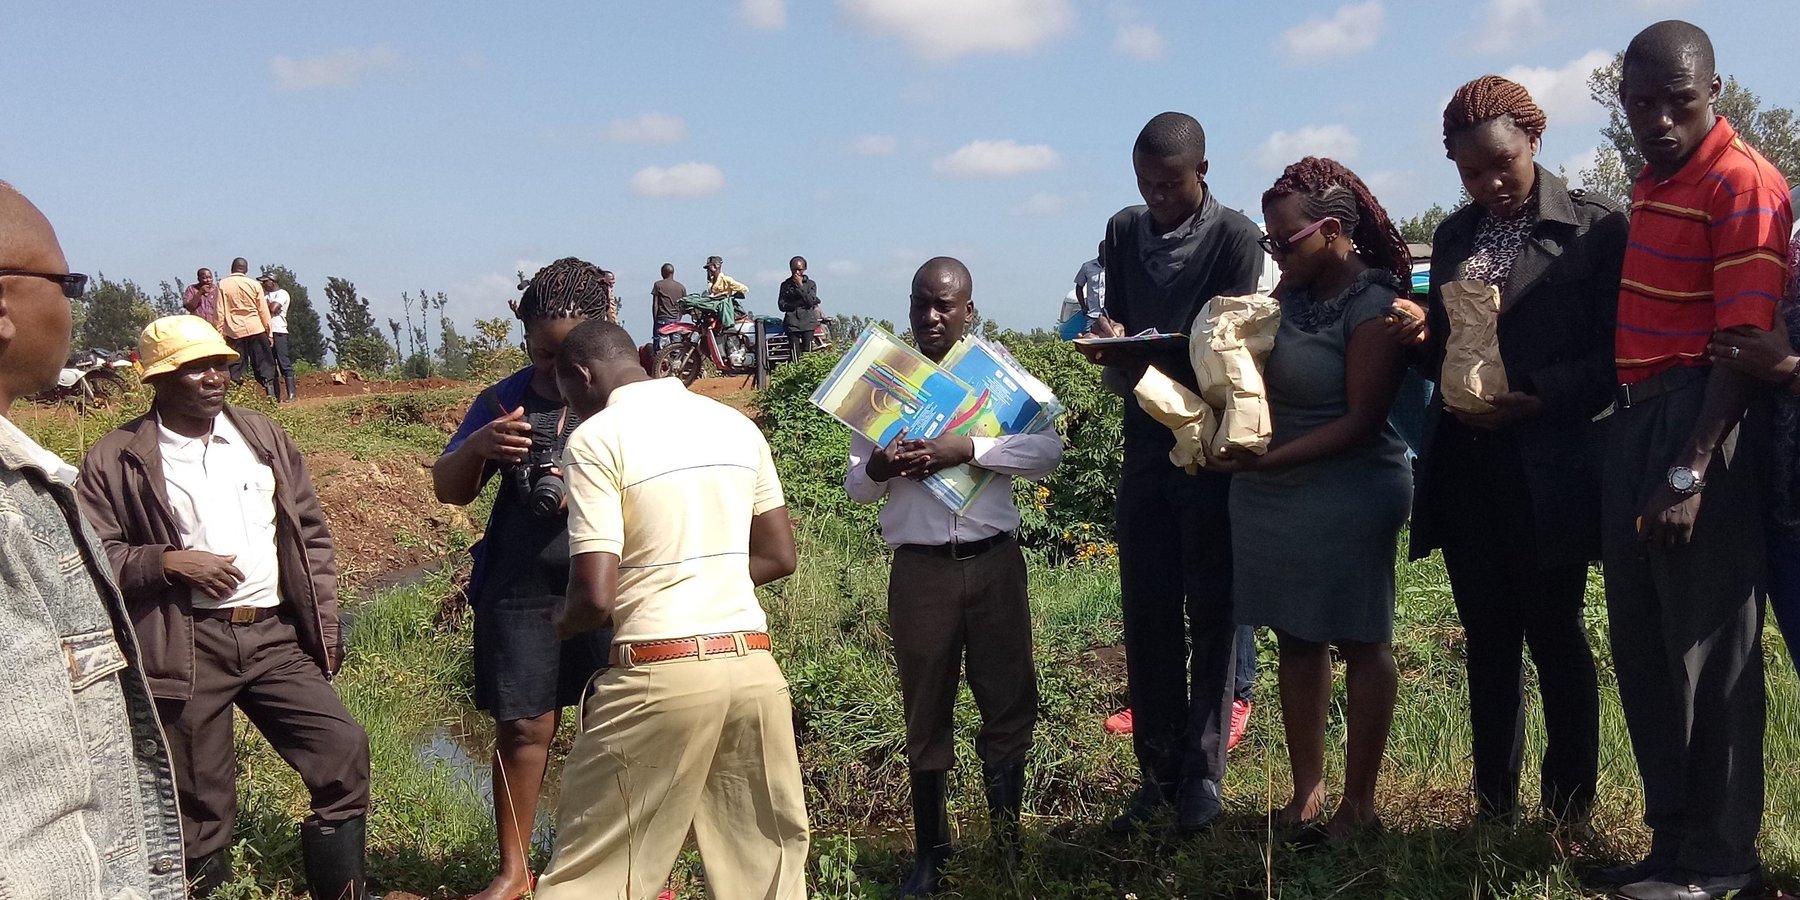
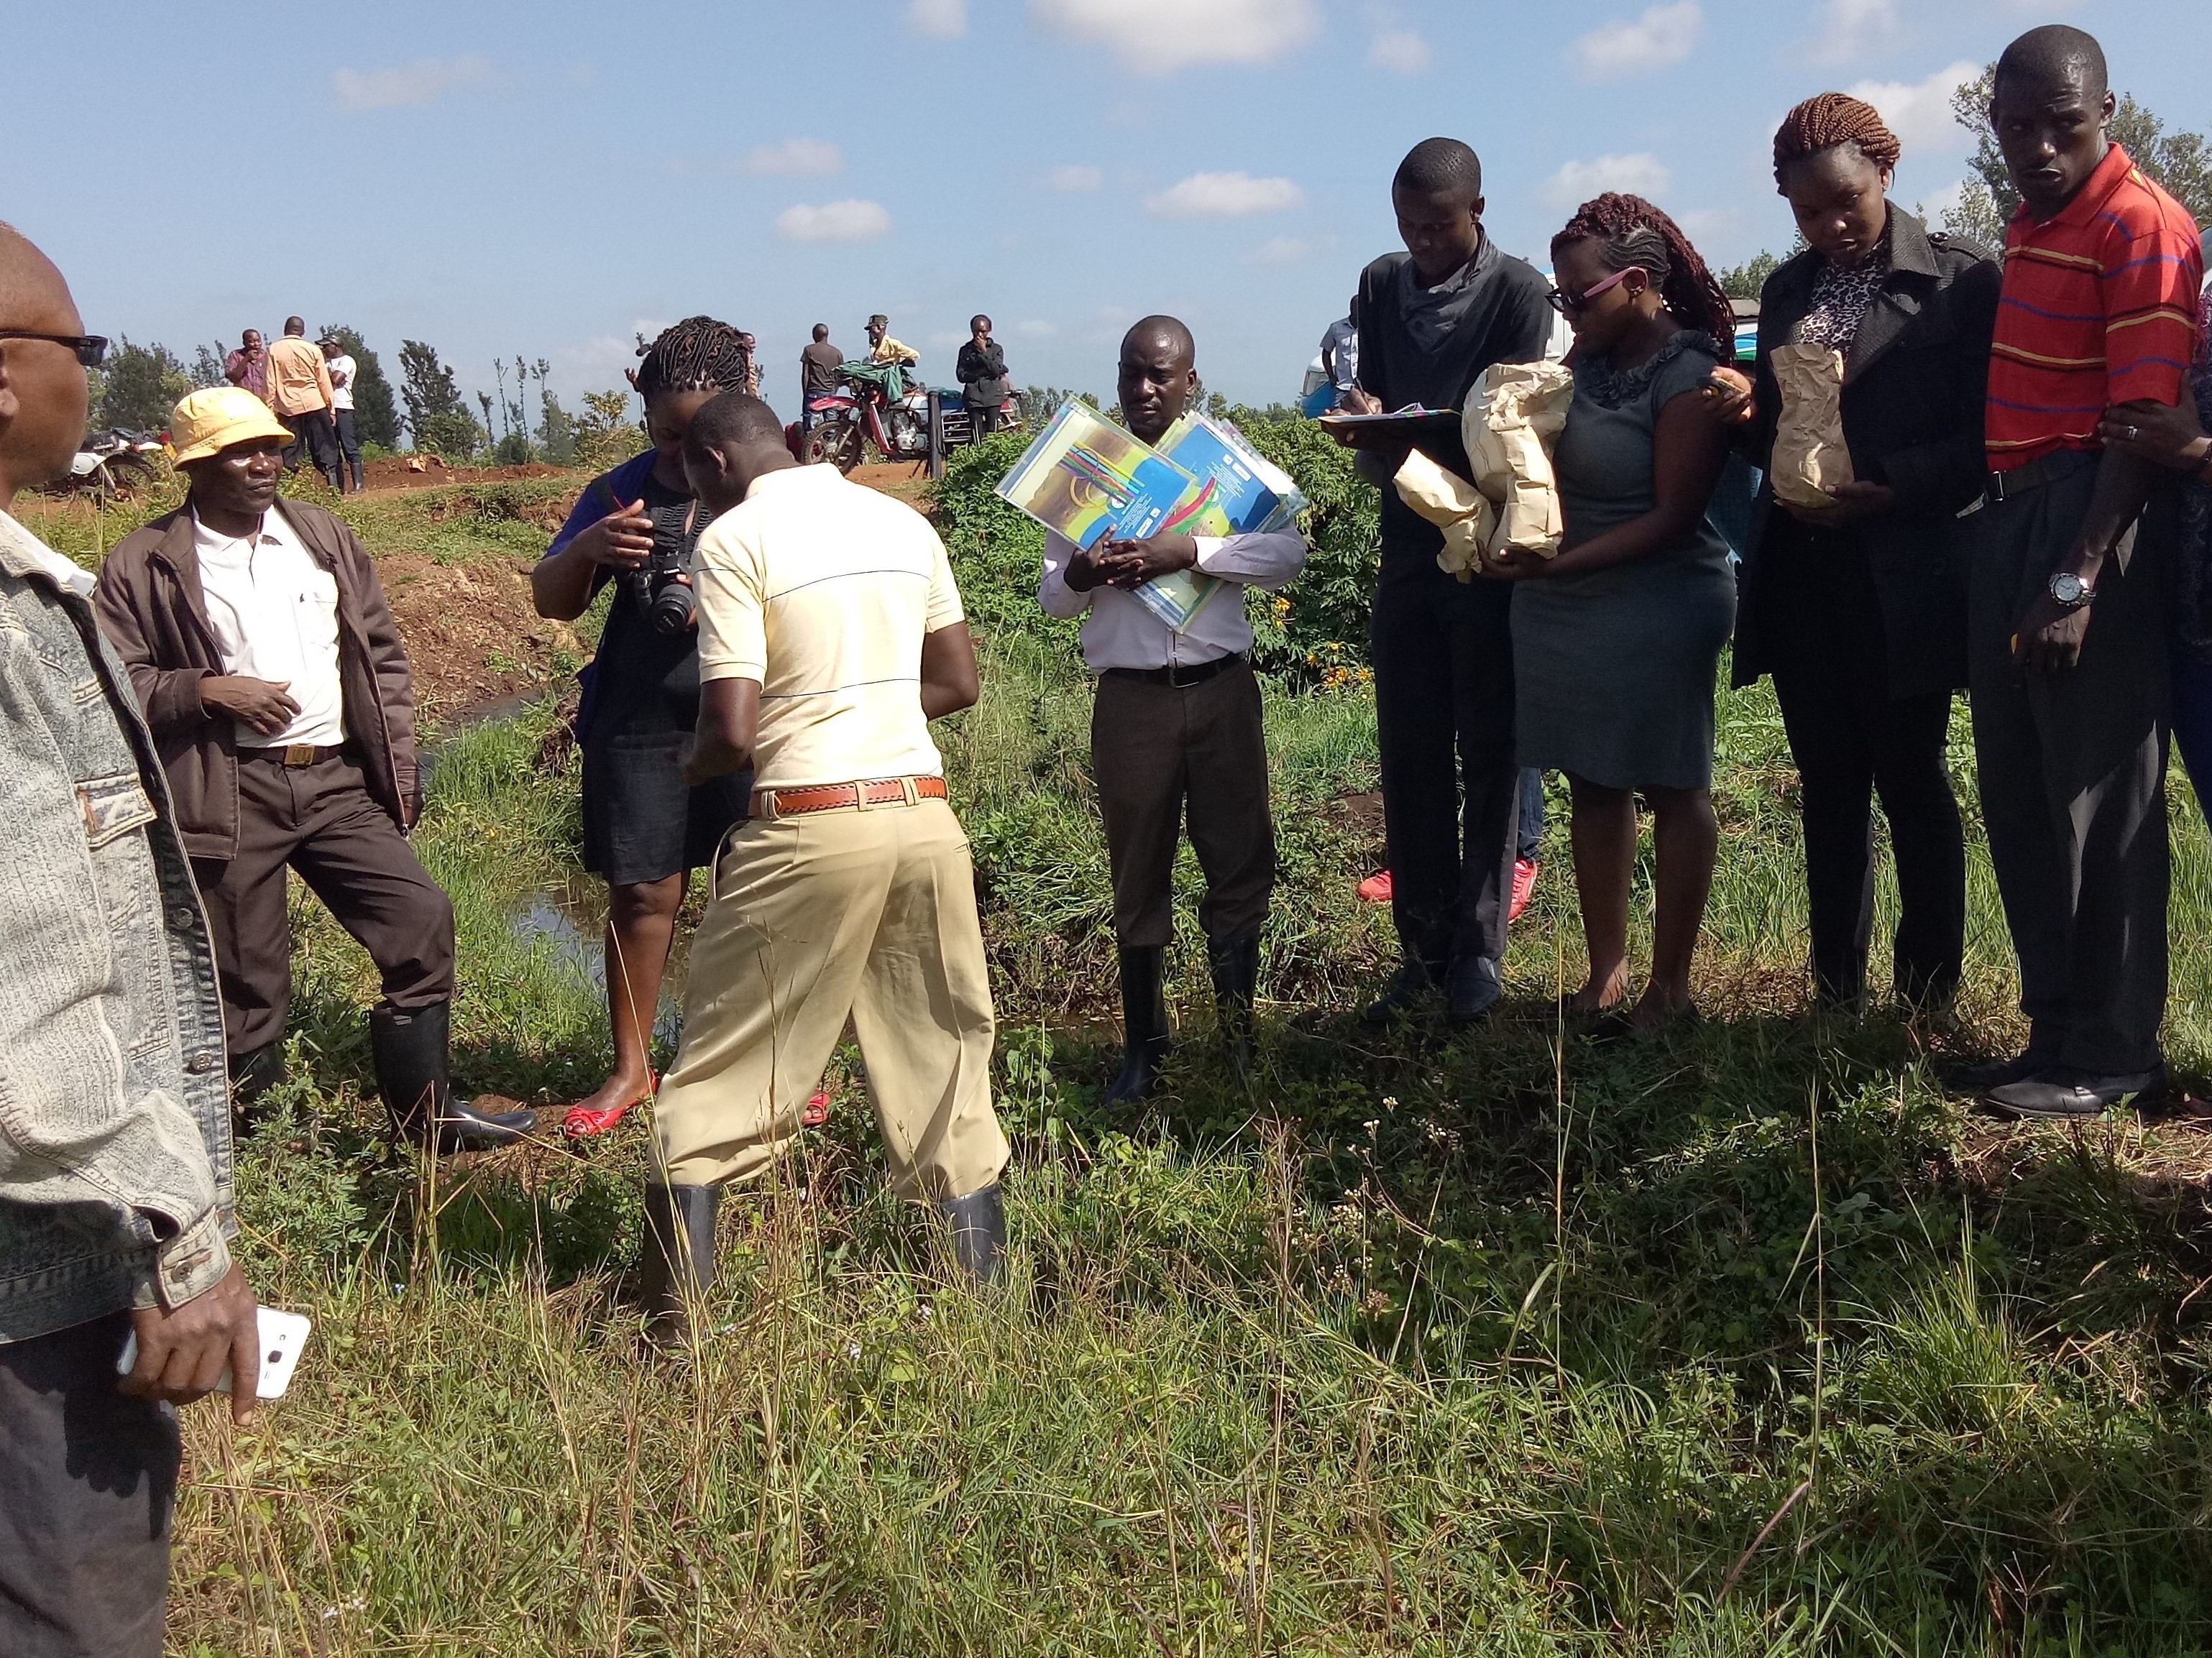
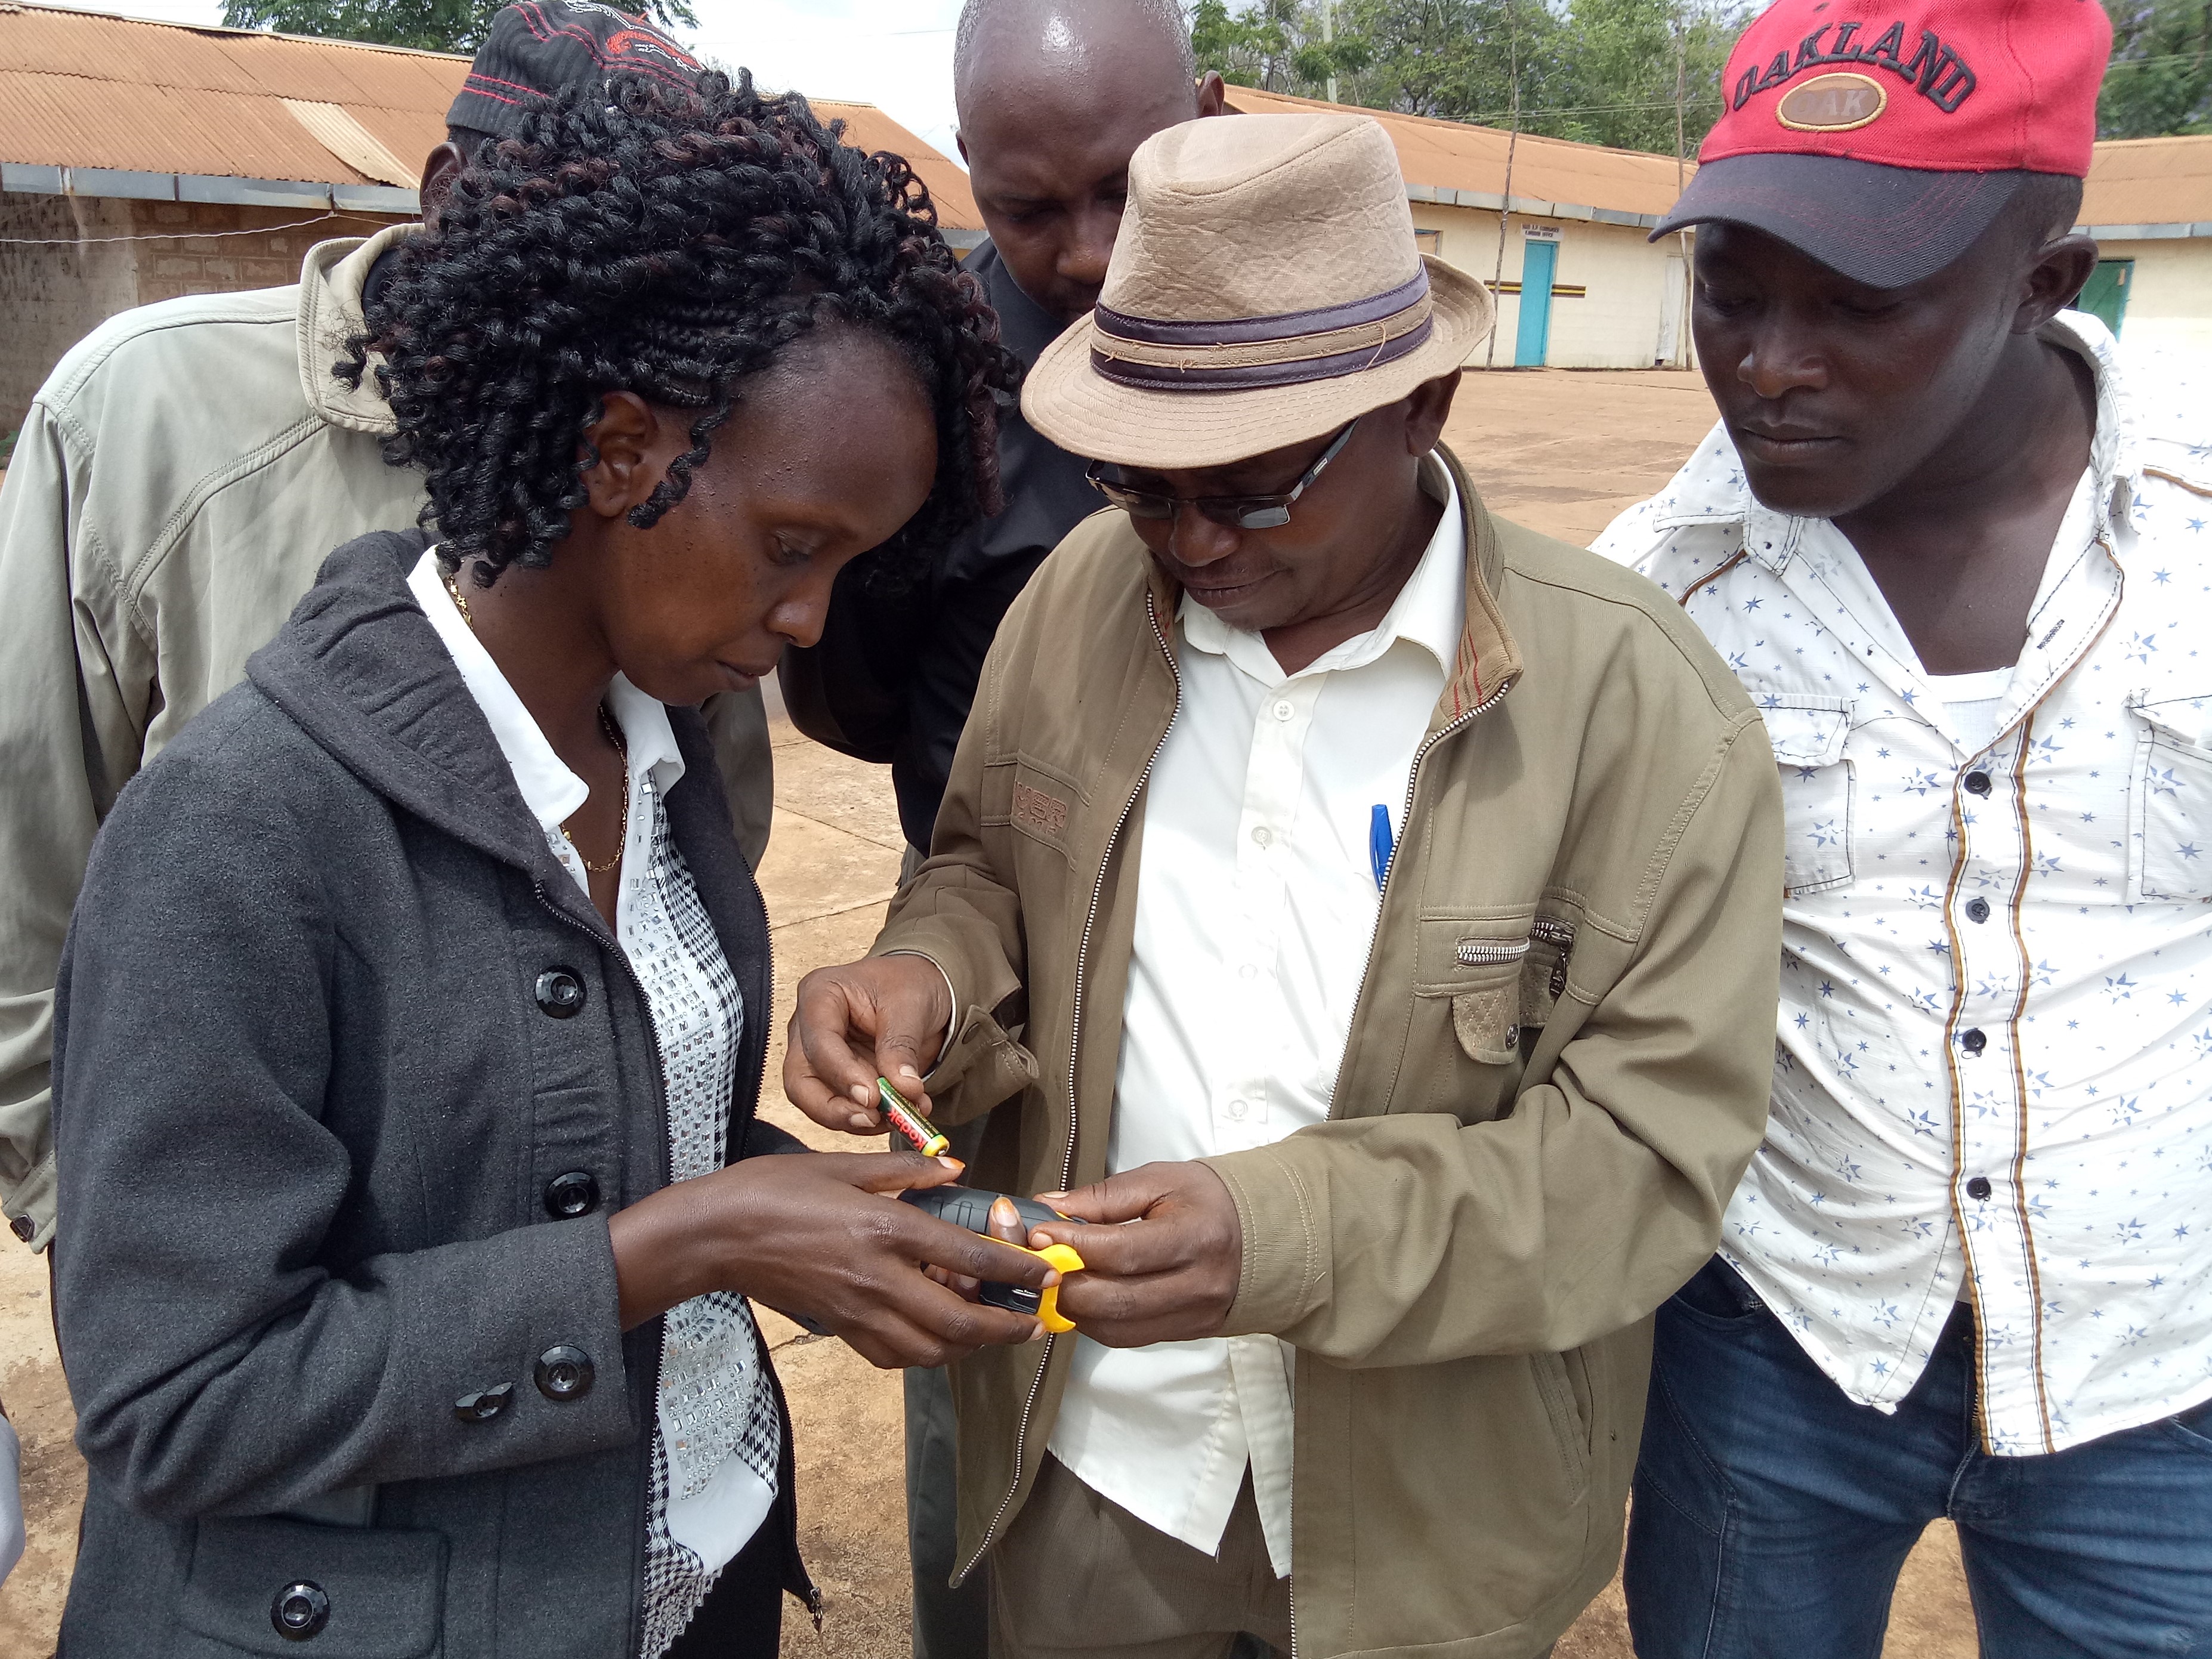
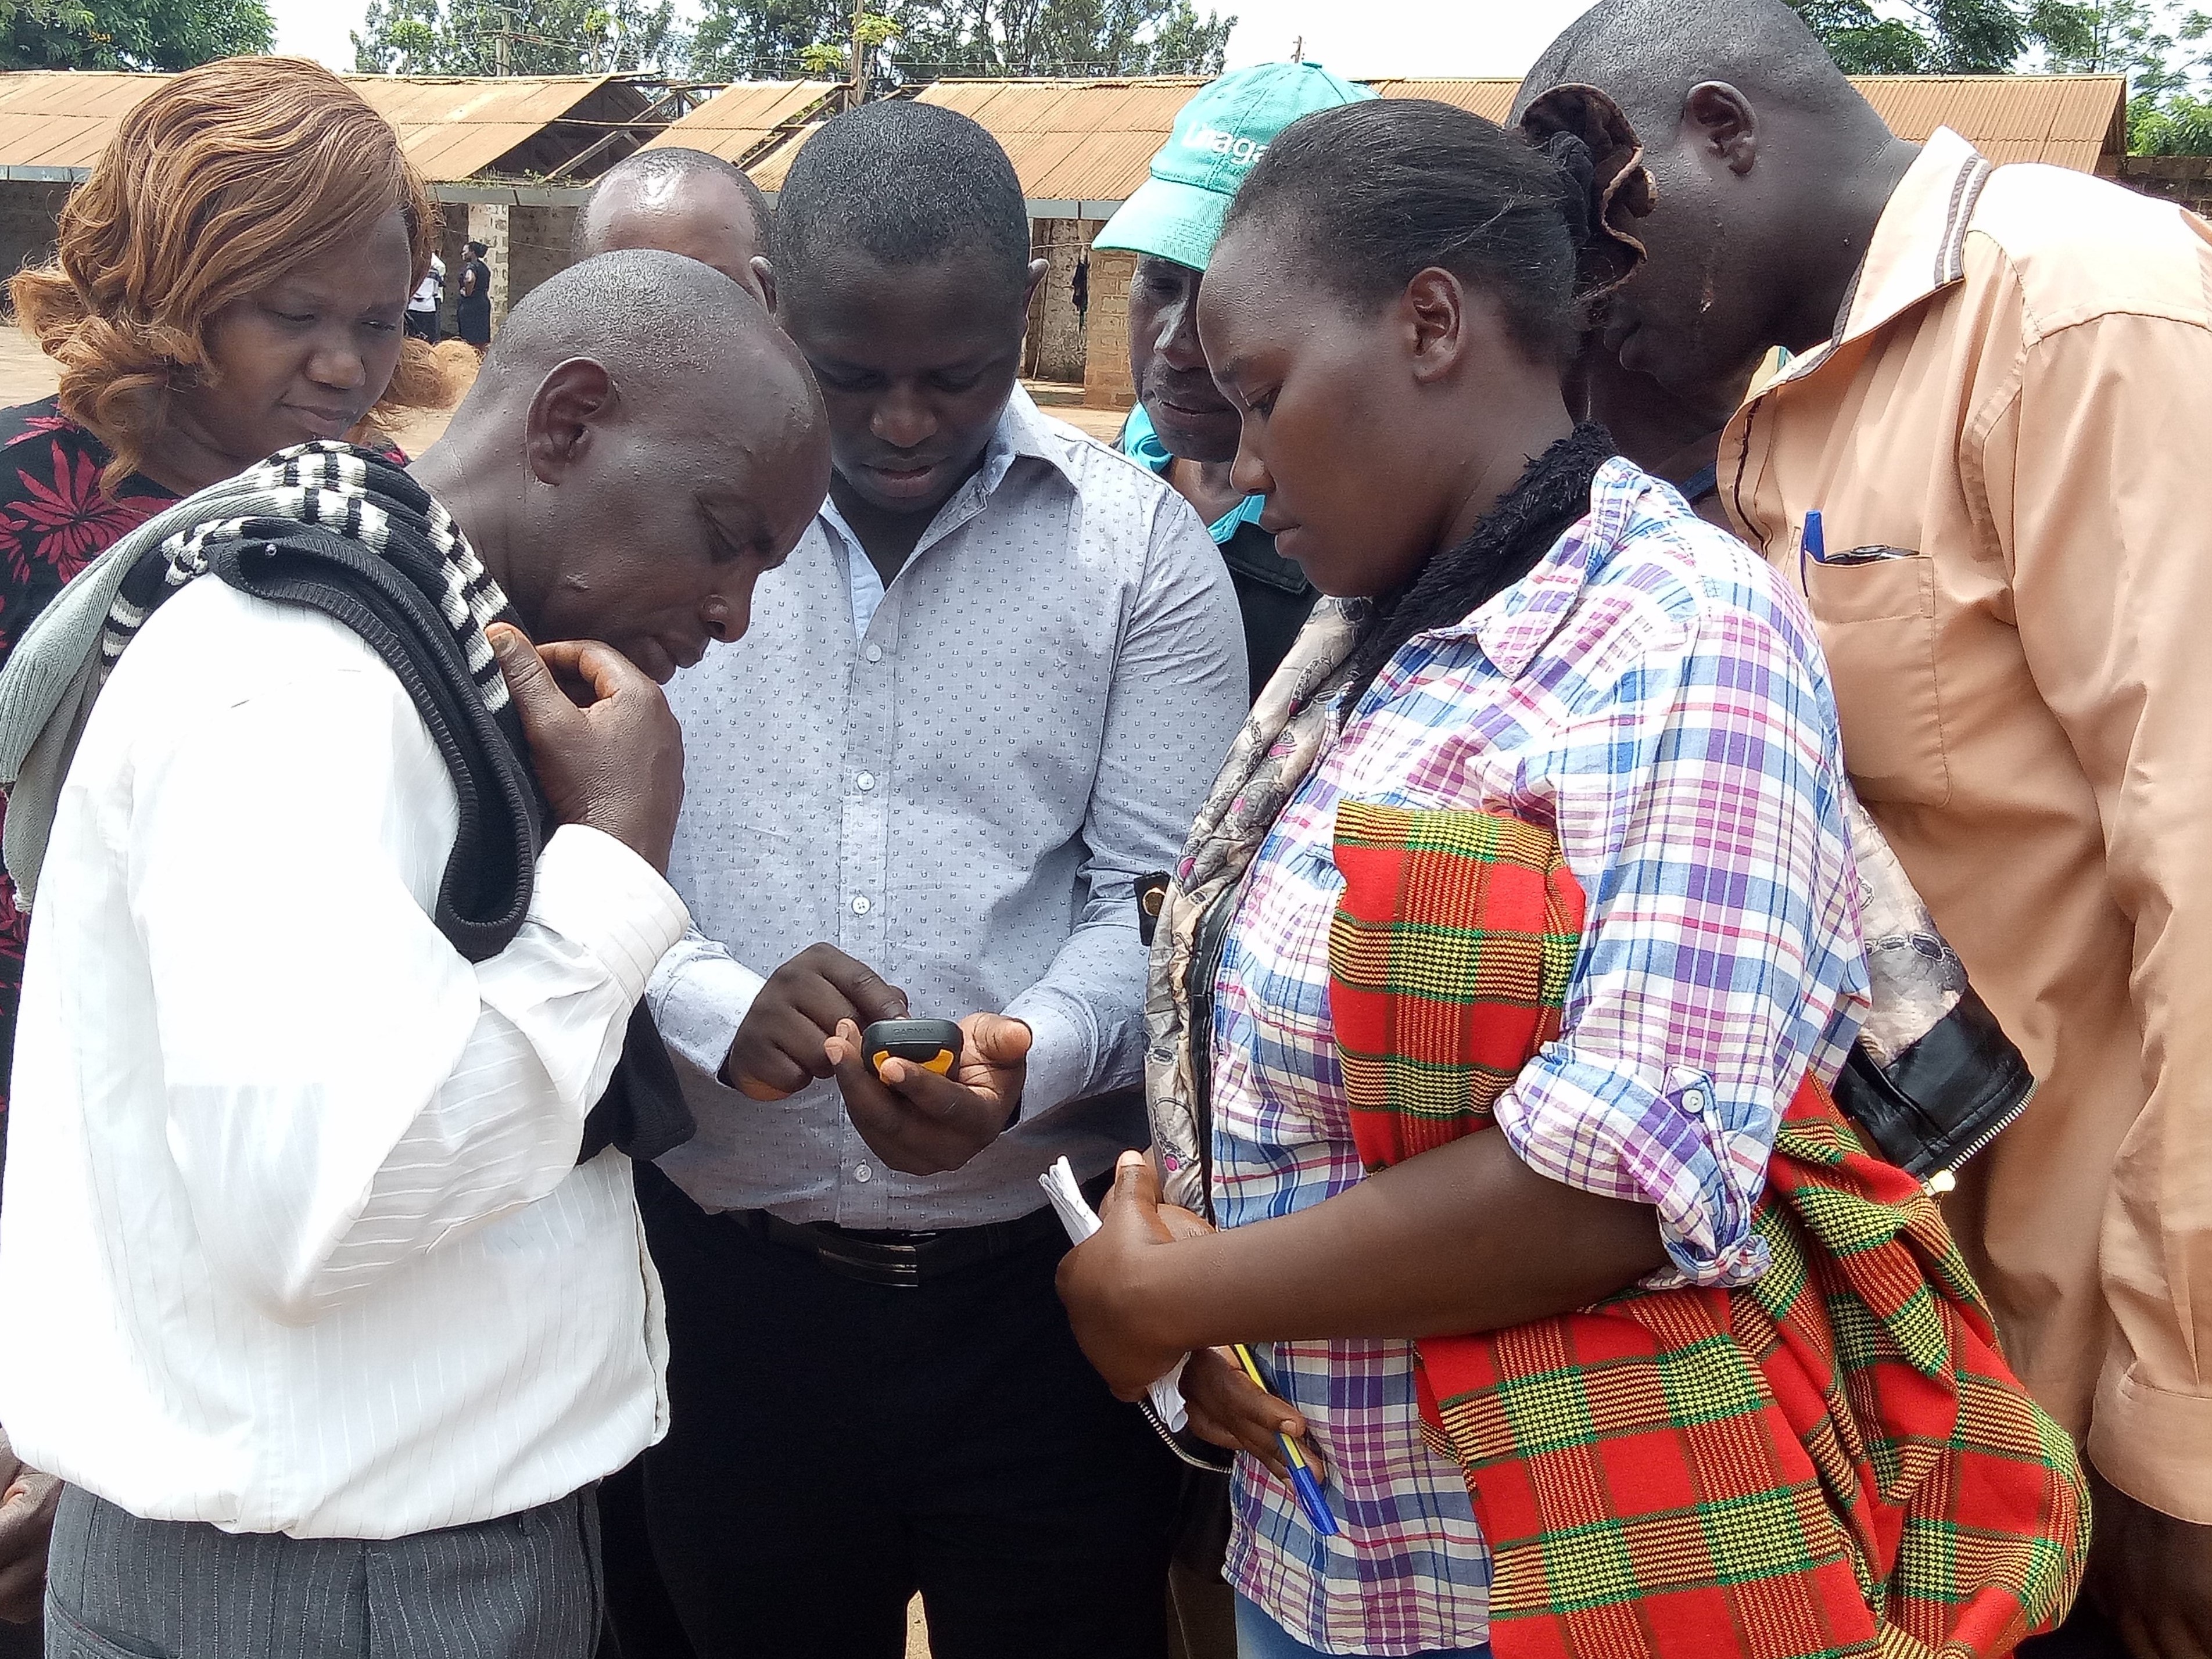
Technology application: The Social Tenure Domain Model is applied in order to relate natural and human environments. It is a social tool that defines the relationship of persons to natural resources such as land, their utilization of it, and sharing - for sustainable development. To realize optimal resource utilization, the tool enables the direct engagement of the resource users in a collective and participatory way. The technology allows communities to be part of a guided data collection and data entry into an STDM platform. The data includes social and economic data based on what is needed. The platform also can enable storage of information and documents such as title deeds. Names, gender, properties where the community members needs to have such information. These details can be updated and can inform planning and resource allocation by government and development partners. Main characteristics of the technology: STDM is a relational database built on an open source GIS platform called Quontum GIS (QGIS), running on Postgres SQL. This tool was built by Global Tools Land Network (GLTN). The tool captures both spatial information related to locations of land parcels, natural resources captured in points and defined in maps. Secondly, the technology captures socio-economic aspects of a resource, and allows definition of the type of relationship that exists between the resource and the person, as well as an indication of the percentage particular tenure regime in the areas including the existing rights and how they play out. The system recognizes the different level of rights thus appreciating that they are multiple and overlaid resulting to multiple uses. Therefore the technology enables the capture of bundles of rights that people have/should enjoy in a resource. The technology allows generation of reports and performs the desired analysis by the proponents and the beneficiaries of the information stored within the databases. It is open source, thus available free -hence its sustainability.The purposes/ functions of the STDM: The functions of the technology as have been piloted by RECONCILE and partners has focused around land tenure. It addresses security of tenure for vulnerable poor communities living within informal settlements, through participatory common resource identification, mapping and documentation, key resources including cattle dips, salt lick areas/fields and water points management has improved. This is due to the recognition of boundaries anticipatorily defined leading to revival of and establishment of community resources management committees especially around water and grazing lands. This in return has improved /increased production of both plants and animals. However, the technology can be customized to serve other purposes of information storage and management. The major activities/ inputs needed to establish/ maintain the technology: Major inputs are needed in empowerment of local communities through building their capacity to apply the technology through their own initiative. Building community-based resource centres and equipping them with computers installed with the software ensures that the technology is centred on the day-to-day activities of the communities and institutions. Benefits/ impacts: The technology has left better organised communities in terms of managing land and other resources. The technology has assisted local governments to manage issues of land ownership, especially within the context of customary land tenure and ownership. The county governments of Kenya, for instance, have spatial data and information that can help in planning and resources allocation. In areas where the technology has been used in the context of RECONCILE's work, better services and resources can be acquired given accurate information of Mapping land tenure, boundaries, water points and the water rights, infrastructure, different grazing lands and plans for the utilization of the grazing land and the rights of different users. It can result in improved and sustainable use of natural resources which in turn have a direct impact on production. Small-scale dairy farmers have been able to manage grazing lands, water and salt licks to improve production of animal products. Information captured and managed by the technology has enabled communities within informal settlements to negotiate with government authorities to enable land allocation and thus security of tenure and improved livelihoods.What do land users like / dislike about the technology?Likes: The technology is flexible, it can be customized to capture information in any form desired. It is based on a GIS platform which is easy to manipulate and is open source.Dislikes: Users sometimes encounter errors that are a result of incorrect information entered, and these errors are written with the programming format: thus it requires good knowledge of the technology to remedy this.
2.3 Photos of the Technology
Media Gallery
General remarks regarding photos:
This activity was done to complement the social economic data collected and create the ability to understand the social tenure relationship between farmers and the common resources.
2.5 Country/ region/ locations where the Technology has been applied and which are covered by this assessment
Country:
Kenya
Region/ State/ Province:
Bomet county
Further specification of location:
Kembu sub-county
Specify the spread of the Technology:
- evenly spread over an area
If precise area is not known, indicate approximate area covered:
- 10-100 km2
Comments:
The technology is applicable in both. It can be customized to fit any use. The best outcome though is total area social enumeration and spatial mapping.
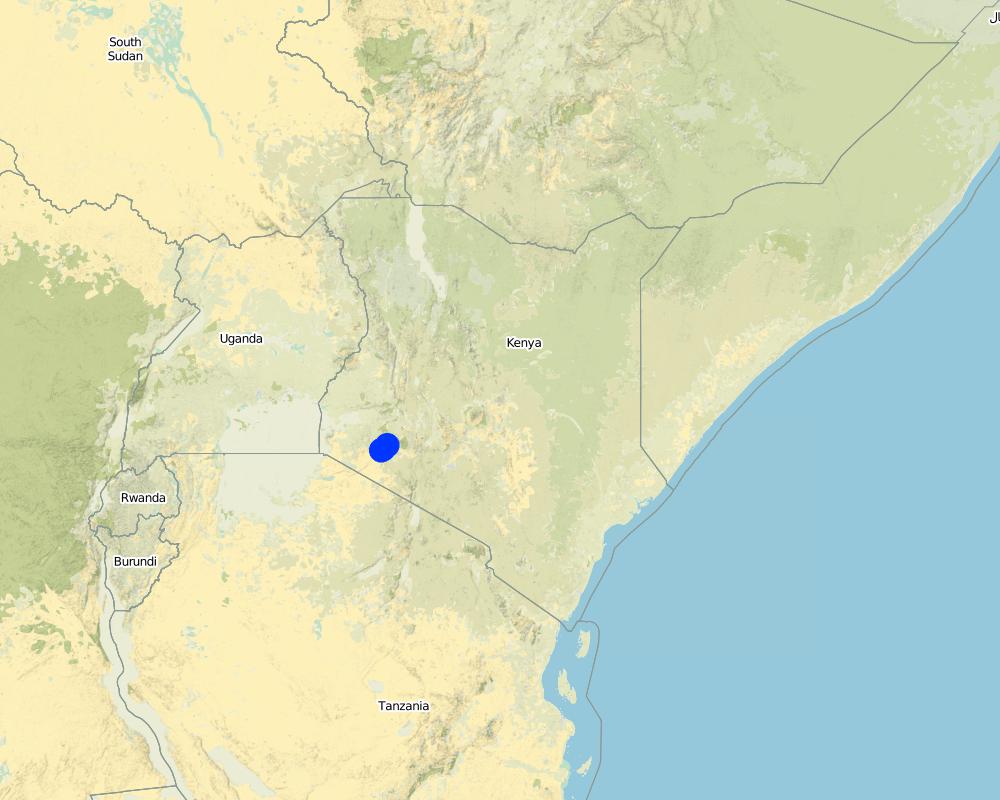
Map
×2.6 Date of implementation
Indicate year of implementation:
2016
2.7 Introduction of the Technology
Specify how the Technology was introduced:
- through projects/ external interventions
3. Classification of the SLM Technology
3.1 Main purpose(s) of the Technology
- improve production
- reduce, prevent, restore land degradation
- conserve ecosystem
- protect a watershed/ downstream areas – in combination with other Technologies
3.2 Current land use type(s) where the Technology is applied
Land use mixed within the same land unit:
Yes
Specify mixed land use (crops/ grazing/ trees):
- Agro-pastoralism (incl. integrated crop-livestock)

Cropland
Number of growing seasons per year:
- 2
Specify:
April to October and November through March

Grazing land
Extensive grazing:
- Semi-nomadic pastoralism
Intensive grazing/ fodder production:
- Cut-and-carry/ zero grazing
Animal type:
- cattle - non-dairy beef
- cattle - dairy
Products and services:
- milk
- skins/ hides
- meat
Comments:
Main animal species and products: The cattle kept in Ndaraweta are mainly cross-breeds between local animals and Friesian or Ayrshire cattle. The communities are currently in an advance stage of upgrading, but they still keep some short-horned local zebu cows as well. The cattle are kept for multiple uses including milk, meat, and hides. The communities grow hay for local use and sale within.
The technology did therefore help the communities to appreciate the common resources that support the livestock keeping.
3.3 Has land use changed due to the implementation of the Technology?
Comments:
Before the mapping exercise, the management of most common resources were not given much attention. After participatory mapping and documenting these resources and the establishment of information on encroachment, degradation and the neglected water points, communities took up the management of the resources more seriously and therefore improved knowledge and clarity around the land tenure rights for the communities and the need for tenure security and protection of rangelands and the resources therein.
3.4 Water supply
Water supply for the land on which the Technology is applied:
- rainfed
3.5 SLM group to which the Technology belongs
- natural and semi-natural forest management
- pastoralism and grazing land management
- integrated crop-livestock management
3.6 SLM measures comprising the Technology

management measures
- M1: Change of land use type
- M2: Change of management/ intensity level
- M3: Layout according to natural and human environment
3.7 Main types of land degradation addressed by the Technology
water degradation
- Hs: change in quantity of surface water
- Hw: reduction of the buffering capacity of wetland areas

other
Comments:
Land degradation in rangelands is a problem that is being experienced and other challenges especially in the areas where agro-pastoralism is practiced include sustainable land use and management. The mapping process while not having direct response to these issues, it demonstrated that the communities can use sustainable means in land use through land use planning.
3.8 Prevention, reduction, or restoration of land degradation
Specify the goal of the Technology with regard to land degradation:
- reduce land degradation
- adapt to land degradation
4. Technical specifications, implementation activities, inputs, and costs
4.1 Technical drawing of the Technology
Technical specifications (related to technical drawing):
The overall space or measurements for the project areas were within the range of 25 to 75 square kilometres.
Author:
RECONCILE
Date:
15/06/2016
4.2 General information regarding the calculation of inputs and costs
Specify how costs and inputs were calculated:
- per Technology area
Indicate size and area unit:
Each project area 25 km2 (Project areas of three Sub-Counties 75 km2)
Specify currency used for cost calculations:
- USD
If relevant, indicate exchange rate from USD to local currency (e.g. 1 USD = 79.9 Brazilian Real): 1 USD =:
101.0
Indicate average wage cost of hired labour per day:
between Ksh. 2000 to 3000 depending on the kind of labour required and can go down to a compromised rate of ksh. 1000.
4.3 Establishment activities
| Activity | Timing (season) | |
|---|---|---|
| 1. | Enumeration of at least 1000 farmers | 9 months |
| 2. | Mapping of communal resources water points, salt lick areas, cattle dips etc | 9 months |
| 3. | Mapping of private resources water points within the private areas | 9 months |
| 4. | Data Management | 3 months |
| 5. | Preparation of data collection including testing of the tools | 1 month |
| 6. | Dialogue sessions with community leaders | 2 months |
| 7. | Negotiations on the methodology for data collection and the kind of information to be collected/asked | 1 month |
| 8. | Technical reviews and reflection with project team and partners | 1 month |
Comments:
The kind of tasks undertaken in this process is more project oriented combined with advocacy and policy processes.
4.4 Costs and inputs needed for establishment
| Specify input | Unit | Quantity | Costs per Unit | Total costs per input | % of costs borne by land users | |
|---|---|---|---|---|---|---|
| Labour | Enumerators | persons | 90.0 | 50.0 | 4500.0 | |
| Labour | Consultants | Persons | 6.0 | 1000.0 | 6000.0 | |
| Labour | Technical Staff contribution and time | persons | 5.0 | 750.0 | 3750.0 | |
| Labour | Data processing and management | persons | 24.0 | 60.0 | 1440.0 | |
| Equipment | Data entry and analysis | persons | 20.0 | 40.0 | 800.0 | |
| Equipment | GPS hiring | 120.0 | 55.0 | 6600.0 | ||
| Equipment | GPS purchase | 5.0 | 320.0 | 1600.0 | ||
| Equipment | Computers | 4.0 | 750.0 | 3000.0 | ||
| Equipment | Conferences | 9.0 | 1500.0 | 13500.0 | ||
| Other | Administrative costs | 9 months | 9.0 | 1400.0 | 12600.0 | |
| Other | Logistical support | 36.0 | 600.0 | 21600.0 | ||
| Other | Preliminary activities including targeted dialogue etc | Travels and associated costs | 5.0 | 300.0 | 1500.0 | |
| Other | Documentation of the project (to be finalized) | Video documentary | 2.0 | 3000.0 | 6000.0 | |
| Total costs for establishment of the Technology | 82890.0 | |||||
| Total costs for establishment of the Technology in USD | 820.69 | |||||
If land user bore less than 100% of costs, indicate who covered the remaining costs:
UNHABITAT, RECONCILE, Smallholder Dairy Commercialization Programme (SDCP)
Comments:
The project was supported by the UNHABITAT with contributions from RECONCILE and partners. the community contribution in kind is not included since it has not been tabulated in terms of cash.
4.5 Maintenance/ recurrent activities
| Activity | Timing/ frequency | |
|---|---|---|
| 1. | NA | |
| 2. | NA | |
| 3. | NA |
Comments:
The project did not have physical structures developed. However, as a result of the work structures like cattle dips have been rehabilitated and are currently being maintained by the the communities themselves. This does not need recurrent costs for maintenance or otherwise by the project.
4.7 Most important factors affecting the costs
Describe the most determinate factors affecting the costs:
The technology costs are dependent on the size and number of resources targeted by the process. It will therefore define the costs accordingly.
5. Natural and human environment
5.1 Climate
Annual rainfall
- < 250 mm
- 251-500 mm
- 501-750 mm
- 751-1,000 mm
- 1,001-1,500 mm
- 1,501-2,000 mm
- 2,001-3,000 mm
- 3,001-4,000 mm
- > 4,000 mm
Specifications/ comments on rainfall:
The area is sub-humid.
Indicate the name of the reference meteorological station considered:
Kenya Meteorological department
Agro-climatic zone
- humid
- sub-humid
The average temperature in Bomet is 17.5 °C. Precipitation averages 1247 mm.
5.2 Topography
Slopes on average:
- flat (0-2%)
- gentle (3-5%)
- moderate (6-10%)
- rolling (11-15%)
- hilly (16-30%)
- steep (31-60%)
- very steep (>60%)
Landforms:
- plateau/plains
- ridges
- mountain slopes
- hill slopes
- footslopes
- valley floors
Altitudinal zone:
- 0-100 m a.s.l.
- 101-500 m a.s.l.
- 501-1,000 m a.s.l.
- 1,001-1,500 m a.s.l.
- 1,501-2,000 m a.s.l.
- 2,001-2,500 m a.s.l.
- 2,501-3,000 m a.s.l.
- 3,001-4,000 m a.s.l.
- > 4,000 m a.s.l.
Indicate if the Technology is specifically applied in:
- not relevant
5.3 Soils
Soil depth on average:
- very shallow (0-20 cm)
- shallow (21-50 cm)
- moderately deep (51-80 cm)
- deep (81-120 cm)
- very deep (> 120 cm)
Soil texture (topsoil):
- coarse/ light (sandy)
Soil texture (> 20 cm below surface):
- coarse/ light (sandy)
5.4 Water availability and quality
Ground water table:
5-50 m
Availability of surface water:
medium
5.5 Biodiversity
Species diversity:
- medium
Habitat diversity:
- low
5.6 Characteristics of land users applying the Technology
Sedentary or nomadic:
- Sedentary
- Semi-nomadic
Market orientation of production system:
- mixed (subsistence/ commercial)
Off-farm income:
- 10-50% of all income
Relative level of wealth:
- average
Individuals or groups:
- groups/ community
- cooperative
Level of mechanization:
- manual work
- animal traction
Gender:
- women
- men
Age of land users:
- youth
- middle-aged
5.7 Average area of land used by land users applying the Technology
- < 0.5 ha
- 0.5-1 ha
- 1-2 ha
- 2-5 ha
- 5-15 ha
- 15-50 ha
- 50-100 ha
- 100-500 ha
- 500-1,000 ha
- 1,000-10,000 ha
- > 10,000 ha
Is this considered small-, medium- or large-scale (referring to local context)?
- small-scale
5.8 Land ownership, land use rights, and water use rights
Land ownership:
- communal/ village
- individual, titled
Land use rights:
- communal (organized)
- individual
Water use rights:
- open access (unorganized)
- communal (organized)
5.9 Access to services and infrastructure
health:
- poor
- moderate
- good
education:
- poor
- moderate
- good
technical assistance:
- poor
- moderate
- good
employment (e.g. off-farm):
- poor
- moderate
- good
markets:
- poor
- moderate
- good
energy:
- poor
- moderate
- good
roads and transport:
- poor
- moderate
- good
drinking water and sanitation:
- poor
- moderate
- good
financial services:
- poor
- moderate
- good
6. Impacts and concluding statements
6.1 On-site impacts the Technology has shown
Socio-economic impacts
Production
fodder production
Comments/ specify:
The production in the farms increased for milk
fodder quality
Comments/ specify:
The size of fodder producers also increased. the production trend is stable based on the number of farmers involved.
animal production
Income and costs
farm income
Comments/ specify:
Resulting from the proper land use and increased milk production based on more pasture, costs increased.
Ecological impacts
Climate and disaster risk reduction
drought impacts
6.2 Off-site impacts the Technology has shown
water availability
reliable and stable stream flows in dry season
buffering/ filtering capacity
impact of greenhouse gases
6.3 Exposure and sensitivity of the Technology to gradual climate change and climate-related extremes/ disasters (as perceived by land users)
Gradual climate change
Gradual climate change
| Season | increase or decrease | How does the Technology cope with it? | |
|---|---|---|---|
| annual rainfall | decrease | moderately |
Other climate-related consequences
Other climate-related consequences
| How does the Technology cope with it? | |
|---|---|
| reduced growing period | moderately |
6.4 Cost-benefit analysis
How do the benefits compare with the establishment costs (from land users’ perspective)?
Short-term returns:
positive
Long-term returns:
very positive
How do the benefits compare with the maintenance/ recurrent costs (from land users' perspective)?
Short-term returns:
neutral/ balanced
Long-term returns:
positive
6.5 Adoption of the Technology
- > 50%
If available, quantify (no. of households and/ or area covered):
The technology covered around 500 individual farmers.
Of all those who have adopted the Technology, how many did so spontaneously, i.e. without receiving any material incentives/ payments?
- 11-50%
Comments:
The technology application did not attract any material gains or incentives but, the process was community centered thus the adoption.
6.6 Adaptation
Has the Technology been modified recently to adapt to changing conditions?
Yes
Specify adaptation of the Technology (design, material/ species, etc.):
The technology was more of the urban oriented tool but had to be modified to adopt to the local demands.
6.7 Strengths/ advantages/ opportunities of the Technology
| Strengths/ advantages/ opportunities in the land user’s view |
|---|
| Ability to define spatial space and common and private resources including those resources associated with milk production such as milk coolers, water points, cattle dips, food stores, grazing areas, salt licks, crushes, animal corridors, forest etc.Establishes the carrying capacity of communal shared resources. |
| Establishment of the land tenure system of shared communal resources and issues arising.Status (management) of private resources within the rangelands.Production and income generated against household size. |
| Strengths/ advantages/ opportunities in the compiler’s or other key resource person’s view |
|---|
| The nature of the problem required innovative use in the mapping of the land and natural resources.The technology addressed immediate needs and provided a foundation for future updates and demands.The technology benefited from the existing data and improved delivery of output without any impediments. |
| The technology bridged the gap through skills transfer and capacity building and in facilitating dialogue on issues affecting the community (Maps, reports). Ability to adapt the technology in a simple manner that the users can relate to, and find value in their use contributed immensely to successIntroduced even a more user-friendly use of mobile and smart-phones. The “quick win” could be seen in the transformation of mobile phones into data collection tools and the data can be seen, verified and shared, replacing the tedious manual process which many were struggling with. |
| STDM databases accommodate the inclusion of social, economic and spatial data that can be maintained, accessed and updated by the communities anytime.Provided visual representation of available resources and their distribution and people can relate to spatial information on the map. |
| Ownership of technology by local people who are now leading on data collection, customizing the template, developing reports and innovating on its use. |
6.8 Weaknesses/ disadvantages/ risks of the Technology and ways of overcoming them
| Weaknesses/ disadvantages/ risks in the land user’s view | How can they be overcome? |
|---|---|
| The design of the tool was more urban oriented and it took time to be adapted for rural use especially where land is communal and customary rights are key. | Created more awareness. |
| Weaknesses/ disadvantages/ risks in the compiler’s or other key resource person’s view | How can they be overcome? |
|---|---|
| Difficult to set-up the server environment where no internet is available.Engaging other service providers may be difficult and takes time (Internet service provider need to authorize setting up additional server).Appropriate devices for capturing data may require an additional budget. | The internet component remains a challenge Technology is evolving and needs systematic information channels between the community members.The process requires proper funding in order not to have a break in between. |
7. References and links
7.1 Methods/ sources of information
- field visits, field surveys
900
- interviews with land users
900
- interviews with SLM specialists/ experts
2
- compilation from reports and other existing documentation
When were the data compiled (in the field)?
11/12/2017
7.3 Links to relevant online information
Title/ description:
RECONCILE end of project report and other progress reports are available for sharing
Title/ description:
Food security in Bomet county
URL:
awsc.uonbi.ac.ke/sites/default/files/chss/arts/.../Bomet-final.doc
Links and modules
Expand all Collapse allLinks
No links
Modules
No modules